This is a repository copy of Interactions between landscape elements and tranquility
evaluation based on eye tracking experiments..
White Rose Research Online URL for this paper:
http://eprints.whiterose.ac.uk/93208/
Version: Accepted Version
Article:
Ren, X. and Kang, J. (2015) Interactions between landscape elements and tranquility
evaluation based on eye tracking experiments. The Journal of the Acoustical Society of
America , 138 (5). 3019 . - . ISSN 0001-4966
https://doi.org/10.1121/1.4934955
[email protected] https://eprints.whiterose.ac.uk/ Reuse
Unless indicated otherwise, fulltext items are protected by copyright with all rights reserved. The copyright exception in section 29 of the Copyright, Designs and Patents Act 1988 allows the making of a single copy solely for the purpose of non-commercial research or private study within the limits of fair dealing. The publisher or other rights-holder may allow further reproduction and re-use of this version - refer to the White Rose Research Online record for this item. Where records identify the publisher as the copyright holder, users can verify any specific terms of use on the publisher’s website.
Takedown
If you consider content in White Rose Research Online to be in breach of UK law, please notify us by
X. Ren, J. Kang / J. Acoust. Soc. Am. 138(5), November 2015, Pages3019–3022
*Corresponding author. Tel.: +44 114 222 0325; fax: +44 114 222 0315.
E-mail address: j. [email protected] (J. Kang).
Interactions between landscape elements and tranquility
evaluation based on eye tracking experiments
Xinxin Ren a , b, Jian Kang b*,a
a
School of Architecture, Harbin Institute of Technology, Harbin 150001, People’s Republic of China
b
School of Architecture, University of Sheffield, Western Bank,Sheffield S10 2TN, United Kingdom
ABSTRACT
Visual attention in tranquility evaluations has been examined by eye tracking experiments using audiovisual materials collected in traditional villages of China. The results show that without
sound stimuli, the attention areas in tranquility evaluations are more concentrated, compared with those in visual aesthetic quality evaluations. With sound stimuli, the attention areas of tranquility evaluations disperse significantly from those without sound stimuli, where artificial sounds tend to
expand the visual attention area on corresponding artificial landscape elements, whereas natural sounds promote larger attention areas on natural landscape elements. During information extraction for tranquility evaluations, both with and without sound stimuli, buildings and facilities,
the sky, and vegetation are attractive landscape elements.
1. Introduction
Tranquility is one of the most positive features of the countryside that differentiates it from urban environments, and the importance of the tranquility of the countryside has been recently
recognized for the recreational and amenity value.1 However, the tranquil areas in the countryside are under threat from intrusive developments such as noisy roads and motorways,2 and the
intrusion is influenced by both the sound and visual environments. 3-5
While a number of useful conclusions have been made regarding the audiovisual
environment of rural landscapes, 6-11 there is still a lack of studies exploring the visual attention of rural landscapes in tranquility evaluations while considering different sounds. In this research, therefore, the visual attention of landscapes in tranquility evaluations with and without sound
stimuli is examined by carrying out eye tracking experiments using Tobii T60XL Eye Tracking equipment—an objective recorder of human eye movement characteristics when dealing with visual information, based on landscape field pictures and sounds collected from typical villages in
China, which are undergoing rapid urbanization.
2. Method
The methodology consisted of five steps: (1) collecting audiovisual materials through field
investigation, (2) calibrating and editing audiovisual clips, (3) designing experiment conditions, (4) conducting the eye tracking experiment in visual-only conditions, and (5) conducting the eye
tracking experiment in audiovisual conditions.
Pictures have been used, as valid landscape surrogates, in a number of perception-based
X. Ren, J. Kang / J. Acoust. Soc. Am. 138(5), November 2015, Pages3019–3022
[DOI: 10.1121/1.4934955] 2
traditional rural settlements in Heilongjiang, Jilin, and Liaoning provinces in China, on clear summer days in 2014, at a height of approximately 1.5 m above the ground, with typical angles
and panoramic color for landscape pictures.8 Considering the typical categories of Chinese rural landscapes and certain landscape visual attributes, such as openness, naturalness and traditional architecture, 11, 14 four pictures were selected, with landscape types of a distant view, paddy field,
waterscape, and courtyard, respectively.
A FOSTEX FR-2LE high-fidelity audio recorder was used for sound recordings. Two typical sounds including one natural and one artificial sound 5, 9, 15-20 for each landscape type were
recorded in the villages. They were bird twittering and highway traffic sounds for the distant view, cricket chirping and tractor working sounds for the paddy field, water flowing and hawker selling
sounds for the waterscape, and cock crowing and construction sounds for the courtyard.
The eight recorded sound signals were calibrated through a dummy head, Sennheiser RS 170
headphones, and 01dB software. Each sound signal was then adjusted to 50 dBA (the mean sound pressure level in the field measurements approximately), and edited as 10-second clips, using
Cooledit software. Correspondingly, each picture was displayed in the screen area of eye tracker for 10 s, an appropriate duration for stationary landscapes. 8
In the visual-only experiments visual aesthetic quality (VAQ) and tranquility were both
evaluated, and for audiovisual conditions only tranquility was considered. For VAQ, “ugly” and “beautiful” 10-11
were chosen as indicators, whereas for tranquility “tranquil” and “noisy” were used. 3-5, 8 In the experiments the landscapes were asked to evaluated from the prospective of a
scenery rather than a dwellling place.
Participants were 20 randomly selected university students, a method commonly used in similar studies on subjective acoustic evaluation, landscape visual evaluation, and eye- tracking
test inside the laboratory. 12-13, 21, 22 They sat in front of the eye tracker in a comfortable and natural way in the eye tracking laboratory. The experimental procedure included a calibration for
matching the participant characteristics with the corresponding coordinates of the point-of-regard, and an eye flexibility test, through fixing on a dot moving on in a blank screen. Then the
visual-only experiment was conducted, where the participants were asked to view the pictures in a random order, with the question of “Please evaluate the landscape presented, is it beautiful or
ugly?” After a 20-second break, they were asked to view the pictures randomly again, with a question of “Please evaluate the landscape presented, is it tranquil or noisy?”
The audiovisual experiment was then conducted. The participants were asked to put on
headphones and experience the audiovisual environments in a random order with the same evaluation question for tranquility, where one landscape picture was coupled to the two sound signals (natural and artificial sound).
3. Results
The results are based on the analyses of attention areas in heat maps, one-way analysis of variance (ANOVA), and post-hoc analysis for the four target groups: (a) VAQ without sound stimuli, (b) tranquility without sound stimuli, (c) tranquility with artificial sound, and (d)
tranquility with natural sound, and regression analysis for tranquility evaluation.
Before processing the data sets, the inter-rater and intra-group 10 reliabilities of the 20 participants for each picture in each evaluation were calculated, showing inter- rater reliability of
X. Ren, J. Kang / J. Acoust. Soc. Am. 138(5), November 2015, Pages3019–3022
average measures), which are acceptable. 10, 23
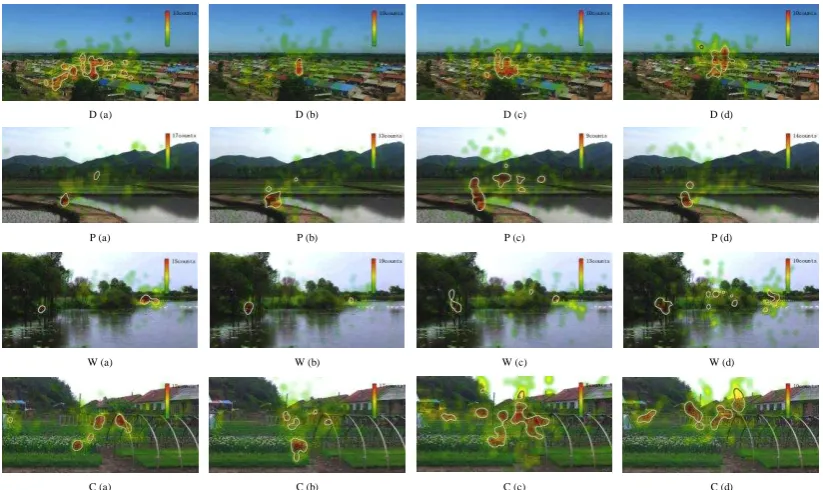
Fig. 1 shows the heat maps of the distant view, paddy field, waterscape, and courtyard in eye
tracking experiments, which are derived from the fixations of the 20 participants. Note that although the percentage of attention areas occupied in the picture is relatively small, from 0.53 in W(b) to 5.63 in C(c), there are substantial differences among target groups. Generally speaking,
the fixations in target group (b) formed more concentrated attention areas than those in target group (a). However, more scattered areas are observed in (c) and (d), namely, the attention areas for tranquility evaluation dispersed under the effects of sounds. Moreover, the visual attention
[image:4.595.92.504.227.472.2]areas differ with the two types of sound.
FIG. 1 Heat maps of representative rural landscapes for four target groups, showing the centers of attention, where
red indicates to the most frequently and intensively observed areas, while green presents the least, with varying levels in between. The color scale with fixation counts (auto-increment number starting from 1) is shown for each of the heat map, and the attention areas with medium to the highest counts (namely, from yellow to red) are circled.
More specifically, compared with D(a), the fixations in D(b) are highly focused along the
axis of the landscape picture and form a more concentrated attention area, while except for buildings which are frequently observed in D(c), more landscape elements are noticed in D(d), based on broad fixations on trees, meadows, skyline, and the sky. In the paddy field landscape,
with the artificial sound of the tractor working, the fixations formed a vertical path from the footpath, and also intermittently focus in a horizontal direction, namely on a road hidden in the
woods in P(c), which is entirely unnoticed in P(d). For the waterscape, the difference between with and without sound is much less with artificial sounds than with natural sounds. It is observed
that more landscape elements were fixated with natural sounds, such as the landscape facility, vegetation, animals, and revetments in W(d). For the courtyard, unlike the concentrated attention
areas appearing along the axis of the landscape in C(b), the attention areas with fixations are much more towards buildings in C(c), also compared with those in C(d). This is possibly because buildings are connected with the construction sound, while natural sound can promote visual
D (a) D (b) D (c) D (d)
P (a) P (b) P (c) P (d)
W (a) W (b) W (c) W (d)
X. Ren, J. Kang / J. Acoust. Soc. Am. 138(5), November 2015, Pages3019–3022
[DOI: 10.1121/1.4934955] 4
attention away from non-naturalness to a certain extent. Correspondingly, the landscape elements within marked areas of visual attention are categorized and calculated. As expected, the results of
the one-way ANOVA show that there are significant differences (p=0.000) among the four target groups.
Similar results are also obtained in recorded data of eye tracking, including the number of
fixations, the fixation duration, the number of gaze points, the StrictAverage X-coordinate of gaze points, and the StrictAverage Y-coordinate of gaze points.13 More specifically, Table 1 shows the results of post-hoc analysis. From the difference in landscape elements it can be seen that the
attention area occupied by vehicle/people is significantly larger in (b) than that in (a). Interestingly, the attention areas of all landscape elements, except vehicle/people, are larger in (c) and (d), than
those in (b). It means that vehicle/people attracted a larger fixated area in tranquility without sound stimuli, while sounds expanded the attention areas of the other landscape elements
significantly, rather than vehicle/people. The significant differences between (c) and (d) prove that natural sounds promote larger natural attention areas, i.e. sky and water, notably. Considering the
differences in recorded data, the fixation duration in (b) is shorter than that in (a), which means the corresponding information extraction and interpretation of the landscape is easier 24 when evaluating tranquility, whereas (c) and (d) are associated with smaller fixation duration and gaze
points, but the number of fixations is larger than that in (b), which suggests that compared with visual-only condition the information is easier to extract, although with more searching and thus more visual exploration (larger fixation number) of the landscapes, 25 when the tranquility
[image:5.595.75.527.443.547.2]evaluation is directed by sounds.
Table 1 Post-hoc results for the attention areas occupied by landscape elements and the eye tracking data for the
four target groups, a p<0.01, b p <0.05
The results on Active Display Coordinate Millimeters in Table I show that either with natural
or artificial sounds the StrictAverage X-coordinate and Y-coordinate of the gaze points are lower than those without sound stimuli in tranquility evaluations. This is possibly because a larger range
of gaze points with saccades were spent on searching and focusing corresponding information for tranquility in the visual-only condition, as can be seen in Fig. 2, where a comparison is made on
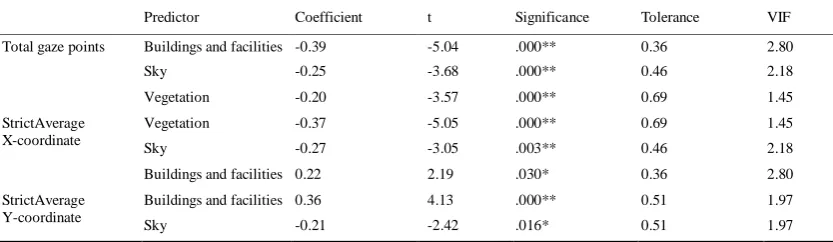
the gaze plot, displaying a static view of the gaze point and visualizing scan paths during eye movement, for the distant view without and with natural sound respectively. Moreover, Table 2 shows the results of a linear regression analysis for tranquility. It can be seen that buildings and
facilities and the sky and vegetation are effective elements (Tolerance >0.1, 0<VIF<5) that attracted gaze points and formed the StrictAverage X-coordinate, whereas buildings and facilities, and the sky are the only two landscape elements significantly associated with Y-coordinate
locating.
Target group
Difference in attention areas occupied by landscape elements Difference in recorded data during eye movement
No- vegetation ground
Buildings and facilities
Vehicle
/ people Vegetation Mountain Sky Water
Total fixations
Fixation duration
Total gaze points
Strict AverageX- coordinasstes
Strict AverageY- coordinates
a - b -32 652a -128a 136 0 0 56a 0.59 194.25a -2.98 -26.72a -22.44a
b - c -252a -720a 32 -980a -32a -56 -4 -469.20 237.74a 3.03a 34.53a 25.82a
b - d -116a -604a 68b -424a 0 -18 -76a -504.37 241.90a 2.59a 34.26a 26.16a
X. Ren, J. Kang / J. Acoust. Soc. Am. 138(5), November 2015, Pages3019–3022
FIG. 2 Gaze plot of the distant view in tranquility evaluation, (a) without sound and (b) with natural sound.
Table 2 Stepwise linear regression summary for gaze data with different landscape elements in tranquility
evaluation, ** p<0.01, *p<0.05
Predictor Coefficient t Significance Tolerance VIF
Total gaze points Buildings and facilities -0.39 -5.04 .000** 0.36 2.80
Sky -0.25 -3.68 .000** 0.46 2.18
Vegetation -0.20 -3.57 .000** 0.69 1.45
StrictAverage X-coordinate
Vegetation -0.37 -5.05 .000** 0.69 1.45
Sky -0.27 -3.05 .003** 0.46 2.18
Buildings and facilities 0.22 2.19 .030* 0.36 2.80
StrictAverage Y-coordinate
Buildings and facilities 0.36 4.13 .000** 0.51 1.97
Sky -0.21 -2.42 .016* 0.51 1.97
4. Conclusions
The results suggest that without sound stimuli, the attention areas of landscapes in tranquility
evaluation are more concentrated than those in VAQ evaluation. With sound stimuli, the corresponding information extraction in landscapes is easier in tranquility evaluations than in
visual-only conditions, and the attention areas are dispersed significantly, depending on different sounds. Generally speaking, artificial sounds tend to expand visual attention areas to include corresponding artificial landscape elements, while natural sounds can take visual attention towards
various elements and promote larger attention areas on natural landscape elements. Buildings and facilities, the sky, and vegetation are attractive landscape elements in tranquility evaluations, with and without sound stimuli.
Acknowledgments
The authors are indebted to H. Jin, C. H. Zhan, Y. M. Guo and Y. Guan for helping with the
experiments, as well as the participants of the experiments. The work is financially supported by the National Natural Science Foundation of China (NSFC) (51378139).
References
1
Department for Environment Food and Rural Affairs (DEFRA), “The English national parks and the Broads: UK Government Vision and Circular 2010” (2010), Sec. 4.
2
CPRE, “Developing an intrusion map of England,” http://www.cpre.org.uk/ resources/countryside/tranquil-places (Last viewed 11/12/2013).
3
G. R. Watts and R. J. Pheasant, “Tranquillity in the Scottish Highlands and Dartmoor National Park The importance of soundscapes and emotional factors,” Appl. Acoust. 89, 297-305 (2015).
4G. R. Watts and R. J. Pheasant, “Factors affecting tranquillity in the countryside
,” Appl. Acoust. 4, 1094-1103 (2013).
5
X. Ren and J. Kang “Effects of soundscape on rural landscape evaluations in China”, Landsc.
[image:6.595.89.506.203.324.2]X. Ren, J. Kang / J. Acoust. Soc. Am. 138(5), November 2015, Pages3019–3022
[DOI: 10.1121/1.4934955] 6
Urban Plan (under review).
6
M. S. Tse, C. K. Chau, Y. S. Choy, W. K. Tsui, C. N. Chan, and S. K. Tang, “Perception of urban
park soundscape,” J. Acoust. Soc. Am. 131, 2762-71 (2012).
7
J. Y. Jeon, P. J. Lee, J. You, and J. Kang, “Acoustical characteristics of water sounds for soundscape enhancement in urban open spaces,” J. Acoust. Soc. Am. 131, 2101-2109 (2012).
8
R. J. Pheasant, M. N. Fisher, G. R. Watt, D. J. Whitaker, and K. V. Horoshenkov, “The importance of auditory-visual interaction in the construction of ‘tranquil space,’” J. Environ. Psychol. 30, 501-509 (2010).
9
K. C. Lam, A. L. Brown, L. Marafa, and K. C. Chau, “Human preference for countryside soundscapes,” Acta Acust. Acust. 96, 463-71 (2010).
10
E. Rogge, F. Nevens, and H. Gulinck,
“
Perception of rural landscapes in Flankers: Looking beyond aesthetics,” Landsc. Urban Plan. 82, 159-174 (2007).11
O. Kalivoda, J. Vojar, Z. Skrivanová, and D. Zahradník, “Consensus in landscape preference judgments: Three effects of landscape visual aesthetic quality and respondents’ characteristics,” J.
Environ. Manage. 137, 36-44 (2014).
12
X. F. Yuan, M. Y. Guo, F. Ren, and F. F. Peng, “Usability analysis of online bank login interface based on eye tracking experiment,” Sens. Transducers. 165, 203-212 (2014).
13
L. Dupont, M. Antrop, and V. Van Eetvelde, “Eye-tracking analysis in landscape perception research: Influence of photograph properties and landscape characteristics,” Landsc Res. 39, 417-432 (2014).
14
H. L. Xie, “Preliminary researches on the functional evaluation of rural landscape,” Acta Ecologica Sinica. 24 (9), 1987-1993 (2004) (in Chinese).
15
X. Ren, J. Kang, and X. G. Liu, “An experimental study on the subjective evaluation of traffic sounds under the visual impact of ecological waterscape,” Acta Acust. 40, 362-369 (2015) (in
Chinese).
16
X. Ren, J. Kang, and H. Jin, “Rural soundscape research of chill regions in China,” New Architec. 5, 56-59 (2014). (in Chinese).
17
X. Ren and J. Kang, “Effects of the visual landscape factors of an ecological waterscape on acoustic comfort,” Appl Acoust. 96, 171-179 (2015).
18J. Kang and M. Zhang, “Semantic differential analysis of the soundscape
in urban open public spaces,” Build Environ. 45, 150-157 (2010).
19
W. Yang and J. Kang, “Acoustic comfort evaluation in urban open publicspaces,” Appl Acoust. 66, 211-229 (2005).
20X. Ren and J. Kang, “Effect of soundscape on rural landscape perception:
Landscape visual aesthetic quality and landscape tranquility of rural landscapes in China,” in Proceedings of Euro Noise 2015, Maastricht, the Netherlands (2015).
21
J. Kang, Urban Sound Environment (Taylor & Francis, London, 2006), pp. 40-96.
22
T. C. Daniel, “Whither scenic beauty? Visual landscape quality assessment in the 21st century,” Landsc. Urban Plan. 54, 267-281(2001).
23
J. Liu, J. Kang, H. Behm, and T. Luo, “Effects of landscape on soundscape perception: Soundwalks in city parks,” Landsc. Urban Plan. 123, 30-40 (2014).
24
M. A. Just and P. A. Carpenter, “Eye fixations and cognitive processes,” Cognit. Psych. 8, 441-480
(1976).
25