Meta-analysis of
genome-wide association studies
identifies common susceptibility
polymorphisms for colorectal and
endometrial cancer near
SH2B3
and
TSHZ1
Timothy HT Cheng1, Deborah Thompson2, Jodie Painter3, Tracy O’Mara3, Maggie Gorman1,
Lynn Martin1, Claire Palles1, Angela Jones1, Daniel D. Buchanan4,5, Aung Ko Win5,
John Hopper5, Mark Jenkins5, Noralane M. Lindor6, Polly A. Newcomb7, Steve Gallinger8,
David Conti9, Fred Schumacher9, Graham Casey9, Graham G Giles5,10,11, Paul Pharoah2,12,
Julian Peto13, Angela Cox14, Anthony Swerdlow15, Fergus Couch16,17, Julie M Cunningham16,
Ellen L Goode17, Stacey J Winham17, Diether Lambrechts18, Peter Fasching19,20,
Barbara Burwinkel21,22, Hermann Brenner22,23, Hiltrud Brauch22,23, Jenny Chang-Claude23,
Helga B. Salvesen24, Vessela Kristensen25, Hatef Darabi26, Jingmei Li26, Tao Liu26,
Annika Lindblom26, Per Hall27, Magdalena Echeverry de Polanco28, Monica Sans29,
Angel Carracedo30, Sergi Castellvi-Bel31, Augusto Rojas-Martinez32, Samuel Aguiar
Jnr33, Manuel R. Teixeira34, Alison M Dunning12, Joe Dennis2, Geoffrey Otton35,
Tony Proietto35, Elizabeth Holliday36, John Attia36, Katie Ashton36, Rodney J Scott36,
Mark McEvoy37, Sean C Dowdy38, Brooke L Fridley39, Henrica MJ Werner40,
Jone Trovik40, Tormund S Njolstad40, Emma Tham26, Miriam Mints41, Ingo Runnebaum42,
Peter Hillemanns43, Thilo Dörk44, Frederic Amant45, Stefanie Schrauwen18,
Alexander Hein20, Matthias W Beckmann20, Arif Ekici46, Kamila Czene27, Alfons Meindl47,
Manjeet K Bolla2, Kyriaki Michailidou2, Jonathan P Tyrer12, Qin Wang2, Shahana Ahmed12,
Catherine S Healey12, Mitul Shah12, Daniela Annibali48, Jeroen Depreeuw48, Nada A.
Al-Tassan50, Rebecca Harris51, Brian F. Meyer50, Nicola Whiffin52, Fay J Hosking52,
Ben Kinnersley52, Susan M. Farrington53, Maria Timofeeva53, Albert Tenesa54,
Harry Campbell55, Robert W. Haile56, Shirley Hodgson57, Luis Carvajal-Carmona58,
Jeremy P. Cheadle51, Douglas Easton2,12, Malcolm Dunlop53, Richard Houlston52,
Amanda Spurdle3, Ian Tomlinson1,59 received: 20 March 2015
accepted: 28 October 2015 Published: 01 December 2015
OPEN
1Molecular and Population Genetics Laboratory, Wellcome Trust Centre for Human Genetics, University of Oxford,
Council Victoria, Melbourne, Australia. 11Department of Epidemiology and Preventive Medicine, Monash University, Melbourne, Australia. 12Centre for Cancer Genetic Epidemiology, Department of Oncology, University of Cambridge, Cambridge, UK. 13London School of Hygiene and Tropical Medicine, London, UK. 14Sheffield Cancer Research Centre, Department of Oncology, University of Sheffield, Sheffield, UK. 15Division of Genetics and Epidemiology, Institute of Cancer Research, Sutton, UK and 17 Division of Breast Cancer Research, Institute of Cancer Research, London, UK. 16Department of Laboratory Medicine and Pathology, Mayo Clinic, Rochester, MN, USA. 17Department of Health Sciences Research, Mayo Clinic, Rochester, MN, USA. 18Department of Oncology, KU Leuven, Belgium. 19University of California at Los Angeles, Department of Medicine, Division of Hematology/Oncology, David
Geffen School of Medicine, Los Angeles, CA, USA. 20Department of Gynecology and Obstetrics, University Hospital Erlangen, Friedrich-Alexander University Erlangen-Nuremberg, Erlangen, Germany. 21Division of Cancer Epidemiology, German Cancer Research Center, Heidelberg, Germany. 22Dr. Margarete Fischer-Bosch-Institute of Clinical Pharmacology Stuttgart, University of Tuebingen, Germany. 23Division of Cancer Epidemiology, German Cancer Research Center, Heidelberg, Germany. 24Department of Clinical Science, Center for Cancer Biomarkers, University of Bergen, Norway. 25Department of Genetics, Institute for Cancer Research, The Norwegian Radium Hospital, Oslo, Norway; The K.G. Jebsen Center for Breast Cancer Research, Institute for Clinical Medicine, Faculty of Medicine, University of Oslo, Oslo, Norway; Department of Clinical Molecular Oncology, Division of Medicine, Akershus University Hospital, Ahus, Norway. 26Department of Molecular Medicine and Surgery, Karolinska Institutet, Stockholm, Sweden. 27Department of Medical Epidemiology and Biostatistics, Karolinska Institutet, Stockholm, Sweden. 28Grupo de investigación Citogenética, Filogenia y Evolución de Poblaciones, Universidad del Tolima, Ibagué, Tolima, Colombia. 29Departamento de Antropologia Biologica, Facultad de Humanidades, UDELAR, Magallanes 1577, CP 11200, Montevideo, Uruguay. 30Universidade de Santiago de Compostel, R/ San Francisco s/n 15782, Santiago de Compostela, Spain. 31Genetic Predisposition to Colorectal Cancer Group, Gastrointestinal & Pancreatic Oncology Team, IDIBAPS/CIBERehd/Hospital Clínic, Centre Esther Koplowitz (CEK), Rosselló 153 planta 4, 08036 Barcelona, Spain. 32Universidad Autónoma De Nuevo León, Pedro de Alba s/n, San Nicolás de Los Garza, Nuevo León, Mexico. 33Hospital A.C. Camargo, São Paulo, Brazil. 34Department of Genetics and IPO-Porto Research Center (CI-IPOP), Portuguese Oncology Institute of Porto (IPO-Porto), Porto, Portugal, and Biomedical Sciences Institute (ICBAS), University of Porto, Porto, Portugal. 35School of Medicine and Public Health, University of Newcastle, NSW, Australia. 36Hunter Medical Research Institute, John Hunter Hospital, Newcastle, NSW, Australia. 37Centre for Clinical Epidemiology and Biostatistics, School of Medicine and Public Health, University of Newcastle, NSW, Australia. 38Department of Obstetrics and Gynecology, Division of Gynecologic Oncology, Mayo Clinic, Rochester, MN, USA. 39Department of Biostatistics, University of Kansas Medical Center, Kansas City, KS, USA. 40Centre for
Cancer Biomarkers, Department of Clinical Science, The University of Bergen, Norway. 41Department of Women’s
and Children’s Health, Karolinska Institutet, Karolinska University Hospital, Stockholm, Sweden. 42Department of Gynaecology, Jena University Hospital - Friedrich Schiller University, Jena, Germany. 43Hannover Medical School, Clinics of Gynaecology and Obstetrics, Hannover, Germany. 44Hannover Medical School, Gynaecology Research Unit, Hannover, Germany. 45Division of Gynaecological Oncology, University Hospital Leuven, Leuven, Belgium. 46Institute of Human Genetics, University Hospital Erlangen, Friedrich-Alexander University Erlangen-Nuremberg, Erlangen, Germany. 47Department of Obstetrics and Gynecology, Division of Tumor Genetics, Technical University of Munich, Munich, Germany. 48Department of Obstetrics and Gynecology, Division of Gynecologic Oncology, University Hospitals, KU Leuven, University of Leuven, 3000, Belgium. 49Vesalius Research Center, Leuven, 3000, Belgium. 50Department of Genetics, King Faisal Specialist Hospital and Research Center, P.O.Box 3354, Riyadh11211, Saudi Arabia. 51Institute of Cancer and Genetics, School of Medicine, Cardiff University, Heath Park, Cardiff, CF14 4XN, UK. 52Division of Genetics and Epidemiology, The Institute of Cancer Research, Sutton, Surrey SM2 5NG, UK. 53Colon Cancer Genetics Group, Institute of Genetics and Molecular Medicine, University of Edinburgh and MRC Human Genetics Unit, Western General Hospital Edinburgh, Crewe Road, Edinburgh, EH4 2XU, UK. 54The Roslin Institute, University of Edinburgh, Easter Bush, Roslin, EH25 9RG, UK. 55Centre for Population Health Sciences, University of Edinburgh, Edinburgh, EH8 9AG, UK. 56Stanford Cancer Institute, Lorry Lokey Building/SIM 1, 265 Campus Drive, Ste G2103, Stanford, CA 94305-5456, USA. 57Department of Cancer Genetics, St. George’s University of London, London SW17 0RE,
UK. 58Genome Center and Department of Biochemistry and Molecular Medicine, School of Medicine, University of
California, Davis, USA. 59Oxford NIHR Comprehensive Biomedical Research Centre, Wellcome Trust Centre for Human Genetics, Roosevelt Drive, Oxford OX3 7BN, UK. Correspondence and requests for materials should be addressed to I.T. (email: [email protected])
High-risk mutations in several genes predispose to both colorectal cancer (CRC) and endometrial cancer (EC). We therefore hypothesised that some lower-risk genetic variants might also predispose to both CRC and EC. Using CRC and EC genome-wide association series, totalling 13,265 cancer cases and 40,245 controls, we found that the protective allele [G] at one previously-identified CRC polymorphism, rs2736100 near TERT, was associated with EC risk (odds ratio (OR) = 1.08,
polymorphism near TERC also showed evidence of association with EC (OR = 0.92; P = 0.03). Overall, however, there was no good evidence that the set of CRC polymorphisms was associated with EC risk, and neither of two previously-reported EC polymorphisms was associated with CRC risk. A combined analysis revealed one genome-wide significant polymorphism, rs3184504, on chromosome 12q24 (OR = 1.10, P = 7.23 × 10⁻⁹) with shared effects on CRC and EC risk. This polymorphism, a missense variant in the gene SH2B3, is also associated with haematological and autoimmune disorders, suggesting that it influences cancer risk through the immune response. Another polymorphism, rs12970291 near gene TSHZ1, was associated with both CRC and EC (OR = 1.26,
P = 4.82 × 10⁻⁸), with the alleles showing opposite effects on the risks of the two cancers.
Colorectal carcinoma (CRC) is the fourth commonest cancer in the western world and cancer of the uterine corpus, or endometrial carcinoma (EC), is the fourth commonest cancer among women. Both cause significant morbidity and mortality worldwide. There is evidence from rare, Mendelian cancer predisposition syndromes that CRC and EC can have a common aetiology. Specifically, germline muta-tions in mismatch repair (MMR) genes MLH1, MSH2, MSH6 and PMS21, and in DNA polymerases POLD1 and POLE2 predispose to a high incidence (lifetime risk 30–71%2–5) of both CRC and EC. The
MMR system maintains genomic stability by correcting mismatched nucleotide pairs that arise during DNA replication and MMR mutations cause a microsatellite instability (MSI+ ) phenotype in CRCs and ECs6. Bi-allelic MLH1 promoter methylation7,8 and a few somatic mutations in MLH1 and MSH29 are
seen in sporadic CRCs and ECs, causing the same MSI+ and hypermutator phenotype. Histologically, MMR-deficient CRCs and ECs are characterised by poor differentiation and the presence of mucinous and signet-cell features and tumour-infiltrating lymphocytes10,11. POLE and POLD1 encode polymerases
that synthesise respectively the leading and lagging strand of the DNA replication fork. The exonuclease (proofreading) domains of these polymerases increase replication fidelity by recognising and excising mispaired bases12,13. Germline missense mutations in the exonuclease domains of POLD1 and POLE
predispose to both CRC and EC, and somatic POLE mutations occur in sporadic CRCs and ECs2,14–16.
Polymerase exonuclease domain mutations (EDMs) do not cause MSI, but lead to an ultramutator phe-notype, with over one million base substitutions in some cancers.
Genome-wide association studies (GWAS) have successfully identified tens of common single nucle-otide polymorphisms (SNPs) associated with a modestly increased risk (typically 10–25%) of CRC. In addition, one EC SNP, near HNF1B, has been reported at stringent levels of statistical significance. To date, the lists of CRC and EC SNPs are non-overlapping. Since CRC and EC may share mechanisms of pathogenesis, as evidenced by the high-penetrance germline mutations and the somatic (epi)mutations discussed above, we hypothesised (i) that some CRC SNPs may predispose to EC, and vice versa, and (ii) that there exist unidentified SNPs that predispose to both CRC and EC. In this study, we tested these hypotheses using 16 different CRC and EC GWAS data sets, totalling 13,265 cancer cases and 40,245 cancer-free or population controls.
Methods
GWAS data sets. Five CRC GWAS data sets genotyped on various Illumina tag-SNP arrays were available, comprising: (i) CORGI (UK1), (ii) Scotland 1, (iii) VICTOR/QUASAR2/BC58, (iv) CFR1 and (v) CFR2/CGEMS (total 5,725 cases and 6,671 controls)17–21. The VQ58, CORGI and Scotland 1 series
were genotyped using Illumina Hap300, Hap240S, Hap370, Hap550 or Omni2.5M arrays. BC58 gen-otyping was performed as part of the WTCCC2 study on Hap1.2M-Duo Custom arrays. The CCFR samples were genotyped using Illumina Hap1M, Hap1M-Duo or Omni-express arrays. CGEMS samples (all controls) were genotyped using Illumina Hap300 and Hap240 or Hap550 arrays. Standard quality -control measures were applied as reported17. Moreover, any duplicate or cryptically related samples were
excluded by pairwise identity by descent (IBD) analysis.
EC GWAS comprised: (i) NSECG, (ii) ANECS and (iii) SEARCH (total 2,212 cases and 6,725 con-trols)22. All samples were of European ancestry with the majority of samples from the UK, and others
from USA and Australia. Standard quality control measures were performed for each GWAS, as described in the referenced publications, and details about each dataset are shown in Table 1. Some of the control datasets, including the Wellcome Trust Case Control Consortium 2 (WTCCC2)23, have previously been
used in both CRC and EC GWAS. We ensured that such controls were assigned proportionately to case data sets and were not used more than once (Table 1).
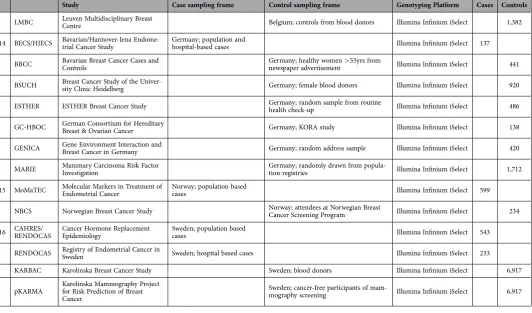
Study Case sampling frame Control sampling frame Genotyping Platform Cases Controls
CRC GWAS
1 UK1-CORGI Colorectal Tumour Gene Identifica-tion Consortium England; Genetics clinic-based, with family history of CRC England; spouses and partners of cases with no personal or family history of
colorectal neoplasia Illumina Hap550 888 899
2 Scotland1 Scotland Scotland; population based CRC cases, age < 55 Scotland; from NHS registers matched by age and region Illumina HumanHap300 and Illumina
Human-Hap240S 973 998
3 VQ VICTOR/QUASAR2
UK; CRC cases enrolled in chemotherapy clinical trials (NSAID and monoclonal antibody)
Illumina HumanHap300, Illumina HumanHap270, Illumina Human 1.2MDuo
1894 2674
WTCCC2
BC58 UK 1958 Birth Cohort UK; population based controls, born within one week in 1958 Illumina 1.2M
4 CFR1 Colon Cancer Family Registry Phase1 USA and Australia; cases from cancer registries USA and Australia; population based controls, no family history Illumina Human1M 1175 999
5 CFR2 Colon Cancer Family Registry Phase 2 USA and Australia; cases from cancer registries Illumina Human1M 795
CGEMS
prostate Cancer Genetic Markers of Suscep-tibility (Prostate) USA; population based cancer free con-trols from prostate study Illumina HumanHap550 1101 EC GWAS
6 NSECG National Study of Endometrial Cancer Genetics UK; population based cases Illumina660WQuads, HumanHap550 925
CGEMS
breast Cancer Genetic Markers of Suscep-tibility (Breast) USA; population based cancer free con-trols from breast study Illumina HumanHap550 1141
7 ANECS Australian National Endometrial Cancer Study Australia; population based cases Illumina 610K 606
QIMR Queensland Institute of Medical Research Australia; parents of participants in adolescent twin study Illumina 610K 1846
HCS Hunter Community Study Australia; population-based cohort Illumina 610K 1237
8 SEARCH UK Studies of Epidemiology and Risk factors in Cancer Heredity England; population based cases via cancer registries,
age < 69 Illumina 610K 681
WTCCC2
NBS UK; population based controls identified through National Blood Service Illumina 1.2M 2501 EC COGS
9 ANECS Australian National Endometrial Cancer Study Australia; population based cases Illumina Infinium iSelect 373
NECS Newcastle Endometrial Cancer Study Australia; hospital-based cases Illumina Infinium iSelect 165
ABCFS Australian Breast Cancer Family Study Australia; from electoral rolls Illumina Infinium iSelect 443
AOCS Australian Ovarian Cancer Study Australia; population-based, from elec-toral rolls Illumina Infinium iSelect 817
MCCS Melbourne Collaborative Cohort Study Australia; random sample from initial cohort Illumina Infinium iSelect 437
10 SEARCH UK Studies of Epidemiology and Risk factors in Cancer Heredity England; population based cases England; population based controls Illumina Infinium iSelect 773 7,510
11 NSECG National Study of Endometrial Cancer Genetics England; population based cases Illumina Infinium iSelect 965
BBCS British Breast Cancer Study UK; friend, sister-in-law, daughter-in-law or other
non-blood relative of breast cancer case Illumina Infinium iSelect 1,353
SBCS Sheffield Breast Cancer Study UK; women attending Sheffield Mam-mography Screening, with no breast
lesion Illumina Infinium iSelect 835
UKBGS UK Breakthrough Generations Study UK; women without breast lesions select-ed from BGS cohort Illumina Infinium iSelect 449
12 MECS Mayo Endometrial Cancer Study USA; Hospital based cases Illumina Infinium iSelect 221
MCBCS Mayo Clinic Breast Cancer Study USA; Cancer-free women presenting for general medical examination Illumina Infinium iSelect 1,762
MCBCS/
MCOCCCS Mayo Clinic Ovarian Cancer Case-Control Study USA; Cancer-free women presenting for general medical examination Illumina Infinium iSelect 593 13 LES Leuven Endometrial Cancer Study Belgium; hospital based cases Illumina Infinium iSelect 321
EC targeted genotyping data sets. A further 4,330 EC cases and 26,849 female controls were gen-otyped as part of the Endometrial Cancer Association Consortium (ECAC), with samples from seven countries: UK, USA, Belgium, Germany, Norway, Sweden and Australia. The controls were selected from healthy females participating in the Breast Cancer Association Consortium (BCAC) and Ovarian Cancer Association Consortium (OCAC) part of the iCOGS project and matched and analysed with cases in eight groups by geographical location (see Table 1). These samples were genotyped using a custom Illumina Infinium iSelect array with 211,155 SNPs designed by the COGS (Collaborative Oncological Gene-environment Study) initiative24–27. The SNPs on this array were chosen based on regions of interest
from previous breast, prostate, ovarian and endometrial cancer studies, rather than on genome-wide coverage. We did not impute genotypes from the COGS studies, but included directly-genotyped SNPs in the discovery meta-analysis. These SNPs were not used for locus fine mapping.
Association study and meta-analysis. Whole-genome imputation using two reference panels (1000 Genomes 2012 release28 and 196 high-coverage whole genome-sequenced UK individuals) was performed
with IMPUTE229, yielding up to 6 million SNPs either typed or imputed with high quality (info score > 0.9). Case-control analysis for each GWAS data set was performed using frequentist tests with a logistic regression model using SNPTEST (v2.4)30. There was no evidence of systematic over-dispersion of the
test statistic for any of the 16 studies (lambdaGC= 1.01–1.04 based on weakly correlated SNPs, r2< 0.2).
Fixed-effects, inverse variance weighted meta-analysis was conducted for the 6 million well-imputed SNPs in the eight CRC and EC GWAS (8,935 cases, 13,396 controls) across the genome using GWAMA (v2.1)31. For the ~200,00 SNPs genotyped on the COGS array, the additional 4,330 EC cases and 26,849
controls from ECAC were included in a meta-analysis of 16 studies yielding a total of 13,265 cases and 40,245 controls for these loci. SNPs with globally significant CRC/EC associations (Pmeta< 5 × 10⁻⁸) were
identified and the regions examined using standard fine mapping and annotation methods.
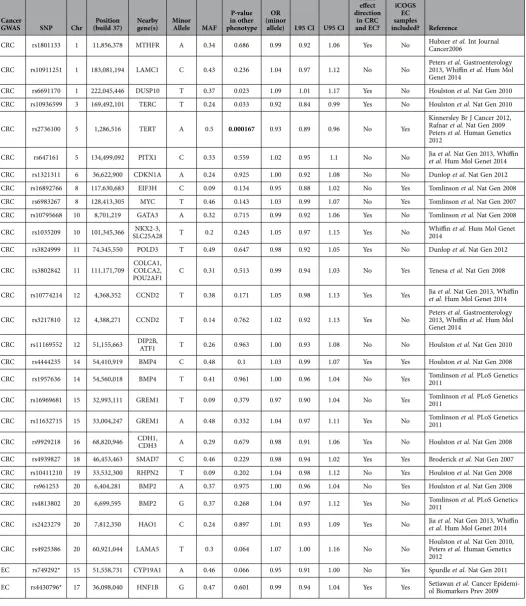
Previously reported CRC and EC SNPs. The effects of 25 previously published tag-SNPs that have been formally associated with CRC risk in GWAS were investigated in EC (Table 2). We additionally assessed two SNPs (near TERT32 and MTHFR33,34) with convincing CRC associations from focussed
stud-ies. We estimated that our EC sample set provided 72% power to detect the effect of a typical CRC SNP (allele frequency = 0.25, per allele odds ratio = 1.1) at P = 0.05, and 23% power to detect a similar allele at P = 0.001, corresponding to a false discovery rate of q = 0.05 in our sample. Two EC SNPs from GWAS22
Study Case sampling frame Control sampling frame Genotyping Platform Cases Controls
LMBC Leuven Multidisciplinary Breast Centre Belgium; controls from blood donors Illumina Infinium iSelect 1,382
14 BECS/HJECS Bavarian/Hannover-Jena Endome-trial Cancer Study Germany; population and hospital-based cases Illumina Infinium iSelect 137
BBCC Bavarian Breast Cancer Cases and Controls Germany; healthy women newspaper advertisement> 55yrs from Illumina Infinium iSelect 441
BSUCH Breast Cancer Study of the Univer-sity Clinic Heidelberg Germany; female blood donors Illumina Infinium iSelect 920
ESTHER ESTHER Breast Cancer Study Germany; random sample from routine health check-up Illumina Infinium iSelect 486
GC-HBOC German Consortium for Hereditary Breast & Ovarian Cancer Germany; KORA study Illumina Infinium iSelect 138
GENICA Gene Environment Interaction and Breast Cancer in Germany Germany; random address sample Illumina Infinium iSelect 420
MARIE Mammary Carcinoma Risk Factor Investigation Germany; randomly drawn from popula-tion registries Illumina Infinium iSelect 1,712
15 MoMaTEC Molecular Markers in Treatment of Endometrial Cancer Norway; population based cases Illumina Infinium iSelect 599
NBCS Norwegian Breast Cancer Study Norway; attendees at Norwegian Breast Cancer Screening Program Illumina Infinium iSelect 234
16 CAHRES/RENDOCAS Cancer Hormone Replacement Epidemiology Sweden; population based cases Illumina Infinium iSelect 543
RENDOCAS Registry of Endometrial Cancer in Sweden Sweden; hospital based cases Illumina Infinium iSelect 233
KARBAC Karolinska Breast Cancer Study Sweden; blood donors Illumina Infinium iSelect 6,917
pKARMA Karolinska Mammography Project for Risk Prediction of Breast Cancer
Sweden; cancer-free participants of
[image:5.595.22.555.48.361.2]mam-mography screening Illumina Infinium iSelect 6,917
Cancer
GWAS SNP Chr (build 37)Position Nearby gene(s) Minor Allele MAF
P-value in other phenotype
OR (minor
allele) L95 CI U95 CI
Same effect direction
in CRC and EC?
iCOGS EC samples
included? Reference
CRC rs1801133 1 11,856,378 MTHFR A 0.34 0.686 0.99 0.92 1.06 Yes No Hubner Cancer2006et al. Int Journal
CRC rs10911251 1 183,081,194 LAMC1 C 0.43 0.236 1.04 0.97 1.12 No No Peters 2013, Whiffin et al. Gastroenterology et al. Hum Mol Genet 2014
CRC rs6691170 1 222,045,446 DUSP10 T 0.37 0.023 1.09 1.01 1.17 Yes No Houlston et al. Nat Gen 2010 CRC rs10936599 3 169,492,101 TERC T 0.24 0.033 0.92 0.84 0.99 Yes No Houlston et al. Nat Gen 2010
CRC rs2736100 5 1,286,516 TERT A 0.5 0.000167 0.93 0.89 0.96 No Yes
Kinnersley Br J Cancer 2012, Rafnar et al. Nat Gen 2009 Peters et al. Human Genetics 2012
CRC rs647161 5 134,499,092 PITX1 C 0.33 0.559 1.02 0.95 1.1 No No Jia et al.et al. Hum Mol Genet 2014 Nat Gen 2013, Whiffin
CRC rs1321311 6 36,622,900 CDKN1A A 0.24 0.925 1.00 0.92 1.08 No No Dunlop et al. Nat Gen 2012 CRC rs16892766 8 117,630,683 EIF3H C 0.09 0.134 0.95 0.88 1.02 No Yes Tomlinson et al. Nat Gen 2008 CRC rs6983267 8 128,413,305 MYC T 0.46 0.143 1.03 0.99 1.07 No Yes Tomlinson et al. Nat Gen 2007 CRC rs10795668 10 8,701,219 GATA3 A 0.32 0.715 0.99 0.92 1.06 Yes No Tomlinson et al. Nat Gen 2008
CRC rs1035209 10 101,345,366 SLC25A28NKX2-3, T 0.2 0.243 1.05 0.97 1.15 Yes No Whiffin 2014 et al. Hum Mol Genet
CRC rs3824999 11 74,345,550 POLD3 T 0.49 0.647 0.98 0.92 1.05 Yes No Dunlop et al. Nat Gen 2012
CRC rs3802842 11 111,171,709 COLCA1, COLCA2,
POU2AF1 C 0.31 0.513 0.99 0.94 1.03 No Yes Tenesa et al. Nat Gen 2008
CRC rs10774214 12 4,368,352 CCND2 T 0.38 0.171 1.05 0.98 1.13 Yes Yes Jia et al.et al. Hum Mol Genet 2014 Nat Gen 2013, Whiffin
CRC rs3217810 12 4,388,271 CCND2 T 0.14 0.762 1.02 0.92 1.13 Yes No Peters 2013, Whiffin et al. Gastroenterology et al. Hum Mol Genet 2014
CRC rs11169552 12 51,155,663 DIP2B, ATF1 T 0.26 0.963 1.00 0.93 1.08 No No Houlston et al. Nat Gen 2010
CRC rs4444235 14 54,410,919 BMP4 C 0.48 0.1 1.03 0.99 1.07 Yes Yes Houlston et al. Nat Gen 2008
CRC rs1957636 14 54,560,018 BMP4 T 0.41 0.961 1.00 0.96 1.04 No Yes Tomlinson 2011 et al. PLoS Genetics
CRC rs16969681 15 32,993,111 GREM1 T 0.09 0.379 0.97 0.90 1.04 No Yes Tomlinson 2011 et al. PLoS Genetics
CRC rs11632715 15 33,004,247 GREM1 A 0.48 0.332 1.04 0.97 1.11 Yes No Tomlinson 2011 et al. PLoS Genetics
CRC rs9929218 16 68,820,946 CDH1, CDH3 A 0.29 0.679 0.98 0.91 1.06 Yes No Houlston et al. Nat Gen 2008
CRC rs4939827 18 46,453,463 SMAD7 C 0.46 0.229 0.98 0.94 1.02 Yes Yes Broderick et al. Nat Gen 2007 CRC rs10411210 19 33,532,300 RHPN2 T 0.09 0.202 1.04 0.98 1.12 No Yes Houlston et al. Nat Gen 2008 CRC rs961253 20 6,404,281 BMP2 A 0.37 0.975 1.00 0.96 1.04 No Yes Houlston et al. Nat Gen 2008
CRC rs4813802 20 6,699,595 BMP2 G 0.37 0.268 1.04 0.97 1.12 Yes No Tomlinson 2011 et al. PLoS Genetics
CRC rs2423279 20 7,812,350 HAO1 C 0.24 0.897 1.01 0.93 1.09 Yes No Jia et al.et al. Hum Mol Genet 2014 Nat Gen 2013, Whiffin
CRC rs4925386 20 60,921,044 LAMA5 T 0.3 0.064 1.07 1.00 1.16 No No Houlston Peters et al.et al. Human Genetics Nat Gen 2010, 2012
EC rs749292* 15 51,558,731 CYP19A1 A 0.46 0.066 0.95 0.91 1.00 No Yes Spurdle et al. Nat Gen 2011
EC rs4430796* 17 36,098,040 HNF1B G 0.47 0.601 0.99 0.94 1.04 Yes Yes Setiawan ol Biomarkers Prev 2009et al. Cancer
Epidemi-Table 2. Association statistics for the known CRC SNPs tested in EC, and vice versa.
Chr = chromosome, OR = odds ratio, MAF = minor allele frequency, OR = odds ratio, L95 CI = lower 95%
confidence interval odds ratio, U95 CI = upper 95% confidence interval odds ratio. The original studies
[image:6.595.28.555.56.663.2]were similarly investigated in CRC. All of these SNPs were either discovered or replicated in European populations and were genotyped directly or had near-perfect proxies on the Illumina GWAS arrays used; 13 of the SNPs were also present on the iCOGS arrays. Three EC SNPs in the TERT-CLPTM1L region35
were not included in this analysis, owing to poor tagging on the GWAS arrays and hence sub-optimal imputation.
Genome-wide enrichment of susceptibility SNPs between CRC and EC. Beyond the 29 pre-viously published associations, we investigated the presence of genome-wide enrichment for CRC and EC. After removing previous associations, we pruned the set of 6 million typed or well-imputed SNPs (r2< 0.1) to 246,896. Using several P value thresholds, we determined whether there was a tendency for
the same SNPs to co-occur in the lists of putative CRC and EC SNPs, irrespective of direction of effect.
Results
We initially investigated the 29 previously-identified CRC and EC polymorphisms (Table 2). One SNP, rs2736100, originally reported in CRC32, was significantly associated with EC risk (OR: 0.93, 95%
con-fidence interval (95% CI): 0.89-0.96, P = 0.000167) after correcting for multiple testing (P< 0.001). The risk allele for CRC [A] was protective in EC. rs2736100 lies in the intronic region of the telomerase reverse transcriptase TERT. It or highly correlated SNPs have previously been associated with the risk of multiple different cancer types, and we ourselves have previously found evidence that these TERT SNPs are associated with EC risk35. Two other CRC SNPs (rs6691170 and rs10936599) were nominally
associ-ated with EC risk (P < 0.05). Interestingly, the latter of these lies close to the telomerase RNA component
TERC locus; it is a multi-cancer risk SNP36–38 and has been associated with longer telomeres. Overall,
15 of the 29 SNPs showed the same direction of effect in both cancer types (that is, same nominal risk allele, irrespective of effect size), and this evidently was not a significant deviation from randomness (P = 1, binomial sign test).
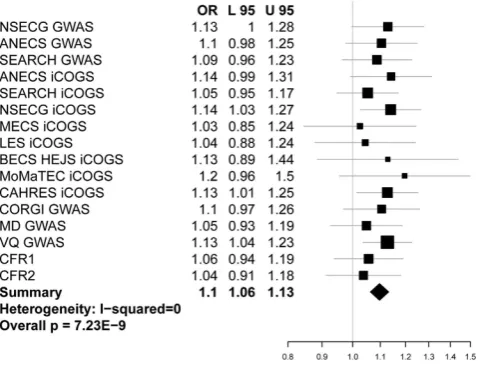
Meta-analysis of all CRC and EC data sets revealed a single genome-wide significant SNP, rs3184504, on chromosome 12q24 (OR: 1.10, 95% CI 1.07–1.13, Pmeta: 7.23 × 10⁻⁹, heterogeneity I2= 0; Fig. 1,
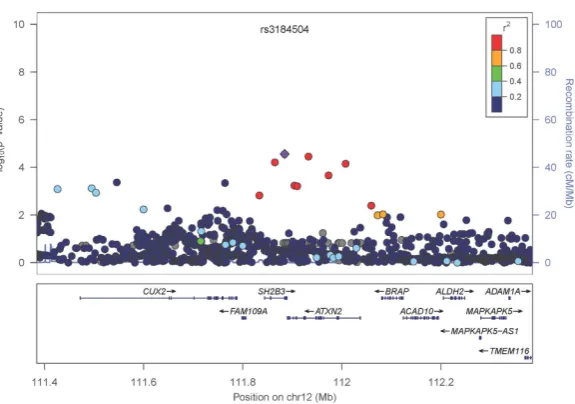
Supplementary Table 1). This SNP is a missense variant (p.Trp262Arg) in exon 4 of SH2B3. It has not previously been associated with either CRC or EC. The major [C] allele was consistently the risk allele in all datasets, including those analysed using the iCOGS array, on which the SNP was included due to promising, but unproven, associations below genome-wide significance in previous breast cancer and EC GWAS. An additional 3 SNPs (Fig. 2) in strong pairwise linkage disequilibrium (LD) with rs3184504 (r2> 0.9) showed strong evidence of CRC-EC association (P
fine mapping< 10−5). These 4 SNPs lie in a
68kb region, that includes the genes SH2B3 and ATXN2, and their functional annotation is shown in Supplementary Table 2. None of the 4 SNPs was associated with the mRNA level of SH2B3, ATXN2 or other nearby genes in public eQTL databases (details not shown).
There are SNPs that have previously been independently identified in GWAS of different phenotypes where the risk allele for one phenotype is the protective allele for another39,40. In order to search for SNPs
[image:7.595.156.397.47.230.2]for which the same allele has differing directions of effect in CRC and EC, we conducted a fixed-effect
Figure 1. Forest plot showing association between cancer risk and rs3184504 genotype in each data set.
meta-analysis with the odds ratios of all the CRC SNPs GWAS inverted (Supplementary Table 3). In this analysis, we discovered rs12970291 on chromosome 18q22, where the major G allele is protective in CRC (OR:0.78, 95%CI:0.69-0.90, 3.42 × 10⁻⁴) and confers risk in EC (OR:1.24, 95%CI: 1.11–1.38,
p:1.11 × 10⁻⁴). In meta-analysis, the rs12970291 association reached genome-wide significance (OR:1.26,
95%CI:1.16–1.38, Pmeta:4.82 × 10⁻⁸; Fig. 3). Fine mapping analysis identified a large number of SNPs in
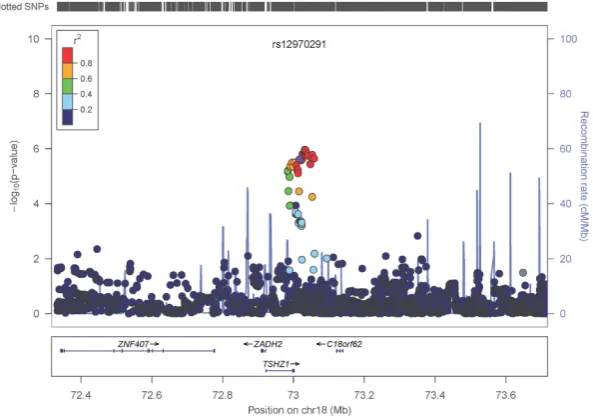
high pairwise LD with rs12970291 (r2> 0.85), in a 70 kb region that includes the gene TSHZ1, which
is ~15 kb proximal to rs12970291 (Fig. 4). Seventeen SNPs had a stronger disease association than rs12970291 in fine mapping, with the lowest P value at rs35185115 (Pfine mapping= 1.08 × 10⁻⁶). Fine
map-ping of CRC and EC GWAS separately (Supplementary Figure 1) showed an association peak occurring in the same LD block between 10.5–51.8 kb downstream of TSHZ1, while an additional suggestive asso-ciation signal near rs17263435 (PEC= 4.35 × 10⁻⁵) was not present in CRC (PCRC= 0.1). Several SNPs in
[image:8.595.167.455.53.255.2]the region have potential functional importance (Supplementary Table 4), and of particular note is the missense SNP rs3390274 (p.Ala468Thr) in the last exon of TSHZ1. SNPs with a pairwise LD of > 0.4 with rs12970291 in the region were not significantly associated with mRNA level of TSHZ1 or other nearby genes in public eQTL databases (details not shown).
Figure 2. Regional association plot for region around rs3184504. Plots are produced in LocusZoom
and show the most strongly associated SNP, rs3184504 (purple diamond). rs7137828, intron of ATXN2, is
the SNP with the second lowest P value. The primary aim of this analysis is to compare association signals among SNPs in the region. Therefore, the data are derived from a meta-analysis of genotyped or high-quality imputed SNPs in the GWAS data sets, and because imputation quality was more variable in iCOGS than in the GWAS data, the iCOGS samples are not included.
Figure 3. Forest plot showing association between cancer risk and rs12970291 genotype in each data set.
[image:8.595.157.396.363.521.2]Finally, we performed genome-wide enrichment analysis for nearly 250,000 independent SNPs (r2< 0.1) below genome-wide significance levels to investigate whether there was a set of cryptic shared
CRC and EC risk loci (Supplementary Table 5). Using P value thresholds of 10−3, 10−2 and 0.05, we found
no evidence of a significant sharing of CRC and EC SNPs using this method.
Discussion
Using a combined CRC and EC GWAS meta-analysis, we have identified a region on chromosome 12q24.1 spanning two genes, SH2B3 and ATXN2, which contains a SNP that is formally associated at GWAS thresholds of significance with cancer risk. Of the variants in this region, rs3184504 is of particular interest, because it is a non-synonymous change (TGG → CGG; p.Trp262Arg) in the pleckstrin homology domain of SH2B3, which is a priori a much stronger candidate than the spinocerebellar ataxia gene ATXN2. SH2B3 is a member of the SH2B adaptor family of proteins and is involved in a range of signalling activities by growth factor and cytokine receptors. It is a key negative regulator in cytokine signalling in haemato-poiesis, and is expressed at a high level in the bone marrow and white blood cells, but at a low level in the normal bowel and endometrium (EMBL-EBI expression atlas). Comparative genomics shows that the rs3184504 risk allele (C, Arg residue) is conserved in all primates and some vertebrates (Supplementary Figure 1), and has a much lower allele frequency (~0.5) in Europeans than in African, Asian and admixed American populations (~1.0). Amino acids Trp (tryptophan) and Arg (arginine) present in the two forms of the polymorphic SH2B3 protein possess a hydrophobic (uncharged) and positively charged side chain respectively. Different programs that predict the effect of this variation on protein function vary in their assessment (Grantham score = 121 (range 0–215)41, Polyphen2 = 0.1242, SIFT = 1.043, CADD score
PHRED-scaled = 5.53244); overall, the possibility remains that the amino acid change has a modest or
greater effect on protein function. The NHGRI GWAS Catalog shows that SNPs in the SH2B3/ATNX2
region including rs3184504 and rs653178 have been previously associated with immune-mediated con-ditions: coeliac disease45, rheumatoid arthritis43, type 1 diabetes46, autoimmune hepatitis47 and also
car-diovascular traits including coronary artery disease48 and blood pressure49. The genotype at rs653178 has
been linked to levels of SH2B3 mRNA expression in peripheral blood cell eQTL analysis (p = 9.24 × 10⁻¹²),
although this association is not present in public eQTL data sets. Interestingly, rs3184504 T is generally the risk allele in autoimmune traits, suggesting opposing effects of the functional polymorphism on cancer and other traits, perhaps via shared effects on immune activation. A similar phenomenon has been found for the HNF1B SNP rs4430796 which has opposing effects on EC and type 2 diabetes risk50.
The TERT-CLPTM1L locus has been identified in multiple cancer susceptibility GWAS51–58 and it is
of interest that the CRC SNP rs2736100 also shows signs of significance in EC in our analysis (OR:1.08, 95%CI:1.04-1.12, P = 1.67 × 10⁻⁴). In parallel with this study and using overlapping data sets, we have
[image:9.595.160.457.46.254.2]recently performed a detailed analysis of the TERT-CLPTM1L locus in EC which provided evidence that rs7705526 is associated with EC risk (Passoc= 7.7 × 10⁻⁵), albeit at locus-specific rather than genome-wide Figure 4. Regional association plot for region around rs12970291. Legend is as for Fig. 2, except as follows. The most strongly associated SNP from the full discovery meta-analysis (rs12970291, purple diamond) is not the most strongly associated in the GWAS data sets. The most strongly associated SNP,
rs35185115, lies about 30kb downstream of TSHZ1, but this SNP imputed poorly in iCOGS and was
significance thresholds35. rs7705526 is moderately correlated with rs2736100 (r2 ~ 0.5) but is poorly tagged
in most Illumina GWAS arrays. Supplementary Figure 2 shows the complex LD structure between these two SNPs and 4 other SNPs previously associated with CRC and EC at varying levels of significance (P = 8.4 × 10⁻³ to 4.9 × 10⁻⁶) at this locus.
The rs2736100 A allele is the risk allele for CRC and testicular germ cell tumour, while the same allele is protective for EC, glioma and lung cancer, suggesting that this variant has its effects in a tissue-specific manner. Interestingly, we have found evidence in this study for a SNP (rs12970291, chromosome 18q22) that has opposing allelic effects on CRC and EC risk. The top candidate gene in this region is TSHZ1
which encodes zinc finger homeodomain factor teashirt zinc finger family member 1, a protein involved in skin, skeletal, brain and gut development59 that is functionally related to the CRC gene BMP460. One
of several candidate SNPs near and within TSHZ1 is the uncommon missense variant rs33930274 (p.Al-a468Thr) in the last exon of TSHZ1, although the predicted functional consequences of this change are inconsistent (Grantham score = 58, SIFT = 0.0, Polyphen2 = 0.0, CADD score PHRED-scaled: 0.001).
Apart from the SH2B3 and TERT SNPs, only two of 27 previously-reported CRC SNPs, including one near TERC, showed any good evidence of association with EC and neither of the known EC SNPs was associated with CRC risk. Otherwise, there was no convincing evidence for a shared EC and CRC predis-position based on common polymorphisms, although it will be important to keep repeating multi-cancer GWAS as more risk SNPs are identified, and sub-set analyses – for example of MSI+ ECs and CRCs – might also be fruitful. It remains a little puzzling that, like breast and ovarian cancer, CRC and EC share high-penetrance risk alleles, yet relatively few common risk alleles of modest effect.
References
1. Lynch, H. T. et al. Review of the Lynch syndrome: history, molecular genetics, screening, differential diagnosis, and medicolegal ramifications. Clin Genet76, 1–18, doi: 10.1111/j.1399-0004.2009.01230.x (2009).
2. Palles, C. et al. Germline mutations affecting the proofreading domains of POLE and POLD1 predispose to colorectal adenomas and carcinomas. Nat Genet45, 136–144, doi: 10.1038/ng.2503 (2013).
3. Dunlop, M. G. et al. Cancer risk associated with germline DNA mismatch repair gene mutations. Hum Mol Genet6, 105–110 (1997).
4. Hendriks, Y. M. et al. Cancer risk in hereditary nonpolyposis colorectal cancer due to MSH6 mutations: impact on counseling and surveillance. Gastroenterology127, 17–25 (2004).
5. Senter, L. et al. The clinical phenotype of Lynch syndrome due to germ-line PMS2 mutations. Gastroenterology135, 419–428, doi: 10.1053/j.gastro.2008.04.026 (2008).
6. Jass, J. R. et al. Diagnostic use of microsatellite instability in hereditary non-polyposis colorectal cancer. Lancet346, 1200–1201 (1995).
7. Herman, J. G. et al. Incidence and functional consequences of hMLH1 promoter hypermethylation in colorectal carcinoma. Proc Natl Acad Sci USA95, 6870–6875 (1998).
8. Simpkins, S. B. et al. MLH1 promoter methylation and gene silencing is the primary cause of microsatellite instability in sporadic endometrial cancers. Hum Mol Genet8, 661–666 (1999).
9. Haraldsdottir, S. et al. Colon and endometrial cancers with mismatch repair deficiency can arise from somatic, rather than germline, mutations. Gastroenterology147, 1308–1316 e1301, doi: 10.1053/j.gastro.2014.08.041 (2014).
10. Hampel, H. et al. Screening for Lynch syndrome (hereditary nonpolyposis colorectal cancer) among endometrial cancer patients.
Cancer Res66, 7810–7817, doi: 10.1158/0008-5472.can-06-1114 (2006).
11. Smyrk, T. C., Watson, P., Kaul, K. & Lynch, H. T. Tumor-infiltrating lymphocytes are a marker for microsatellite instability in colorectal carcinoma. Cancer91, 2417–2422 (2001).
12. Goldsby, R. E. et al. Defective DNA polymerase-delta proofreading causes cancer susceptibility in mice. Nat Med7, 638–639, doi: 10.1038/88963 (2001).
13. Simon, M., Giot, L. & Faye, G. The 3′ to 5′ exonuclease activity located in the DNA polymerase delta subunit of Saccharomyces cerevisiae is required for accurate replication. EMBO J10, 2165–2170 (1991).
14. Network, T. C. G. A. Comprehensive molecular characterization of human colon and rectal cancer. Nature487, 330–337, doi: 10.1038/nature11252 (2012).
15. Cerami, E. et al. The cBio cancer genomics portal: an open platform for exploring multidimensional cancer genomics data.
Cancer Discov2, 401–404, doi: 10.1158/2159-8290.cd-12-0095 (2012).
16. Church, D. N. et al. DNA polymerase epsilon and delta exonuclease domain mutations in endometrial cancer. Hum Mol Genet 22, 2820–2828, doi: 10.1093/hmg/ddt131 (2013).
17. Dunlop, M. G. et al. Common variation near CDKN1A, POLD3 and SHROOM2 influences colorectal cancer risk. Nat Genet44,
770–776, doi: 10.1038/ng.2293 (2012).
18. Houlston, R. S. et al. Meta-analysis of three genome-wide association studies identifies susceptibility loci for colorectal cancer at 1q41, 3q26.2, 12q13.13 and 20q13.33. Nat Genet42, 973–977, doi: 10.1038/ng.670 (2010).
19. Newcomb, P. A. et al. Colon Cancer Family Registry: an international resource for studies of the genetic epidemiology of colon cancer. Cancer Epidemiol Biomarkers Prev16, 2331–2343, doi: 10.1158/1055-9965.epi-07-0648 (2007).
20. Tomlinson, I. P. et al. A genome-wide association study identifies colorectal cancer susceptibility loci on chromosomes 10p14 and 8q23.3. Nat Genet40, 623–630, doi: 10.1038/ng.111 (2008).
21. Yeager, M. et al. Genome-wide association study of prostate cancer identifies a second risk locus at 8q24. Nat Genet39, 645–649, doi: 10.1038/ng2022 (2007).
22. Spurdle, A. B. et al. Genome-wide association study identifies a common variant associated with risk of endometrial cancer. Nat Genet43, 451–454, doi: 10.1038/ng.812 (2011).
23. 2, T. W. T. C.-C. C. Genome-wide association study of 14,000 cases of seven common diseases and 3,000 shared controls. Nature 447, 661–678, doi: 10.1038/nature05911 (2007).
24. Eeles, R. A. et al. Identification of 23 new prostate cancer susceptibility loci using the iCOGS custom genotyping array. Nat Genet 45, 385–391, 391e381-382, doi: 10.1038/ng.2560 (2013).
25. Michailidou, K. et al. Large-scale genotyping identifies 41 new loci associated with breast cancer risk. Nat Genet45, 353–361, 361e351-352, doi: 10.1038/ng.2563 (2013).
27. Sakoda, L. C., Jorgenson, E. & Witte, J. S. Turning of COGS moves forward findings for hormonally mediated cancers. Nat Genet 45, 345–348, doi: 10.1038/ng.2587 (2013).
28. Abecasis, G. R. et al. An integrated map of genetic variation from 1,092 human genomes. Nature491, 56–65, doi: 10.1038/ nature11632 (2012).
29. Howie, B., Marchini, J. & Stephens, M. Genotype imputation with thousands of genomes. G3 (Bethesda)1, 457–470, doi: 10.1534/ g3.111.001198 (2011).
30. Marchini, J., Howie, B., Myers, S., McVean, G. & Donnelly, P. A new multipoint method for genome-wide association studies by imputation of genotypes. Nat Genet39, 906–913, doi: 10.1038/ng2088 (2007).
31. Magi, R. & Morris, A. P. GWAMA: software for genome-wide association meta-analysis. BMC Bioinformatics11, 288, doi: 10.1186/1471-2105-11-288 (2010).
32. Kinnersley, B. et al. The TERT variant rs2736100 is associated with colorectal cancer risk. Br J Cancer107, 1001–1008, doi: 10.1038/bjc.2012.329 (2012).
33. Hubner, R. A. & Houlston, R. S. MTHFR C677T and colorectal cancer risk: A meta-analysis of 25 populations. Int J Cancer120,
1027–1035, doi: 10.1002/ijc.22440 (2007).
34. Hubner, R. A., Lubbe, S., Chandler, I. & Houlston, R. S. MTHFR C677T has differential influence on risk of MSI and MSS colorectal cancer. Hum Mol Genet16, 1072–1077, doi: 10.1093/hmg/ddm055 (2007).
35. Carvajal-Carmona, L. G. et al. Candidate locus analysis of the TERT-CLPTM1L cancer risk region on chromosome 5p15 identifies multiple independent variants associated with endometrial cancer risk. Hum Genet134, 231–245, doi: 10.1007/s00439-014-1515-4 (2015).
36. Chubb, D. et al. Common variation at 3q26.2, 6p21.33, 17p11.2 and 22q13.1 influences multiple myeloma risk. Nat Genet45,
1221–1225, doi: 10.1038/ng.2733 (2013).
37. Codd, V. et al. Identification of seven loci affecting mean telomere length and their association with disease. Nat Genet45,
422–427, 427e421-422, doi: 10.1038/ng.2528 (2013).
38. Figueroa, J. D. et al. Genome-wide association study identifies multiple loci associated with bladder cancer risk. Hum Mol Genet 23, 1387–1398, doi: 10.1093/hmg/ddt519 (2014).
39. Chung, D., Yang, C., Li, C., Gelernter, J. & Zhao, H. GPA: a statistical approach to prioritizing GWAS results by integrating pleiotropy and annotation. PLoS Genet10, e1004787, doi: 10.1371/journal.pgen.1004787 (2014).
40. Sivakumaran, S. et al. Abundant pleiotropy in human complex diseases and traits. Am J Hum Genet89, 607–618, doi: 10.1016/j. ajhg.2011.10.004 (2011).
41. Grantham, R. Amino acid difference formula to help explain protein evolution. Science185, 862–864 (1974).
42. Adzhubei, I. A. et al. A method and server for predicting damaging missense mutations. Nat Methods7, 248–249, doi: 10.1038/ nmeth0410-248 (2010).
43. Stahl, E. A. et al. Genome-wide association study meta-analysis identifies seven new rheumatoid arthritis risk loci. Nat Genet42,
508–514, doi: 10.1038/ng.582 (2010).
44. Kircher, M. et al. A general framework for estimating the relative pathogenicity of human genetic variants. Nat Genet46,
310–315, doi: 10.1038/ng.2892 (2014).
45. Hunt, K. A. et al. Newly identified genetic risk variants for celiac disease related to the immune response. Nat Genet40, 395–402, doi: 10.1038/ng.102 (2008).
46. Barrett, J. C. et al. Genome-wide association study and meta-analysis find that over 40 loci affect risk of type 1 diabetes. Nat Genet41, 703–707, doi: 10.1038/ng.381 (2009).
47. de Boer, Y. S. et al. Genome-wide association study identifies variants associated with autoimmune hepatitis type 1. Gastroenterology 147, 443–452 e445, doi: 10.1053/j.gastro.2014.04.022 (2014).
48. Dichgans, M. et al. Shared genetic susceptibility to ischemic stroke and coronary artery disease: a genome-wide analysis of common variants. Stroke45, 24–36, doi: 10.1161/strokeaha.113.002707 (2014).
49. Wain, L. V. et al. Genome-wide association study identifies six new loci influencing pulse pressure and mean arterial pressure.
Nat Genet43, 1005–1011, doi: 10.1038/ng.922 (2011).
50. Painter, J. N. et al. Fine-mapping of the HNF1B multicancer locus identifies candidate variants that mediate endometrial cancer risk. Hum Mol Genet24, 1478–1492, doi: 10.1093/hmg/ddu552 (2015).
51. Haiman, C. A. et al. A common variant at the TERT-CLPTM1L locus is associated with estrogen receptor-negative breast cancer.
Nat Genet43, 1210–1214, doi: 10.1038/ng.985 (2011).
52. Kote-Jarai, Z. et al. Seven prostate cancer susceptibility loci identified by a multi-stage genome-wide association study. Nat Genet 43, 785–791, doi: 10.1038/ng.882 (2011).
53. McKay, J. D. et al. Lung cancer susceptibility locus at 5p15.33. Nat Genet40, 1404–1406, doi: 10.1038/ng.254 (2008).
54. Petersen, G. M. et al. A genome-wide association study identifies pancreatic cancer susceptibility loci on chromosomes 13q22.1, 1q32.1 and 5p15.33. Nat Genet42, 224–228, doi: 10.1038/ng.522 (2010).
55. Shete, S. et al. Genome-wide association study identifies five susceptibility loci for glioma. Nat Genet41, 899–904, doi: 10.1038/ ng.407 (2009).
56. Stacey, S. N. et al. New common variants affecting susceptibility to basal cell carcinoma. Nat Genet41, 909–914, doi: 10.1038/ ng.412 (2009).
57. Turnbull, C. et al. Variants near DMRT1, TERT and ATF7IP are associated with testicular germ cell cancer. Nat Genet42,
604–607, doi: 10.1038/ng.607 (2010).
58. Wang, Y. et al. Common 5p15.33 and 6p21.33 variants influence lung cancer risk. Nat Genet40, 1407–1409, doi: 10.1038/ng.273 (2008).
59. Manfroid, I., Caubit, X., Kerridge, S. & Fasano, L. Three putative murine Teashirt orthologues specify trunk structures in Drosophila in the same way as the Drosophila teashirt gene. Development131, 1065–1073, doi: 10.1242/dev.00977 (2004). 60. Tomlinson, I. P. et al. Multiple common susceptibility variants near BMP pathway loci GREM1, BMP4, and BMP2 explain part
of the missing heritability of colorectal cancer. PLoS Genet7, e1002105, doi: 10.1371/journal.pgen.1002105 (2011).
Acknowledgements
agreements with the following CCFR centres: Australasian Colorectal Cancer Family Registry, Mayo Clinic Cooperative Family Registry for Colon Cancer Studies, Ontario Familial Colorectal Cancer Registry, Seattle Colorectal Cancer Family Registry, USC Consortium Colorectal Cancer Family Registry. The Colon CFR GWAS was supported by funding from the National Cancer Institute, National Institutes of Health (U01 CA122839 and R01 CA143237 to Graham Casey). The content of this manuscript does not necessarily reflect the views or policies of the National Cancer Institute or any of the collaborating centres in the Colon Cancer Family Registry (CCFR), nor does mention of trade names, commercial products, or organizations imply endorsement by the US Government or the CCFR. Jeremy P. Cheadle was funded by the Bobby Moore Fund from Cancer Research UK, Tenovus, the Kidani Trust, Cancer Research Wales and the National Institute for Social Care and Health Research Cancer Genetics Biomedical Research Unit. Nada A. Al-Tassan and Brian F. Meyer were funded and supported by KFSHRC. Luis Carvajal-Carmona receives founding from The V Foundation for Cancer Research.The authors would also like to acknowledge The Australian Ovarian Cancer Study (AOCS) group. A full list of the participants and their affiliations appears in the suppplementary information file that is appended to this article.
Author Contributions
Recruited study participants, obtained samples and provided data. T.H.T.C., M.G., L.M., C.P., A.J., D.D.B., A.K.W., J.H., M.J., N.M.L., P.A.N., S.G., D.C., F.S., G.C., G.G.G., P.P., J.P., A.n.C., A.n.S., F.C., J.M.C., D.L., P.F., B.B., H.e.B., H.i.B., J.C.C., H.B.S., V.K., H.D., J.L., T.L., A.L., P.e.r.H., M.E.P., M.o.S., A.C.a., S.C.B., A.R.M., S.a.A., M.R.T., W.M.D., J.o.D., G.O., T.P., E.H., J.A., K.A., R.J.S., M.M.c.E., E.L.G., S.C.D., S.J.W., B.L.F., H.M.J.W., J.T., T.S.N., E.T., M.M., I.R., P.e.t.H., T.D., F.A., S.S., A.H., M.W.B., A.E., K.C., A.M., M.K.B., K.M., J.P.T., Q.W., S.h.A., C.S.H., M.i.S., D.A., J.e.D., A.O.C.S., N.A.l.T., R.e.H., B.F.M., N.W., F.J.H., B.K., S.M.F., M.T., A.T., H.C., R.W.H., S.H., L.C.C., J.P.C., D.E., M.D., R.i.H., A.m.S. and I.T. Performed additional molecular analyses: T.C., J.P.a., T.O.’M., A.J., A.D., M.S. and L.C.-C. Analysed data: T.C., D.T., C.P. and I.T. Planned and supervised study: D.E., M.D.u.n., R.H.o., A.S.p. and I.T. Obtained funding: M.E.P., M.S., A.C.a., A.C., S.C.-B., A.R.M., S.A., M.T., P.P., P.H., H.S., H.W., J.T., T.N., D.L., P.F., E.T., M.M., I.R., M.D.u.r., T.D., F.A., L.C., S.S., A.H., M.B., S.R., K.C., A.M., D.E., A.S.p. and I.T. Wrote manuscript: T.C., D.T., R.H.o., A.S.p. and I.T.
Additional Information
Supplementary information accompanies this paper at http://www.nature.com/srep
Competing financial interests: The authors declare no competing financial interests.
How to cite this article: Cheng, T. H.T. et al. Meta-analysis of genome-wide association studies identifies common susceptibility polymorphisms for colorectal and endometrial cancer near SH2B3
and TSHZ1. Sci. Rep.5, 17369; doi: 10.1038/srep17369 (2015).