eurostat
UMWELTSTATISTIK
ENVIRONMENT STATISTICS
STATISTIQUES DE L'ENVIRONNEMENT
1996
7
/
A
eurostat
STATISTISCHES AMT DER EUROPAISCHEN GEMEINSCHAFTEN STATISTICAL OFFICE OF THE EUROPEAN COMMUNITIES OFFICE STATISTIQUE DES COMMUNAUTÉS EUROPÉENNES
L-2920 Luxembourg — Tél. (352) 43 01-1 — Télex COMEUR LU 3423 B-1049 Bruxelles, rue de la Loi 200 — Tél. (32-2) 299 11 11
Eurostat hat die Aufgabe, den Informa-tionsbedarf der Kommission und aller am Aufbau des Binnenmarktes Beteiligten mit Hilfe des europäischen statistischen Systems zu decken.
Um der Öffentlichkeit die große Menge an verfügbaren Daten zugänglich zu machen und Benutzern die Orientierung zu erleichtern, werden zwei Arten von Publi-kationen angeboten: Statistische Doku-mente und Veröffentlichungen.
Statistische Dokumente sind für den Fachmann konzipiert und enthalten das ausführliche Datenmaterial: Bezugs-daten, bei denen die Konzepte allgemein bekannt, standardisiert und wissenschaft-lich fundiert sind. Diese Daten werden in einer sehr tiefen Gliederung dargeboten. Die Statistischen Dokumente wenden sich an Fachleute, die in der Lage sind, selbständig die benötigten Daten aus der Fülle des dargebotenen Materials auszu-wählen. Diese Daten sind in gedruckter Form und/oder auf Diskette, Magnet-band, CD-ROM verfügbar. Statistische Dokumente unterscheiden sich auch optisch von anderen Veröffentlichungen durch den mit einer stilisierten Graphik versehenen weißen Einband.
Veröffentlichungen wenden sich an eine ganz bestimmte Zielgruppe, wie zum Beispiel an den Bildungsbereich oder an Entscheidungsträger in Politik und Ver-waltung. Sie enthalten ausgewählte und auf die Bedürfnisse einer Zielgruppe abgestellte und kommentierte Informa-tionen. Eurostat übernimmt hier also eine Art Beraterrolle.
Für einen breiteren Benutzerkreis gibt Eurostat Jahrbücher und periodische Veröffentlichungen heraus. Diese enthal-ten statistische Ergebnisse für eine erste Analyse sowie Hinweise auf weiteres Datenmaterial für vertiefende Unter-suchungen. Diese Veröffentlichungen werden in gedruckter Form und in Daten-banken angeboten, die in Menütechnik zugänglich sind.
Um Benutzern die Datensuche zu erleich-tern, hat Eurostat Themenkreise, d. h. eine Untergliederung nach Sachgebieten, eingeführt. Daneben sind sowohl die Statistischen Dokumente als auch die Veröffentlichungen in bestimmte Reihen, wie zum Beispiel „Jahrbücher", „Kon-junktur", „Methoden", untergliedert, um den Zugriff auf die statistischen Informa-tionen zu erleichtern.
Y. Franchet Generaldirektor
It is Eurostat's responsibility to use the European statistical system to meet the requirements of the Commission and all parties involved in the development of the single market.
To ensure that the vast quantity of ac-cessible data is made widely available, and to help each user make proper use of this information, Eurostat has set up two main categories of document: statistical documents and publications.
The statistical document is aimed at spe-cialists and provides the most complete sets of data: reference data where the methodology is well-established, stand-ardized, uniform and scientific. These data are presented in great detail. The statistical document is intended for ex-perts who are capable of using their own means to seek out what they require. The information is provided on paper and/or on diskette, magnetic tape, CD-ROM. The white cover sheet bears a stylized motif which distinguishes the statistical docu-ment from other publications.
The publications proper tend to be com-piled for a well-defined and targeted public, such as educational circles or political and administrative decision-makers. The information in these docu-ments is selected, sorted and annotated to suit the target public. In this instance, therefore, Eurostat works in an advisory capacity.
Where the readership is wider and less well-defined, Eurostat provides the infor-mation required for an initial analysis, such as yearbooks and periodicals which contain data permitting more in-depth studies. These publications are available on paper or in videotext databases. To help the user focus his research, Eurostat has created 'themes', i.e. subject classifications. The statistical documents and publications are listed by series: e.g. yearbooks, short-term trends or method-ology in order to facilitate access to the statistical data.
Y. Franchet Director-General
Pour établir, évaluer ou apprécier les dif-férentes politiques communautaires, la Comrfiission européenne a besoin d'infor-mations.
Eurostat a pour mission, à travers le sys-tème statistique européen, de répondre aux besoins de la Commission et de l'en-semble des personnes impliquées dans le développement du marché unique. Pour mettre à la disposition de tous l'im-portante quantité de données accessibles et faire en sorte que chacun puisse s'orienter correctement dans cet ensem-ble, deux grandes catégories de docu-ments ont été créées: les docudocu-ments statistiques et les publications.
Le document statistique s'adresse aux spécialistes. Il fournit les données les plus complètes: données de référence où la méthodologie est bien connue, standar-disée, normalisée et scientifique. Ces données sont présentées à un niveau très détaillé. Le document statistique est des-tiné aux experts capables de rechercher, par leurs propres moyens, les données requises. Les informations sont alors disponibles sur papier et/ou sur disquette, bande magnétique, CD-ROM. La couver-ture blanche ornée d'un graphisme stylisé démarque le document statistique des autres publications.
Les publications proprement dites peu-vent, elles, être réalisées pour un public bien déterminé, ciblé, par exemple l'enseignement ou les décideurs politi-ques ou administratifs. Des informations sélectionnées, triées et commentées en fonction de ce public lui sont apportées. Eurostat joue, dès lors, le rôle de conseil-ler.
Dans le cas d'un public plus large, moins défini, Eurostat procure des éléments nécessaires à une première analyse, les annuaires et les périodiques, dans les-quels figurent les renseignements adé-quats pour approfondir l'étude. Ces publications sont présentées sur papier ou dans des banques de données de type vidéotex.
Pour aider l'utilisateur à s'orienter dans ses recherches, Eurostat a créé les thèmes, c'est-à-dire une classification par sujet. Les documents statistiques et les publications sont répertoriés par série — par exemple, annuaire, conjonc-ture, méthodologie — afin de faciliter l'accès aux informations statistiques.
UMWELTSTATISTIK
ENVIRONMENT STATISTICS
STATISTIQUES DE L'ENVIRONNEMENT
1996
Themenkreis /Theme /Thème Umwelt / Environment / Environnement Reihe / Series / Série Jahrbücher und jährliche Statistiken /Yearbooks and Yearly statistics / Annuaires et statistiques annuelles
8
Zahlreiche weitere Informationen zur Europäischen Union sind verfügbar über Internet, Server Europa (http://europa.eu.int).
A great deal of additional information on the European Union is available on the Internet. It can be accessed through the Europa server (http://europa.eu.int).
De nombreuses autres informations sur l'Union européenne sont disponibles sur Internet via le serveur Europa (http://europa.eu.int).
Bibliographische Daten befinden sich am Ende der Veröffentlichung. Cataloguing data can be found at the end of this publication. Une fiche bibliographique figure à la fin de l'ouvrage.
Luxembourg: Office des publications officielles des Communautés européennes, 1997 ISBN 92-828-0714-2
© Europäische Gemeinschaften, 1997 Nachdruck mit Quellenangabe gestattet © European Communities, 1997
Reproduction is authorized, provided the source is acknowledged ©Communautés européennes, 1997
Reproduction autorisée, moyennant mention de la source Printed in Belgium
EINLEITUNG
Zielsetzung
Eurostat legt hiermit im Rahmen des Themenbereichs Umwelt die dritte Ausgabe der Veröffentlichung Umweltstatistik vor. Diese regelmäßig erscheinende Veröffentlichung gibt eine systematische und standardisierte Darstellung offizieller und regelmäßiger Statistiken, die für die Gemeinschaftsaktionen zum Schutz der Umwelt von besonderer Bedeutung sind.
Diese Veröffentlichungsreihe trägt damit zur Befriedigung des wachsenden Informationsbedarfs bei, der im Rahmen des fünften Aktionsprogramms der Gemeinschaft: Für eine dauerhafte und umweltgerechte Entwicklung. Ein Programm der Europäischen Gemeinschaft für Umweltpolitik und Maßnahmen im Hinblick auf eine dauerhafte und umweltgerechte Entwicklung besonders herausgestellt worden ist. Dieses Aktionsprogramm dient den für die Umweltpolitik im Vertrag über die Europäische Union (Maastricht, 7.2.92) gesetzten Zielsetzungen der Förderung eines dauerhaften und umweltgerechten Wachstums, der Erreichung eines hohen Umweltschutzniveaus, der Integration des Umweltschutzes in die anderen Politiken und der Förderung der Maßnahmen auf internationaler und globaler Ebene.
Inhalt
Die hier zusammengestellten Statistiken sollen folgendes liefern:
• Indikatoren zur Überwachung und Überprüfung der Auswirkungen der aktuellen umweltpolitischen Maßnahmen der EU;
• Zahlen, auf deren Grundlage neue umweltpolitische Maßnahmen der Gemeinschaft in Bereichen, die sich als vorrangig zu behandelnde Problemzonen erwiesen haben, konzipiert werden können;
• Datenmaterial, das für die Integration des Faktors Umwelt in andere Bereiche der EU-Politik benötigt wird; • Grunddaten, anhand derer die Auswirkungen öffentlicher und privater Projekte auf die Umwelt ermittelt
werden können.
Beinahe jede Art von statistischem Datenmaterial enthält eine gewisse umweltrelevante Komponente. Bei der Auswahl der in diese Veröffentlichung aufzunehmenden statistischen Reihen wurde ganz bewußt auf folgende Kriterien geachtet:
• unmittelbare Relevanz für die aktuelle Umweltpolitik der Gemeinschaft;
• unmittelbare Relevanz für die bei zukünftigen Gemeinschaftsmaßnahmen zum Schutz der Umwelt vorrangig zu behandelnden Bereiche;
• Verfügbarkeit von Zeitreihen, da Umweltindikatoren häufig nur als über längere Zeiträume beobachtete Trends aussagekräftig sind;
• Basisindikatoren wie Bevölkerungszahl, Fläche und Bruttoinlandsprodukt, die in jeder Umweltstatistik eine Rolle spielen;
• Übereinstimmung mit in der Statistik allgemein verwendeten Standardnomenklaturen und -methodik. Quellen und Danksagung
Eurostat ist eine Generaldirektion der Kommission der Europäischen Gemeinschaften und verantwortlich für das statistische Informationssystem der Gemeinschaft. Die hier veröffentlichten Statistiken wurden unter Mitwirkung der Mitgliedstaaten, anderen Dienststellen der Kommission, der Europäischen Umweltagentur und
internationalen Organisationen zusammengestellt. Eurostat arbeitet insbesondere eng mit der für Umwelt, nukleare Sicherheit und Katastrophenschutz zuständigen Generaldirektion der Kommission (GD XI) zusammen. Daten von internationalem Interesse werden in Zusammenarbeit mit der Organisation für Wirtschaftliche Zusammenarbeit und Entwicklung (OECD) durch einen gemeinsamen Fragebogen zur Erfassung ausgewählter Daten bei den Mitgliedstaaten und eine gemeinsame Aufbereitung der Daten erarbeitet. Die bei der Erfassung und Veröffentlichung der Umweltstatistiken verwendeten Nomenklaturen und Methoden benutzen soweit wie möglich die gemeinsam von Eurostat, der OECD und der Wirtschaftskommission der UNO für Europa (UNECE) festgelegten internationalen Standards und Konzepte. In zunehmendem Maße arbeitet Eurostat auch mit der Europäischen Umweltagentur (EUA) zusammen, um verbesserte Methodiken für die Umweltdaten zu entwickeln und Daten auszutauschen, die in den Veröffentlichungen beider Organisationen benutzt werden (z.B. Umwelt in der Europäischen Union 1995).
Eurostat bedankt sich für diese Zusammenarbeit, ohne die diese Veröffentlichung nicht möglich gewesen wäre.
Neu in dieser Ausgabe
Die dritte Ausgabe ist gegenüber früheren Ausgaben durch die Aufnahme vieler neuer Datenreihen erweitert worden, darunter
Umweltschutzausgaben (neues Kapitel) Kernenergie (neues Kapitel)
Methanemissionen
Qualität der Badegewässer Waldressourcen
Pestizide Luftverkehr
Abbildungen und Karten wurden häufiger benutzt, um die Aufmerksamkeit auf interessante Aspekte der Daten zu lenken.
Wo immer dies möglich war, enthalten die Tabellen lange Zeitreihen für die 15 EUMitgliedstaaten, einschließlich Österreich, Finnland und Schweden, die der EU am 1.1.1995 beigetreten sind. In einigen Fällen war es nicht möglich, vollständige Zeitreihen für die neuen Mitgliedstaaten zu liefern.
Es muß beachtet werden, daß in den Zeitreihen für Deutschland normalerweise ein Bruch wegen der Vereinigung am 3.10.1990 auftritt. Dies betrifft auch die Zeitreihen für EUR 12 und EUR 15.
Der Text wurde für diese Ausgabe vollständig überarbeitet und enthält jetzt mehr Information zur Methodik, entsprechend dem Ansatz in der Veröffentlichung von 1995: Europe's Environment: Statistical Compendium for the Dobrís Assessment, dem Begleitband zu dem von der EUA herausgegeben paneuropäischen Bericht zum Zustand der Umwelt: Europe's Environment: The Dobrís Assessment.
Die Veröffentlichung ist jedoch immer noch in Entwicklung und wird in Zukunft weiter ergänzt werden entsprechend den fortschreitenden Arbeiten von Eurostat, den statistischen Dienststellen der Mitgliedstaaten und der internationalen Organisationen an der Harmonisierung der Konzepte und Methoden, der Validierung der Daten und der Integration der umweltrelevanten Probleme in den Apparat der sozioökonomischen Statistiken. Die Beschränkung auf Statistiken, für die lange Zeitreihen und Angaben von allen oder zumindest den meisten Mitgliedstaaten vorliegen, hat ebenfalls die Auswahl der Daten eingeschränkt und zeigt die Lücken und die Größe der Anstrengungen, die noch unternommen werden müssen, um ein befriedigendes System laufender offizieller Statistiken zu entwickeln.
Luxemburg, den 31. März 1997
Eurostat, Direktion F Abteilung "Umweltstatistik"
Dokumentation:
Generaldirektion Umwelt, nukleare Sicherheit und Katastrophenschutz: Gemeinschaftsrecht im Bereich des Umweltschutzes (Bde. 1-7)
Amt für amtliche Veröffentlichungen der Europäischen Gemeinschaften. Luxemburg, 1992 Europäische Umweltagentur:
Europe's Environment: The Dobris Assessment.
Amt für amtliche Veröffentlichungen der Europäischen Gemeinschaften. Luxemburg, 1995 Eurostat: Europe's Environment: Statistical Compendium for the Dobfís Assessment. Amt für amtliche Veröffentlichungen der Europäischen Gemeinschaften. Luxemburg, 1995 Umwelt in der Europäischen Union -1995
Bericht für die Überprüfung des Fünften Umwelt-Aktionsprogramms
Erarbeitet von der Europäischen Umweltagentur in Zusammenarbeit mit Eurostat
Amt für amtliche Veröffentlichungen der Europäischen Gemeinschaften. Luxemburg, 1995
Geltendes Gemeinschaftsrecht:
Richtlinie des Rates 85/337/EWG vom 27. Juni 1985 über die Umweltverträglichkeitsprüfung bei bestimmten öffentlichen und privaten Projekten
Verordnung des Rates (EWG) 1210/90 vom 7. Mai 1990 über die Schaffung der Europäischen Umweltagentur und des Europäischen Umweltinformations- und -beobachtungsnetzes
Richtlinie des Rates 91/692/EWG vom 23. Dezember 1991 zur Vereinheitlichung und zweckmäßigen Gestaltung der Berichte über die Durchführung bestimmter Umweltschutzrichtlinien
Vertrag über die Europäische Union, 7. Februar 1992
Verordnung des Rates (EWG) Nr. 1973/92 vom 21. Mai 1992 zur Schaffung eines Finanzierungsinstruments für die Umwelt (LIFE)
Entschließung des Rates und der im Rat vereinigten Vertreter der Regierungen der Mitgliedstaaten vom 1. Februar 1993 über ein Gemeinschaftsprogramm für Umweltpolitik und Maßnahmen im Hinblick auf eine dauerhafte und umweltgerechte Entwicklung (5. Umweltaktionsprogramm)
Entscheidung des Rates 94/808/EG vom 15. Dezember 1994 über die Annahme eines Entwicklungsprogramms mit vierjähriger Laufzeit (1994-1997) für die Umweltkomponente in den gemeinschaftlichen Statistiken
Richtlinie des Rates 96/61/EG vom 24. September 1996 über die integrierte Vermeidung und Verminderung der Umweltverschmutzung
Alle Anfragen hinsichtlich Daten und Publikationen von Eurostat sollten gerichtet werden an:
Data Shop Luxemburg 2, me Jean Engling L1466 LUXEMBURG
Telefon: +352 4335 22 51 Telefax: +352 4335 22 221
Email: [email protected]
Allgemeine Informationen über Eurostat und die Europäische Umweltagentur sind auch auf dem Internet zu finden:
http://europa.eu.int/eurostat.html http://www.eea.eu.int
Γ
Es ist geplant, diese Veröffentlichung durch die Aufnahme weiterer geeigneter Daten und die Anwendung neuer Darstellungsverfahren in Zukunft noch zu verbessern. Hinweise der Leser sind ausdrücklich erwünscht und einzusenden an:
John ALLEN
Eurostat Umweltstatistik L2920 LUXEMBURG
Telefon: +352 4301 37291 oder 37286 Telefax: +352 4301 37316
Email: [email protected]
Weitere Veröffentlichungen von Eurostat zum Thema Umwelt:
Kompendien 1990 Umweltstatistik 1989 1992 Umweltstatistik 1991
Sonderkompendium
1995 Europe's environment: Statistical compendium for the Dobrís assessment (nur englische Version verfügbar)
Spezielle Veröffentlichungen
1992 SERIEE (version préliminaire) (nur französische Version verfügbar) 1994 SERIEE 1994 version (deutsche Version in Vorbereitung)
1994 Environmental protection expenditure: data collection methods in the public sector and industry (nur englische Version verfügbar)
1996 Verteilung des Stickstoffeintrags in den Boden durch die Landwirtschaft 1996 Kohlendioxidemissionen von fossilen Brenstoffen 19851993
1997 Abfallstoffe mit Handelswert im Außenhandel der EUR 12 19881994
Statistik kurzgefaßt 1991 Rohstoffe und Umwelt
1995 Straßenverkehr und Umwelt in der Europäischen Union 1996 Straßenverkehr und Umwelt Energie und Steueraspekte 1996 Überblick über die Pestiziddaten in der EU
INHALTSVERZEICHNIS
EINLEITUNG III
1. BASISINDIKATOREN 1
1.1 Basisindikatoren 3
2. BEVÖLKERUNG UND BODENNUTZUNG 5
2.1 Bevölkerung 18 2.1.1 Gesamtbevölkerung 18
2.1.2 Bevölkerungswachstum 19 2.1.3 Bevölkerungsdichte 19
2.2 Bodennutzung 22 2.2.1 Bodennutzung nach Hauptkategorien 1994 22
2.2.2 Ackerland 23 2.2.3 Dauergrünland 23 2.2.4 Dauerkulturen 24 2.2.5 Landwirtschaftlich genutzte Fläche 24
2.2.6 Forstfläche 25 2.2.7 Übrige Fläche 25 2.2.8 Bebaute Fläche 26
2.3 Verstädterung 27
Anmerkungen 28
3. ENERGIE 31
3.1 Energiereserven 46 3.1.1 Energiereserven 46
3.2 Bruttoinlandsverbrauch 48 3.2.1 Bruttoinlandsverbrauch nach Brennstoffarten 48
3.3 Energetischer Endverbrauch 56 3.3.1 Energetischer Endverbrauch, insgesamt 56
3.3.2 Energetischer Endverbrauch der Industrie 56 3.3.3 Energetischer Endverbrauch nach Brennstoffarten 57
3.4 Stromerzeugung und Stromverbrauch 61 3.4.1 Netto-Stromerzeugung nach Energiequellen 61
3.5 Ökonomische Daten 67
Anmerkungen 68
4. WELTWEITE KLIMAVERÄNDERUNGEN 69
4.1 Kohlendioxidemissionen 82 4.1.1 Emissionen nach Sektoren 83
4.2 FCKW und Halone: Erzeugung, Handel und Verbrauch 87
4.2.1 FCKW-11, 12 87 4.2.2 FCKW-11, 12, 113, 114, 115 88
4.2.3 Halon-1211, 1301,2402 88
4.3 Methan 89 4.3.1 Anthropogene Methanemissionen, insgesamt 89
Anmerkungen 90
5. LUFTVERSCHMUTZUNG 91
5.1 Schwefeloxidemissionen 106 5.1.1 Insgesamt 106 5.1.2 Emissionen nach Quellen 107
5.2 Stickstoffoxidemissionen 112 5.2.1 Insgesamt 112 5.2.2 Emissionen nach Quellen 113
5.3 Partikelemissionen 118 5.3.1 Insgesamt 118 5.3.2 Emissionen nach Quellen 119
5.4 Kohlenmonoxidemissionen 124 5.4.1 Insgesamt 124 5.4.2 Emissionen nach Quellen 125
5.5 Emissionen flüchtiger organischer Verbindungen 130
5.5.1 Insgesamt 130 5.5.2 Emissionen nach Quellen 131
5.6 CORINAIR-Emissionskataster1990 136 5.6.1 Detailliertes Emissionskataster nach Quellen 136
5.6.2 Gegenüberstellung der Emissionsschätzwerte, 1990 147
Anmerkungen 156
6. WASSER 163
6.1 Wasservorkommen 171 6.1.1 Langjährige Jahresmittelwerte 171
6.2 Wasserentnahme 172 6.2.1 Süßwasser, insgesamt 172
6.2.2 Süßwasser nach Herkunft 173 6.2.3 Süßwasser, insgesamt nach Hauptverwendungszwecken, 1990 174
6.2.4 Grundwasser (Süßwasser) nach Hauptverwendungszwecken, 1990 175 6.2.5 Oberflächenwasser (Süßwasser) nach Hauptverwendungszwecken, 1990 176
6.3 Wasserverbrauch 177 6.3.1 Öffentliche Wasserversorgung 177
6.4 Abwasser und Klärschlamm 178 6.4.1 Bevölkerung mit Anschluß an die Kanalisation, 1990 178
6.4.2 Anschluß der Bevölkerung an öffentliche Kläranlagen 179 6.4.3 Kommunale Abwasserbehandlungsanlagen, 1990 180 6.4.4 Klärschlamm von öffentlichen Abwasserbehandlungsanlagen, 1990 181
6.5 Qualität der Badegewässer 182 6.5.1 Gesamtcoliforme Bakterien 182
Anmerkungen 183
7. ABFALL 185
7.1 Abfallaufkommen und Abfallentsorgung 199 7.1.1 Abfallaufkommen nach Sektoren 199 7.1.2 Abfallaufkommen nach ausgewählten Abfallströmen 200
7.1.3 Anlagen zur Behandlung und Beseitigung von Abfällen 201
7.2 Siedlungsabfälle 202 7.2.1 Gesamtaufkommen 202
7.2.2 Gesamtaufkommen, je Einwohner 203
7.2.3 Zusammensetzung 204 7.2.4 Behandlung und Beseitigung 205
7.3 Industrielle und gefährliche Abfälle 206 7.3.1 Aufkommen gefährlicher Abfälle: ausgewählte Kategorien 206
7.3.2 Aufkommen, Transport, Behandlung und Beseitigung gefährlicher Abfälle 207
7.4 Abfallrecyclingmaßnahmen 208 7.4.1 Rückgewinnungsquoten 208
Anmerkungen 209
8. SEKTORALE INDIKATOREN: VERKEHR 217
8.1 Verkehrsmittel im Vergleich 227 8.1.1 Personenverkehr auf nationalem Staatsgebiet 227
8.1.2 Güterverkehr nach Verkehrszweigen 230 8.1.3 Beförderung von Rohöl und Mineralölerzeugnissen in Pipelines 231
8.1.4 Energetischer Endverbrauch nach Verkehrszweigen 232 8.1.5 Kohlendioxidemissionen nach Verkehrszweigen 235
8.2 Straßenverkehr 237 8.2.1 Bestand an Personenkraftwagen 237
8.2.2 Länge des Straßennetzes 238
8.2.3 Fahrleistung 240 8.2.4 Bleiemissionen von Kraftfahrzeugen mit Benzinmotor 241
8.2.5 Lieferungen von bleifreiem Benzin 242 8.2.6 Steuerliche Unterschiede zwischen bleihaltigem und bleifreiem Benzin 243
8.2.7 Preise für Kraftstoff (1 000 I) als Anteil am verfügbaren Nettoeinkommen 243
8.3 Eisenbahnverkehr 244 8.3.1 Betriebsstreckenlänge am Jahresende 244
8.4 Luftverkehr 246 8.4.1 Luftbewegungen 246
Anmerkungen 247
9. SEKTORALE INDIKATOREN: LANDWIRTSCHAFT 251
9.1 Allgemeine Trends 261 9.1.1 Endproduktion 261 9.1.2 Anzahl und durchschnittliche Größe der Betriebe 261
9.1.3 Betriebe nach Größenklassen 262
9.1.4 Hauptanbau 1994 264 9.1.5 Erträge wichtiger pflanzlicher Erzeugnisse 265
9.1.6 Viehbestand 267 9.1.7 Gefährdete Haustierrassen 269
9.2 Verbrauch 270 9.2.1 Verbrauch von Handelsdüngern 270
9.2.2 Nährstoff mengen im Wirtschaftsdünger 272
9.2.3 Verbrauch von Pestiziden 275
Anmerkungen 278
10. SEKTORALE INDIKATOREN: FORSTWIRTSCHAFT 283
10.1 Waldressourcen 296 10.1.1 Aufteilung der Forstfläche 296
10.1.2 Aufteilung der Forstfläche nach Besitzverhältnissen 298
10.1.3 Verteilung der Baumarten im Hochwald 299 10.1.4 Stehender Vorrat und jährlicher Nettozuwachs 300
10.1.5 Rundholzerzeugung 301 10.1.6 Versorgungsbilanz für Rundholz 302
10.1.7 Ergebnisse der forstwirtschaftlichen Maßnahmen
in landwirtschaftlichen Betrieben 305
10.2 Waldschäden 306 10.2.1 NadelVBIattverlust sämtlicher Arten nach Schadstufen, 1995 306
10.2.2 NadelVBIattverlust (Schadstufen 2-4) 307
10.2.3 Waldbrände 308
Anmerkungen 309
11. FLORA UND FAUNA 313
11.1 Artenvielfalt 327 11.1.1 Bestand an Säugetieren, Vögeln und Fischen 327
11.1.2 Bestand an Reptilien, Amphibien und Wirbellosen 328 11.1.3 Bestand an Gefäßpflanzen, Moosen, Flechten, Pilzen und Algen 329
11.2 Schutzgebiete 330 11.2.1 Wichtigste Schutzgebiete nach lUCN-Kategorien, 1993 330
11.3 Handel 331 11.3.1 Handel mit Tropenholz 331
11.3.2 Handel mit rohen Wildkatzenfellen 332 11.3.3 Handel mit gegerbten und zugerichteten Wildkatzenfellen 333
Anmerkungen 334
12. UMWELTSCHUTZAUSGABEN 339
12.1 Bruttoinlandsprodukt 352 12.1.1 Bruttoinlandsprodukt zu Marktpreisen (konstante Preise von 1990) 352
12.2 Umweltschutzausgaben 353 12.2.1 Umweltschutzausgaben als Anteil am BIP 353
12.2.2 Umweltschutzinvestitionen als Anteil an den Bruttoanlageinvestitionen (BAI) 354
12.2.3 Investitionen und laufende Ausgaben im öffentlichen Sektor 355 12.2.4 Investitionen und laufende Ausgaben der Unternehmen 356
Anmerkungen 359
13. UMWELTBEWUSSTSEIN 363
13.1 Trends im Umweltbewußtsein 367 13.1.1 Beschwerden über die lokale Umwelt 367
13.1.2 Besorgnis über verschiedene Bedrohungen der Umwelt im eigenen Land 369
13.1.3 Besorgnis über verschiedene Bedrohungen der Umwelt weltweit 371
13.2 Bereitschaft zu Einschränkungen 375
Anmerkungen 376
14. KERNENERGIE 377
14.1 Kernenergieindikatoren 384
14.2 Kernkraftwerke 386 14.2.1 Kernkraftwerke 386
14.3 Erzeugung und Entsorgung radioaktiver Abfälle 393 14.3.1 Aufkommen an abgebrannten Brennstoffen 393
Anmerkungen 394
ANHANG: ABKÜRZUNGEN UND ZEICHEN 395
VERZEICHNIS DER ABBILDUNGEN
Abb; Abb: Abbi Abbi Abbi Abbi Abbi Abbi Abb! Abb! Abb Abb Abb Abb Abb Abb! Abb Abb Abb Abb Abb Abb Abb Abb Abb Abb Abb Abb Abb Abb Abb
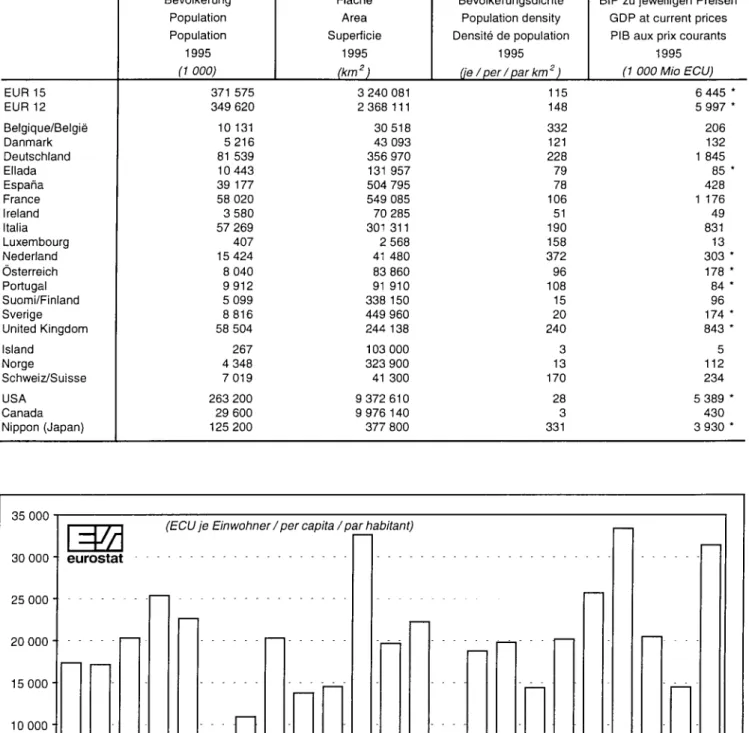
Idung 1.1 BIP zu jeweiligen Preisen je Einwohner, 1995 3
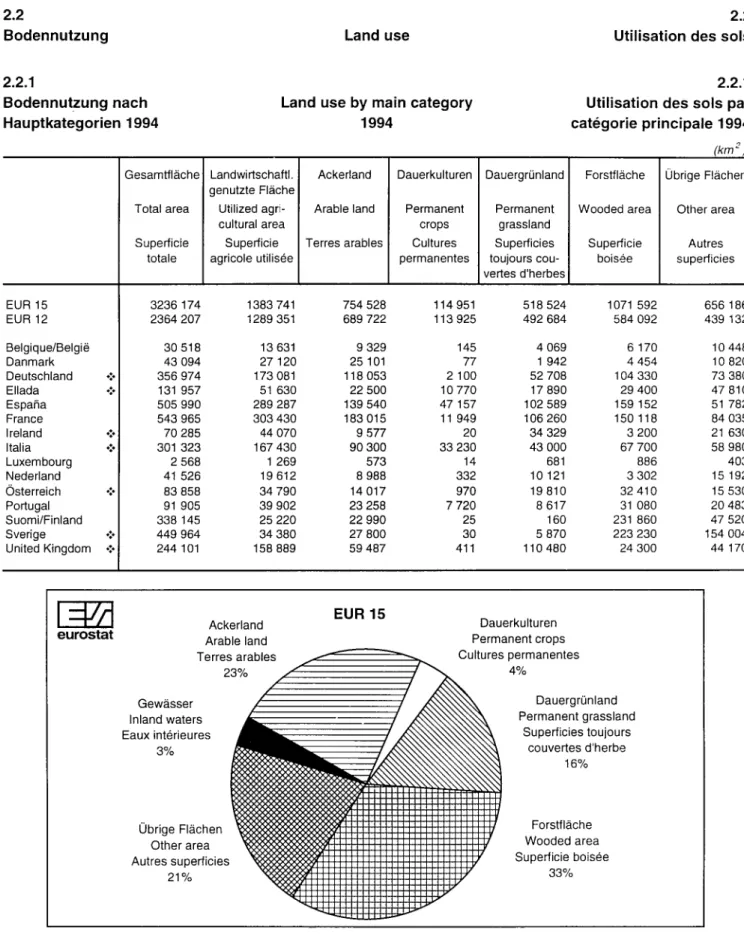
Idung 2.2.1 Bodennutzung nach Hauptkategorien 1994 22
Idung 3.2.1 Bruttoinlandsverbrauch je Einwohner 53
Idung 3.2.2 Bruttoinlandsverbrauch nach Brennstoffarten 54
Idung 3.3.1 Energetischer Endverbrauch nach Sektoren 59
Idung 3.3.2 Energetischer Endverbrauch der Industrie 1994 60
Idung 3.4.1 NettoStromerzeugung nach Energiequellen 65
Idung 3.4.2 Stromverbrauch nach Sektoren 66
Idung 3.5.1 Energieintensität 67
Idung 4.1.1 EUGesamtemissionen nach Sektoren 82
Idung 4.1.2 Emissionen je Einwohner 82
Idung 4.1.3 EUGesamtemissionen nach Brennstoffarten 83
Idung 4.1.4 Veränderungen 1990 1994 86
Idung 8.1.1 Güterverkehr nach Verkehrszweigen 229
Idung 8.1.2 Kohlendioxidemissionen nach Verkehrszweigen 234
Idung 8.2.1 Personenkraftwagen je 1 000 Einwohner 237
Idung 8.2.2 Straßendichte: Autobahnen 239
Idung 8.3.1 Dichte des Eisenbahnnetzes 245
Idung 9.1.1 Durchschnittliche landwirtschaftlich genutzte Fläche je Betrieb, 1993 262
Idung 9.1.2 Betriebe nach Größenklassen 263
Idung 9.2.1 Einsatz von Pestiziden 1992 277
Idung 12.2.1 Ausgaben nach Umweltbereichen, 1994 357
Idung 12.2.2 Kapital und Betriebsausgaben nach Umweltbereichen, 1994 357
Idung 12.2.3 Direkte Beschäftigung in der EUÖkoIndustrie, insgesamt 1994 358 Idung 12.2.4 Umweltschutzausgaben für die Kernbereiche Luft, Abwasser, Abfall, Lärm 358
Idung 13.1.1 Beschwerden über die lokale Umwelt 372
Idung 13.1.2 Besorgnis über verschiedene Bedrohungen der Umwelt im eigenen Land 373
Idung 13.1.3 Besorgnis über verschiedene Bedrohungen der Umwelt weltweit 374
Idung 13.2.1 Einschränkungen zum Wohl der Umwelt 375
Idung 14.1.1 Anteil der Kernenergie am Bruttoinlandsverbrauch 384
Idung 14.1.2 Anteil der Kernenergie an der gesamten Stromerzeugung 385
VERZEICHNIS DER KARTEN
Karte Karte Karte Karte Karte Karte Karte Karte Karte Karte Karte Karte Karte Karte Karte Karte Karte
2.1.1 2.1.2 2.3.1 3.2.1 5.6.1 5.6.2 5.6.3 5.6.4 5.6.5 5.6.6 5.6.7 5.6.8 9.2.1 10.1.1 10.1.2 14.2.1 14.2.2
Bevölkerungswachstum 20
Bevölkerungsdichte 21
Verstädterung 1981 1991 27
Steinkohleimporte 55
S02Emissionen 148
ΝΟχEmissionen 149
NMVOCEmissionen 150
CH4Emissionen 151
COEmissionen 152
C02Emissionen 153
N20Emissionen 154
NH3Emissionen 155
Stickstoffbilanz 274
Forstfläche, als Anteil an der Gesamtfläche 297
Jährliche Entnahmemengen 304
Kernkraftwerke nach Typen 391
Kernkraftwerke nach Kapazitäten 392
INTRODUCTION
Objectives
Eurostat presents here, in the framework of the theme Environment, the third edition of the publication Environment Statistics. This publication, which appears at regular intervals, aims to offer in a systematic and standardized manner a set of regular and official statistics which are directly relevant to Community action on the environment.
This publication contributes to the satisfaction of the growing need for information which has been especially highlighted by the fifth Community environmental action programme Towards sustainability: a European Community programme of policy and action in relation to the environment and sustainable development. This action programme serves the objectives of the Treaty on European Union (signed at Maastricht on 7 February 1992): the promotion of sustainable growth respecting the environment, the aim of a high level of protection, the integration of environmental protection requirements into other policies and contribution to promoting measures at international and global level.
Contents
The statistics presented aim to deliver the following:
• indicators for monitoring and verifying the effects of existing EU policy measures on the environment; • quantitative information assisting the formation of new environmental policy measures for the Community,
on subjects which have been identified as priority areas for Community action;
• information required for integration of the environmental dimension in other EU policies; • basic data required for assessment of the environmental impact of public and private projects.
Almost any statistical data may have some environmental relevance; the scope of this publication has been deliberately focused by choosing statistical series according to the following criteria:
• direct relevance to existing Community environmental policy;
• direct relevance to priority areas for future Community action on the environment;
• availability of time series, since environmental indicators can frequently be interpreted only in terms of trends over long periods;
• basic indicators, such as population, land area and gross domestic product, which are involved in the presentation of all environment statistics;
• compliance with standard statistical nomenclatures and methodology. Sources and acknowledgement
Eurostat is a Directorate-General of the Commission of the European Communities, with responsibility for the Community statistical information system. The statistics published here are the product of collaboration with the statistical services of the Member States, with other services of the Commission, with the European Environment Agency, and with international organizations. Eurostat works closely with the Commission's Directorate-General for Environment, Nuclear Safety and Civil Protection (DG XI). For data with international interest, Eurostat cooperates with the Organization for Economic Cooperation and Development (OECD) in obtaining data from Member States via a common questionnaire and by joint compilation of the data. As far as possible, the nomenclatures and methods used for collection and publication of environment statistics follow international
standards established jointly by Eurostat, OECD and by the United Nations Economic Commission for Europe (UNECE). Increasingly, Eurostat also collaborates with the European Environment Agency (EEA) in the development of improved methodologies for environmental data and also in the exchange of data, which are used in the publications of both organizations, such as Environment in the European Union 1995.
Eurostat acknowledges this collaboration, without which this publication would not have been possible. New in this edition
The third edition has been enlarged compared with earlier editions by many new series including: environmental expenditures (new chapter)
nuclear energy (new chapter) methane emissions
bathing water quality forest resources pesticides airtransport
Graphics and maps are used more intensively to draw attention to interesting features of the data.
Where possible, the tables include long time series for 15 EU Member States, including Austria, Finland and Sweden which joint the EU on 1.1.1995. In some cases it has not been possible to provide complete time series for the new Member States.
Note that in time series for Germany, there is normally a break in series corresponding to the unification on 3.10.1990. This also affects the EUR 12 and EUR 15 time series.
The text in this edition has been completely updated and now includes more methodological information, following the approach of the 1995 publication Europe's Environment: Statistical Compendium for the Dobfis Assessment, the companion volume to the pan-European state of the environment report Europe's Environment:
The Dobfis Assessment published by the EEA.
This publication is still in development; it will be enlarged, and gaps filled in the future, as Eurostat, the Member States and the international statistical organizations make progress in the harmonization of concepts and methods, in the validation of the data and in the integration of the environmental issues in the main body of socio-economic statistics. The restriction to statistics which are available over a long series of years and for all or most Member States has also limited the choice of data and illustrates the gaps and the great efforts which still have to be made on the way to the establishment of regular official environment statistics.
Luxembourg, 31 March 1997 Eurostat, Directorate F Environment Statistics Unit
Documentation:
Directorate-General for Environment, Nuclear Safety and Civil Protection: European Community environment legislation (Vols. 1-7)
Office for Official Publications of the European Communities. Luxembourg, 1992 European Environment Agency:
Europe's Environment: The Dobn's Assessment.
Office for Official Publications of the European Communities. Luxembourg, 1995 Eurostat: Europe's Environment: Statistical Compendium for the Dobfis Assessment. Office for Official Publications of the European Communities. Luxembourg, 1995
Environment in the European Union -1995 - Report of the Fifth Environmental Action Programme Prepared by the European Environment Agency in cooperation with Eurostat.
Office for Official Publications of the European Communities. Luxembourg, 1995
Community Legislation:
Council Directive 85/337/EEC of 27 June 1985 on the assessment of the effects of certain public and private projects on the environment
Council Regulation (EEC) 1210/90 of 7 May 1990 on the establishment of the European Environment Agency and the European environment information and observation network
Council Directive 91/692/EEC of 23 December 1991 standardizing and rationalizing reports on the implementation of certain Directives relating to the environment
Treaty on European Union, 7 February 1992
Council Regulation (EEC) No 1973/92 of 21 May 1992 establishing a financial instrument for the environment (LIFE)
Resolution of the Council and the Representatives of the Governments of the Member States, meeting within the Council of 1 February 1993 on a Community programme of policy and action in relation to the environment and sustainable development (Fifth Environmental Action Programme).
Council Decision 94/808/EC of 15 December 1994 adopting a 4-year development programme (1994-1997) relating to the environmental component of Community statistics
Council Directive 96/61/EC of 24 September 1996 concerning integrated pollution prevention and control
All requests for Eurostat data and publications should be sent to:
Data Shop Luxembourg 2, rue Jean Engling L-1466 LUXEMBOURG
Phone: +352 4335 22 51 Fax: +352 4335 22 221
Email: [email protected]
General information on Eurostat and European Environment Agency products are available on the internet:
http://europa.eu.int/eurostat.html http://www.eea.eu.int
It is planned to improve this publication in the future by the inclusion of further suitable data and by new methods of presentation. Comments from readers are welcome and should be sent to:
John ALLEN
Eurostat - Environment Statistics L-2920 LUXEMBOURG
Phone: +352 4301 37291 or 37286 Fax: +352 430137316
Email: [email protected]
Other Eurostat publications on environment:
Compendiums
1990 Environment statistics 1989 1992 Environment statistics 1991
Special compendium
1995 Europe's environment: Statistical compendium for the Dobfis assessment
Domain-specific publications
1992 SERIEE (version préliminaire) only French version available 1994 SERIEE 1994 version
1994 Environmental protection expenditure: data collection methods in the public sector and industry
1996 The distribution of nitrogen inputs to agriculture 1996 Carbon dioxide emissions from fossil fuels 1985-1993
1997 EUR 12 trade in commercially valuable waste materials 1988-1994
Statistics in Focus
1991 Raw materials and environment
1995 Road transport and the environment in the European Union 1996 Road transport and the environment - Energy and fiscal aspects 1996 Overview of pesticide data in the EU
TABLE OF CONTENTS
INTRODUCTION XIII
1. BASIC INDICATORS 1
1.1 Basic indicators 3
2. POPULATION AND LAND USE 5
2.1 Population 18 2.1.1 Total population 18
2.1.2 Population growth 19 2.1.3 Population density 19
2.2 Land use 22 2.2.1 Land use by main category 1994 22
2.2.2 Arable land 23 2.2.3 Permanent grassland 23
2.2.4 Permanent crops 24 2.2.5 Utilized agricultural area 24
2.2.6 Wooded area 25 2.2.7 Other area 25 2.2.8 Built-up land 26
2.3 Urbanization 27
Notes 28
3. ENERGY 31
3.1 Energy reserves 46 3.1.1 Energy reserves 46
3.2 Gross inland consumption 48 3.2.1 Gross inland consumption by fuel type 48
3.3 Final energy consumption 56 3.3.1 Total final energy consumption 56
3.3.2 Final energy consumption of industry 56 3.3.3 Final energy consumption by fuel type 57
3.4 Electricity generation and consumption 61 3.4.1 Net electricity generation by source of energy 61
3.5 Economic data 67
Notes 68
4. GLOBAL CLIMATE CHANGE 69
4.1 Carbon dioxide emissions 82 4.1.1 Emissions by sector 83 4.2 Production, trade and consumption of CFCs and Halons 87
4.2.1 CFC-11, 12 87 4.2.2 CFC-11, 12, 113, 114, 115 88
4.2.3 Halon-1211, 1301,2402 88
4.3 Methane 89 4.3.1 Total man-made methane emissions 89
Notes 90
5. AIR POLLUTION 91
5.1 Emissions of sulphur oxides 106
5.1.1 Total 106 5.1.2 Emissions by source 107
5.2 Emissions of nitrogen oxides 112
5.2.1 Total 112 5.2.2 Emissions by source 113
5.3 Emissions of particulate matter 118
5.3.1 Total 118 5.3.2 Emissions by source 119
5.4 Emissions of carbon monoxide 124
5.4.1 Total 124 5.4.2 Emissions by source 125
5.5 Emissions of volatile organic compounds 130
5.5.1 Total 130 5.5.2 Emissions by source 131
5.6 CORINAIR 1990 inventory 136 5.6.1 Detailed inventory of emissions by source 136
5.6.2 Comparison of emission estimates, 1990 147
Notes 156
6. WATER 163
6.1 Water resources 171 6.1.1 Long term annual average 171
6.2 Water abstraction 172 6.2.1 Total fresh water 172
6.2.2 Fresh water by source 173 6.2.3 Total fresh water by major activity, 1990 174
6.2.4 Fresh ground water by major activity, 1990 175 6.2.5 Fresh surface water by major activity, 1990 176
6.3 Water consumption 177 6.3.1 Public water supply 177
6.4 Waste water and sewage sludge 178 6.4.1 Population connected to sewerage system, 1990 178
6.4.2 Population served by public waste water treatment plants 179
6.4.3 Municipal waste water treatment plants, 1990 180 6.4.4 Sewage sludge from public sewage treatment, 1990 181
6.5 Bathing water quality 182 6.5.1 Total coliforms 182
Notes 183
7. WASTES 185
7.1 Waste generation and waste treatment 199 7.1.1 Waste generation by sector 199 7.1.2 Waste generation by selected waste streams 200
7.1.3 Waste treatment and disposal installations 201
7.2 Municipal waste 202 7.2.1 Total amounts 202
7.2.2 Total amounts, per capita 203
7.2.3 Composition 204 7.2.4 Treatment and disposal 205
7.3 Industrial and hazardous waste 206 7.3.1 Hazardous waste generation: selected categories 206
7.3.2 Production, movement, treatment and disposal of hazardous waste 207
7.4 Waste recycling activities 208 7.4.1 Recovery rates 208
Notes 209
8. SECTORAL INDICATORS: TRANSPORT 217
8.1 Intermodal comparison 227 8.1.1 Passenger transport on national territory 227
8.1.2 Goods transport by transport mode 230 8.1.3 Transport of crude oil and petroleum products by pipelines 231
8.1.4 Final energy consumption by transport mode 232 8.1.5 Carbon dioxide emissions by transport mode 235
8.2 Road transport 237 8.2.1 Stock of passenger cars 237
8.2.2 Length of road network 238
8.2.3 Road traffic 240 8.2.4 Lead emissions from petrol engined motor vehicles 241
8.2.5 Deliveries of unleaded petrol 242 8.2.6 Tax differentials between leaded and unleaded petrol 243
8.2.7 Fuel price (1 000 L) as percentage of net disposable income 243
8.3 Railway traffic 244 8.3.1 Length of railway network at end of year 244
8.4 Airtransport 246 8.4.1 Air traffic 246
Notes 247
9. SECTORAL INDICATORS: AGRICULTURE 251
9.1 General trends 261 9.1.1 Final output 261 9.1.2 Number and average size of holdings 261
9.1.3 Holdings by size classes 262 9.1.4 Main crops area 1994 264 9.1.5 Yields of main crops 265
9.1.6 Livestock 267 9.1.7 Breeds of domestic animals at risk 269
9.2 Inputs 270 9.2.1 Consumption of commercial fertilizers 270
9.2.2 Fertilizer elements in farm manure 272
9.2.3 Consumption of pesticides 275
Notes 278
10. SECTORAL INDICATORS: FORESTRY 283
10.1 Forest resources 296 10.1.1 Distribution of wooded area 296
10.1.2 Wooded area by type of ownership 298 10.1.3 Distribution of tree species on high forests 299 10.1.4 Standing volume and net annual increment 300
10.1.5 Roundwood production 301 10.1.6 Roundwood supply balance sheet 302
10.1.7 Results of forestry measures on agricultural holdings 305
10.2 Forest damage 306 10.2.1 Defoliation of all species by classes, 1995 306
10.2.2 Defoliation (classes 2-4) 307
10.2.3 Forest fires 308
Notes 309
11. NATURE AND WILDLIFE 313
11.1 Biodiversity 327 11.1.1 State of mammals, birds and fish 327
11.1.2 State of reptiles, amphibians and invertebrates 328 11.1.3 State of vascular plants, mosses, lichens, fungi and algae 329
11.2 Protected areas 330 11.2.1 Major protected areas by IUCN category, 1993 330
11.3 Trade 331 11.3.1 Trade in tropical hardwoods 331
11.3.2 Trade in raw furskins of wild felines 332 11.3.3 Trade in tanned or dressed furskins of wild felines 333
Notes 334
12. ENVIRONMENTAL EXPENDITURE 339
12.1 Gross domestic product 352 12.1.1 Gross domestic product at market prices (constant 1990 prices) 352
12.2 Pollution abatement and control (PAC) expenditure 353 12.2.1 PAC expenditure as a percentage of GDP 353 12.2.2 PAC investment expenditure as percentage of
Gross Fixed Capital Formation (GFCF) 354 12.2.3 Investment and current expenditure in the public sector 355
12.2.4 Investment and current expenditure in the business sector 356
Notes 359
13. PUBLIC OPINION 363
13.1 Trends in public opinion 367 13.1.1 Complaints about the local environment 367
13.1.2 Concerns about various threats to the national environment 369 13.1.3 Concerns about various threats to the world environment 371
13.2 Willingness to sacrifice 375
Notes 376
14. NUCLEAR ENERGY 377
14.1 Nuclear energy indicators 384 14.2 Nuclear power stations 386
14.2.1 Nuclear power stations 386 14.3 Production and disposal of radioactive wastes 393
14.3.1 Spent fuel arisings 393
Notes 394
ANNEX: ABBREVIATIONS AND SYMBOLS 398
TABLE OF GRAPHICS
Graphic 1.1 GDP at current prices per capita, 1995 3 Graphic 2.2.1 Land use by main category 1994 22 Graphic 3.2.1 Gross inland consumption per capita 53 Graphic 3.2.2 Gross inland consumption by fuel type 54 Graphic 3.3.1 Final energy consumption by sector 59 Graphic 3.3.2 Final energy consumption of industry 1994 60 Graphic 3.4.1 Net electricity generation by source of energy 65
Graphic 3.4.2 Electricity consumption by sector 66
Graphic 3.5.1 Energy intensity 67 Graphic 4.1.1 Total EU-emissions by sector 82
Graphic 4.1.2 Emissions per capita 82 Graphic 4.1.3 Total EU-emissions by fuel type 83
Graphic 4.1.4 Changes 1990- 1994 86 Graphic 8.1.1 Goods transport by transport mode 229
Graphic 8.1.2 Carbon dioxide emissions bytransport mode 234
Graphic 8.2.1 Cars per 1 000 inhabitants 237 Graphic 8.2.2 Road density: motorways 239 Graphic 8.3.1 Railway network density 245 Graphic 9.1.1 Average utilized agricultural area per holding, 1993 262
Graphic 9.1.2 Holdings by size classes 263 Graphic 9.2.1 Use of pesticides 1992 277 Graphic 12.2.1 Expenditure by environmental domain, 1994 357
Graphic 12.2.2 Capita! and operating expenditure by environmental domain, 1994 357
Graphic 12.2.3 Total direct employment in EU eco-industries, 1994 358 Graphic 12.2.4 Environmental expenditure for the key domains air, waste water, waste, noise 358
Graphic 13.1.1 Complaints about the local environment 372 Graphic 13.1.2 Concerns about various threats to the national environment 373
Graphic 13.1.3 Concerns about various threats to the world environment 374
Graphic 13.2.1 Sacrifices for the sake of the environment 375 Graphic 14.1.1 Nuclear energy as proportion of gross inland consumption 384
Graphic 14.1.2 Nuclear electricity as proportion of total electricity generation 385
TABLE OF MAPS
Map 2.1.1 Population growth 20 Map 2.1.2 Population density 21 Map 2.3.1 Urbanization 1981 - 1991 27 Map 3.2.1 Hard coal imports 55 Map 5.6.1 S02-emissions 148 Map 5.6.2 ΝΟχ-emissions 149 Map 5.6.3 NMVOC-emissions 150 Map 5.6.4 CHzj-emissions 151 Map 5.6.5 CO-emissions 152 Map 5.6.6 C02-emissions 153 Map 5.6.7 N20-emissions 154 Map 5.6.8 NH3-emissions 155 Map 9.2.1 Nitrogen balance 274 Map 10.1.1 Wooded area, as proportion of total area 297
Map 10.1.2 Annual removals 304 Map 14.2.1 Nuclear power stations by type 391
Map 14.2.2 Nuclear power stations by capacity 392
INTRODUCTION
Objectifs
Eurostat présente dans le cadre du thème Environnement la troisième édition de la publication Statistiques de l'environnement. Cette publication, qui paraît à intervalles réguliers, met à portée de la main des utilisateurs d'une manière systématique et standardisée un ensemble de statistiques régulières et officielles se rapportant directement aux actions de la Communauté sur l'environnement.
Cette publication contribue à satisfaire le besoin grandissant en informations environnementales qui est spécialement souligné dans le cadre du cinquième programme d'action de la Communauté Vers un développement soutenable; Programme Communautaire de Politique et d'Action pour l'Environnement et le Développement Durable et Respectueux de l'Environnement. Ce programme d'action met en oeuvre les objectifs du traité sur l'Union européenne (Maastricht, le 7.2.1992): la promotion d'une croissance durable et respectueuse de l'environnement, la réalisation d'un niveau de protection élevé, l'intégration des exigences en matière de protection de l'environnement dans les autres politiques et, sur le plan international, la promotion de mesures destinées à faire face aux problèmes régionaux ou planétaires de l'environnement.
Contenu
Les statistiques rassemblées ici doivent fournir:
• des indicateurs pour contrôler et vérifier les effets des mesures prévues dans le cadre de la politique environnementale de l'UE;
• des informations quantitatives facilitant l'élaboration de nouvelles mesures relevant des actions jugées prioritaires pour la politique de l'UE sur l'environnement;
• des informations nécessaires pour intégrer la dimension de l'environnement dans d'autres politiques de l'UE;
• des données de base nécessaires pour évaluer l'impact des projets publics et privés sur l'environnement.
Pratiquement toutes les données statistiques peuvent avoir un rapport avec l'environnement; c'est dans un but délibéré que l'on a choisi pour cette publication des séries statistiques qui satisfont aux critères suivants:
• rapport direct avec a politique existante de la Communauté sur l'environnement;
• rapport direct avec les domaines prioritaires de l'action future de la Communauté sur l'environnement;
• disponibilité de séries chronologiques étant donné que les indicateurs sur l'environnement ne peuvent être fréquemment interprétés qu'en termes de tendances sur de longues périodes;
• indicateurs de base tels que population, superficie agricole et produit intérieure brut qui sont utilisés dans la présentation de toutes les statistiques sur l'environnement;
• conformité avec les nomenclatures et la méthodologie statistique standard.
Sources et remerciements
Eurostat est une Direction générale de la Commission des communautés européennes, en charge du système d'information statistique communautaire. Les statistiques publiées dans la présente publication sont le produit d'une collaboration avec les services statistiques des Etats membres, d'autres services de la Commission, l'Agence européenne de l'environnement et des organisations internationales statistiques. Eurostat travaille notamment en étroite collaboration avec la Direction générale de la Commission "Environnement, sécurité
Γ37Ά
nucléaire et protection civile" (DG XI). Pour la collecte et le traitement des données d'un intérêt international, Eurostat coopère étroitement avec l'Organisation de coopération et de développement économiques (OCDE), dans le but d'obtenir des données sélectionnées à l'aide d'un questionnaire commun adressé aux Etats membres. Dans la mesure du possible, la nomenclature et les méthodes utilisées pour la collecte et la publication des statistiques sur l'environnement sont conformes aux standards et concepts internationaux établis en commun par Eurostat, l'OCDE et par la Commission économique pour l'Europe des Nations unies (CEE/NU). De plus en plus, Eurostat collabore aussi avec l'Agence européenne de l'environnement (AEE) pour élaborer des méthodologies destinées à améliorer les données sur l'environnement. Cette collaboration vise aussi à faciliter l'échange des données contenues dans leur publications que Environment dans l'Union européenne
1995.
Eurostat tient à adresser ses remerciements pour ces différentes collaborations sans lesquelles cette publication n'aurait pu être élaborée.
Du nouveau dans cette édition
La troisième édition a été élargie comparée aux éditions précédentes par l'insertion de beaucoup de nouvelles séries:
• dépenses environnementales (nouveau chapitre) • énergie nucléaire (nouveau chapitre)
• émissions de méthane • qualité des eaux de baignade • ressources forestières • pesticides
• transport aérien
Des graphiques et des cartes sont utilisés plus intensivement pour attirer l'attention sur les caractéristiques intéressantes des données.
Dans la mesure du possible, les tableaux comprennent des longues séries pour les 15 Etats membres de l'Union européenne, y compris l'Autriche, la Finlande et la Suède qui ont rejoint l'UE le 1.1.1995. Dans certains cas il n'a pas été possible de fournir des séries complètes pour les nouveaux Etats membres.
On notera que dans les séries pour l'Allemagne, il y a normalement une rupture de série correspondant à l'unification le 3.10.1990. Cela affecte également les séries EUR 12 et EUR 15.
Le texte dans cette édition a été complètement mis à jour et comprend maintenant plus d'informations méthodologiques, suivant en cela une démarche déjà utilisée pour la publication de 1995: Europe's Environment: Statistical Compendium for the Dobfis Assessment (compendium qui accompagne le rapport sur l'état paneuropéen de l'environnement: Europe's Environment: The Dobfis Assessment, publiée par ΓΑΕΕ).
Cette publication est toujours en développement et sera complétée dans le futur au fur et à mesure de l'avancement des travaux d'Eurostat, des services statistiques des Etats membres et des organisations statistiques internationales sur l'harmonisation des concepts et des méthodes, la validation des données et l'intégration des problèmes de l'environnement dans l'appareil des statistiques socio-économiques. La restriction aux données disponibles pour l'ensemble des Etats membres et sur de longues périodes a limité le choix et montre les lacunes et l'immense effort encore à accomplir dans l'établissement d'un système satisfaisant de statistiques officielles et régulières.
Luxembourg, 31 mars 1997
Eurostat, Direction F
Unité "Statistiques de l'environnement"
Documentation:
Direction générale Environnement, sécurité nucléaire et protection civile: Législation de la Communauté européenne sur l'environnement (Vol. 1-7)
Office des publications officielles des Communautés européennes. Luxembourg, 1992 Agence européenne de l'environnement:
Europe's Environment: The Dobfis Assessment.
Office des publications officielles des Communautés européennes. Luxembourg, 1995 Eurostat: Europe's Environment: Statistical Compendium for the Dobfis Assessment. Office des publications officielles des Communautés européennes. Luxembourg, 1995 L'environnement dans l'Union européenne -1995
Rapport en support à l'examen du cinquième Programme d'action pour l'environnement Préparé par l'Agence européenne de l'environnement en collaboration avec Eurostat Office des publications officielles des Communautés européennes. Luxembourg, 1995
Législation communautaire:
Directive du Conseil 85/337/CEE du 27 juin 1985, concernant l'évaluation des incidences de certains projets publics et privés sur l'environnement
Règlement du Conseil (CEE) 1210/90 relatif à la création de l'agence européenne pour l'environnement et du réseau européen d'information et d'observation pour l'environnement
Directive du Conseil 91/692/CEE, du 23 décembre 1991, visant à la standardisation et à la rationalisation des rapports relatifs à la mise en oeuvre de certaines directives concernant l'environnement
Traité sur l'Union Européenne du 7 février 1992
Règlement du Conseil (CEE) n° 1973/92, du 21 mai 1992, portant création d'un instrument financier pour l'environnement (Life)
Résolution du Conseil et des représentants des gouvernements des Etats membres, réunis au sein du Conseil, du 1er février 1993, concernant un programme communautaire de politique et d'action en matière d'environnement et de développement durable (Cinquième Programme d'action pour l'environnement) Décision du Conseil 94/808/CE, du 15 décembre 1994, portant adoption d'un programme de développement quadriennal (1994-1997) relatif à la composante environnementale des statistiques communautaires
Directive du Conseil 96/61/CE du 24 septembre 1996 relative à la prévention et à la réduction intégrées de la pollution
Toutes demandes concernant des données et des publications Data Shop Luxembourg
2, rue Jean Engling L-1466 LUXEMBOURG Téléphone: +352 4335 22 51 Fax: +352 4335 22 221
Email: [email protected]
Eurostat doivent être adressées à:
Une information générale sur Eurostat et l'Agence européenne de l'environnement est disponible sur internet:
http://europa.eu.int/eurostat.html http://www.eea.eu.int
Il est prévu à l'avenir d'améliorer la présente publication en y incluant d'autres données intéressantes et en utilisant de nouvelles méthodes de présentation. Les lecteurs sont invités à faire des commentaires et à les envoyer à:
John ALLEN
Eurostat - Statistiques de l'environnement L-2920 LUXEMBOURG
Téléphone: +352 4301 37291 ou 37286 Fax: +352 430137316
Email [email protected]
Autres publications sur l'environnement:
Compendium
1990 Statistiques de l'environnement 1989 1992 Statistiques de l'environnement 1991
Compendiums spéciaux
1995 Europe's environment: Statistical compendium for the Dobfis assessment (version anglaise seulement disponible)
Publications liées aux domaines spécifiques
1992 SERIEE (version préliminaire)
1994 SERIEE 1994 version (version française en préparation)
1994 Environmental protection expenditure: data collection methods in the public sector and industry (version anglaise seulement disponible)
1996 La répartition des apports d'azote dans l'agriculture
1996 Emissions de dioxide de carbone des combustibles fossiles 1985-1993 1997 Echanges de déchets à valeur commerciale de l'EUR 12 1988-1994
Statistiques en bref
1991 Matières premières et environnement
1995 Les transports routiers et l'environnement dans l'UE
1996 Transport routier et environnement — Aspects énergétiques et fiscaux 1996 Aperçu sur les données de pesticides dans l'UE
CONTENU
INTRODUCTION XXIII
1. INDICATEURS DE BASE 1
1.1 Indicateurs de base 3
2. POPULATION ET UTILISATION DES SOLS 5
2.1 Population 18 2.1.1 Population totale 18
2.1.2 Croissance démographique 19 2.1.3 Densité de population 19
2.2 Utilisation des sols 22 2.2.1 Utilisation des sols par catégorie principale 1994 22
2.2.2 Terres arables 23 2.2.3 Superficies toujours couvertes d'herbes 23
2.2.4 Cultures permanentes 24 2.2.5 Superficie agricole utilisée 24
2.2.6 Superficie boisée 25 2.2.7 Autre superficie 25 2.2.8 Terrains bâtis 26
2.3 Urbanisation 27
Notes 28
3. ENERGIE 31
3.1 Réserves énergétiques 46 3.1.1 Réserves énergétiques 46
3.2 Consommation intérieure brute 48 3.2.1 Consommation intérieure brute par type de combustible 48
3.3 Consommation finale énergétique 56 3.3.1 Consommation finale énergétique totale 56
3.3.2 Consommation finale énergétique de l'industrie 56 3.3.3 Consommation finale énergétique par type de combustible 57
3.4 Production et consommation d'électricité 61 3.4.1 Production nette d'électricité par source d'énergie 61
3.5 Données économiques 67
Notes 68
4. CHANGEMENT CLIMATIQUE MONDIAL 69
4.1 Emissions de dioxyde de carbone 82 4.1.1 Emissions par secteur 83 4.2 Production, commerce et consommation des CFC et des halons 87
4.2.1 CFC-11, 12 87 4.2.2 CFC-11, 12, 113, 114, 115 88
4.2.3 Halon-1211, 1301,2402 88
4.3 Méthane 89 4.3.1 Emissions totales anthropiques de méthane 89
Notes 90
5. POLLUTION DE L'AIR 91
5.1 Emissions d'oxydes de soufre 106
5.1.1 Total 106 5.1.2 Emissions par source 107
5.2 Emissions d'oxydes d'azote 112
5.2.1 Total 112 5.2.2 Emissions par source 113
5.3 Emissions de matières particulaires 118
5.3.1 Total 118 5.3.2 Emissions par source 119
5.4 Emissions de monoxyde de carbone 124
5.4.1 Total 124 5.4.2 Emissions par source 125
5.5 Emissions de composés organiques volatils 130
5.5.1 Total 130 5.5.2 Emissions par source 131
5.6 Inventaire CORINAIR 1990 136 5.6.1 Inventaire détaillé des émissions par source 136
5.6.2 Comparaison des émissions estimées, 1990 147
Notes 156
6. EAU 163
6.1 Ressources en eau 171 6.1.1 Moyenne annuelle à long terme 171
6.2 Prélèvements d'eau 172 6.2.1 Eau douce totale 172 6.2.2 Eau douce par source 173 6.2.3 Eau douce totale par activité principale, 1990 174
6.2.4 Eau douce souterraine par activité principale, 1990 175 6.2.5 Eau douce de surface par activité principale, 1990 176
6.3 Consommation d'eau 177 6.3.1 Service d'eau public 177
6.4 Eaux usées et boues résiduaires 178 6.4.1 Population desservie par un réseau d'égouts, 1990 178
6.4.2 Population desservie par des stations publiques de traitement des eaux usées 179
6.4.3 Stations municipales de traitement des eaux usées, 1990 180 6.4.4 Boues résiduaires produites par les stations publiques
de traitement des eaux usées, 1990 181
6.5 Qualité des eaux de baignade 182 6.5.1 Coliformes totaux 182
Notes 183
7. DECHETS 185
7.1 Production et traitement des déchets 199 7.1.1 Production de déchets par secteur 199 7.1.2 Production de déchets par flux sélectionnés 200
7.1.3 Installations de traitement et d'élimination des déchets 201
7.2 Déchets municipaux 202 7.2.1 Quantités totales 202 7.2.2 Quantités totales, par habitant 203
7.2.3 Composition 204 7.2.4 Traitement et élimination 205
7.3 Déchets industriels et dangereux 206 7.3.1 Production des déchets dangereux: catégories sélectionnées 206
7.3.2 Production, mouvements, traitements et élimination des déchets dangereux 207
7.4 Activités de recyclage des déchets 208 7.4.1 Taux de récupération 208
Notes 209
8. INDICATEURS SECTORIELS: TRANSPORT 217
8.1 Comparaison entre les modes 227 8.1.1 Transport des passagers sur le territoire national 227
8.1.2 Transport des marchandises par mode de transport 230 8.1.3 Transport du pétrole brut et des produits pétroliers par oléoduc 231
8.1.4 Consommation finale énergétique par mode de transport 232 8.1.5 Emissions de dioxyde de carbone par mode de transport 235
8.2 Transport routier 237 8.2.1 Parc de voitures particulières 237
8.2.2 Longueur du réseau routier 238
8.2.3 Trafic routier 240 8.2.4 Emissions de plomb provenant des véhicules à essence 241
8.2.5 Livraisons d'essence sans plomb 242 8.2.6 Différentiel fiscal entre essences au plomb et sans plomb 243
8.2.7 Prix du fuel (1 000 I) proportionnel au revenu net disponible 243
8.3 Trafic ferroviaire 244 8.3.1 Longueur des lignes exploitées en fin d'année 244
8.4 Transport aérien 246 8.4.1 Trafic aérien 246
Notes 247
9. INDICATEURS SECTORIELS: AGRICULTURE 251
9.1 Tendances générales 261 9.1.1 Production finale 261 9.1.2 Nombre et grandeur moyenne des exploitations 261
9.1.3 Exploitations par classes de grandeur 262
9.1.4 Cultures principales 1994 264 9.1.5 Rendements des cultures principales 265
9.1.6 Cheptel 267 9.1.7 Races d'animaux domestiques à risque 269
9.2 Input 270 9.2.1 Consommation d'engrais commerciaux 270
9.2.2 Eléments fertilisants dans les fumiers agricoles 272
9.2.3 Consommation de pesticides 275
Notes 278
10. INDICATEURS SECTORIELS: SYLVICULTURE 283
10.1 Ressources forestières 296 10.1.1 Répartition de la superficie boisée 296
10.1.2 Superficie boisée par type de propriété 298 10.1.3 Répartition des futaies selon les essences des arbres 299
10.1.4 Volume total sur pied et accroissement annuel net 300
10.1.5 Production de bois rond 301 10.1.6 Bilan d'approvisionnement de bois rond 302
10.1.7 Résultats des mesures forestières dans les exploitations agricoles 305
10.2 Détérioration des forêts 306 10.2.1 Défoliation de toutes les espèces parolasse, 1995 306
10.2.2 Défoliation (classes 2-4) 307 10.2.3 Incendies de forêts 308
Notes 309
11. FLORE ET FAUNE 313
11.1 Biodiversité 327 11.1.1 Etat des mammifères, des oiseaux et des poissons 327
11.1.2 Etat des reptiles, des amphibiens et des invertébrés 328 11.1.3 Etat des plantes vasculaires, mousses, lichens, champignons et algues 329
11.2 Zones protégées 330 11.2.1 Principales zones protégées par catégories UICN, 1993 330
11.3 Commerce 331 11.3.1 Commerce des bois durs tropicaux 331
11.3.2 Commerce des peaux de félins sauvages brutes 332 11.3.3 Commerce des peaux de félins sauvages traitées 333
Notes 334
12. DEPENSES ENVIRONNEMENTALES 339
12.1 Produit intérieur brut 352 12.1.1 Produit intérieur brut aux prix du marché (prix constants 1990) 352
12.2 Dépenses de lutte contre la pollution (LCP) 353 12.2.1 Dépenses LCP proportionnellement au PIB 353
12.2.2 Dépenses d'investissement LCP proportionnellement à la
formation brute de capital fixe (FBCF) 354 12.2.3 Investissement et dépenses courantes dans le secteur public 355
12.2.4 Investissement et dépenses courantes dans le secteur des entreprises 356
Notes 359
13. OPINION PUBLIQUE 363
13.1 Tendances de l'opinion publique 367 13.1.1 Plaintes à rencontre de l'environnement local 367
13.1.2 Inquiétudes envers diverses menaces pour l'environnement national 369 13.1.3 Inquiétudes envers diverses menaces pour l'environnement mondial 371
13.2 Acceptation de sacrifices 375
Notes 376
14. ENERGIE NUCLEAIRE 377
14.1 Indicateurs pour l'énergie nucléaire 384
14.2 Centrales nucléaires 386 14.2.1 Centrales nucléaires 386
14.3 Production et élimination des déchets radioactifs 393
14.3.1 Combustibles irradiés 393
Notes 394
ANNEXE: SIGNES ET ABREVIATIONS 401
LISTE DE GRAPHIQUES
GraphiqueGraphique Graphique Graphique Graphique Graphique Graphique Graphique Graphique Graphique Graphique Graphique Graphique Graphique Graphique Graphique Graphique Graphique Graphique Graphique Graphique Graphique Graphique Graphique Graphique
1.1 2.2.1 3.2.1 3.2.2 3.3.1 3.3.2 3.4.1 3.4.2 3.5.1 4.1.1 4.1.2 4.1.3 4.1.4 8.1.1 8.1.2 8.2.1 8.2.2 8.3.1 9.1.1 9.1.2
9.2.1
12.2.1 12.2.2 12.2.3 12.2.4
Graphique 13.1.1 Graphique 13.1.2 Graphique 13.1.3 Graphique 13.2.1 Graphique 14.1.1 Graphique 14.1.2
PIB aux prix courants par habitant, 1995 3 Utilisation des sols par catégorie principale 1994 22
Consommation intérieure brute par habitant 53 Consommation intérieure brute par type de combustible 54
Consommation finale énergétique par secteur 59 Consommation finale énergétique de l'industrie 1994 60 Production nette d'électricité par source d'énergie 65
Consommation d'électricité par secteur 66
Intensité énergétique 67 Emissions totales de l'UE par secteur 82
Emissions par habitant 82 Emissions totales de l'UE par type de combustible 83
Changements 1990- 1994 86 Transport des marchandises par mode de transport 229
Emissions de dioxyde de carbone par mode de transport 234
Voitures par 1 000 habitants 237 Densité routière: autoroutes 239 Densité du réseau ferroviaire 245 Moyenne de la superficie agricole utilisée par exploitation, 1993 262
Exploitations par classes de grandeur 263 Utilisation des pesticides 1992 277 Dépenses par domaine environnementale, 1994 357
Dépenses en capital et de fonctionnement par domaine environnementale, 1994 ...357
Emploi direct total dans les éco-industries de l'UE, 1994 358 Dépenses environnementales pour les domaines-clés air, eaux usées, déchets,
bruit 358 Plaintes à rencontre de l'environnement local 372
Inquiétudes envers diverses menaces pour l'environnement national 373 Inquiétudes envers diverses menaces pour l'environnement mondial 374
Sacrifices pour le bien-être de l'environnement 375 Energie nucléaire, proportionnellement à la consommation intérieure brute 384
Electricité nucléaire, proportionnellement à la production totale d'électricité 385
LISTE DE CARTES
CarteCarte Carte Carte Carte Carte Carte Carte Carte Carte Carte Carte Carte Carte Carte Carte Carte
2.1.1 2.1.2 2.3.1 3.2.1 5.6.1 5.6.2 5.6.3 5.6.4 5.6.5 5.6.6 5.6.7 5.6.8 9.2.1 10.1.1 10.1.2 14.2.1 14.2.2
Croissance démographique 20 Densité de population 21 Urbanisation 1981 -1991 27 Importations d'houille 55 Emissions de SO2 148
Emissions de NOx 149
Emissions de COV-NM 150 Emissions de CH4 151 Emissions de CO 152 Emissions de CO2 153 Emissions de N20 154 Emissions de NH3 155 Bilan d'azote 274 Superficie boisée, proportionnellement à la superficie totale 297
Quantités annuelles enlevées 304 Centrales nucléaires par type 391 Centrales nucléaires par capacité 392
XXXII Umweltstatistik 1996 — Environment statistics 1996 — Statistiques de l'environnement 1996