FACULTY OF ENGINEERING AND SURVEYING
DEVELOPMENT OF A RASPBERRY PI BASED, SDI-12
SENSOR ENVIRONMENTAL DATA LOGGER
A dissertation submitted by
Mr James Coppock
Dissertation submitted to the Faculty of Engineering and Surveying in partial
fulfilment of the requirements for the degree of
Bachelor of Engineering
(Electrical and Electronics)
i-
Abstract
SDI-12 is a powerful tool for sensor networking and environmental data acquisition (EDA). Sensory networks are employed by many commercial and non-commercial entities across a wide range of applications to achieve better outcomes for the environment, the investing parties or the wider community. Monitoring systems can reduce operation costs and improve quality of products or produce. Many applications for sensor networks are of ethical significance for example, applications related to sustainable living, education, scientific research and food production. Despite the potential benefits, whether people adopt a system is largely dependent on associated costs and complexity. Consequently an inexpensive, reliable and easy to use system is more likely to be adopted. The Raspberry Pi is a powerful and inexpensive computing platform for embedded projects which incorporates a 40 pin general purpose input output (GPIO) header for connecting to digital peripherals, which is used as the basis of this project.
The prototype SDI-12 logger software is written in C++ and uses an existing Arduino SDI12 C++ library that has been modified for use with the Raspberry Pi computer. The system is evaluated for its suitability as a simple easy to configure (plug-and-play) type logger.
ii-
University of Southern Queensland
Faculty of Health, Engineering and Sciences
ENG4111/ENG4112 Research Project
Limitations of Use
The Council of the University of Southern Queensland, its Faculty of Health, Engineering & Sciences, and the staff of the University of Southern Queensland, do not accept any responsibility for the truth, accuracy or completeness of material contained within or associated with this dissertation.
Persons using all or any part of this material do so at their own risk, and not at the risk of the Council of the University of Southern Queensland, its Faculty of Health, Engineering & Sciences or the staff of the University of Southern Queensland.
iii-
University of Southern Queensland
Faculty of Health, Engineering and Sciences
ENG4111/ENG4112 Research Project
Certification of Dissertation
I certify that the ideas, designs and experimental work, results, analyses and conclusions set out in this dissertation are entirely my own effort, except where otherwise indicated and acknowledged.
I further certify that the work is original and has not been previously submitted for assessment in any other course or institution, except where specifically stated.
James Coppock
Student Number: 0050067987
Signature
iv-
Acknowledgements
v-
Table of Contents
Abstract ... i
Limitations of Use
... ii
Certification of Dissertation
... iii
Acknowledgements ... iv
Table of Contents ... v
List of Figures ... ix
List of Tables ... xi
Abbreviations ... xii
Organisations Cited ... xiii
Chapter 1: Introduction ... 1
1.1 The Problem at Hand ... 1
1.2 Project Aim ... 3
1.3 Objectives ... 4
1.4: Assessment of Consequential Effects / Implications/ Ethics ... 4
1.5 Existing Solutions ... 6
1.5.1 Low Cost Raspberry Pi Based Monitoring Solutions ... 6
1.5.2 Low Cost SDI-12 Loggers ... 7
1.5.3 Building Management Systems ... 7
1.6 Potential Project Outcomes ... 8
1.7 Project Methodology ... 10
1.7.1 Research ... 10
1.7.2 Prototype Implementation ... 10
1.7.3 Software Development ... 11
1.7.4 Final Testing and Evaluating the System ... 12
Chapter 2: Background Information... 13
2.1 Review of Environmental Monitoring Systems ... 13
2.1.1 Overview of Environmental Sensors ... 13
vi-
2.1.3 Sensor Networks ... 14
Wired Networks Wireless Networks Hybrid Network 2.1.4 Distributed Measurement and Control – Towards Networked Smart Sensors ... 16
The Smart Sensor Interface Standard (IEEE1451) 2.2 Overview of SDI-12 ... 20
2.2.1 Introduction ... 20
2.2.2 Background ... 20
2.2.3 Electrical Interface ... 20
Line Definitions Electrical Specifications 2.2.4 Protocol ... 25
Baud Rate and Byte Frame Format SDI-12 Timing SDI-12 Commands and Responses Benefits in Using SDI-12 in Environmental Data Acquisition 2.3 The Raspberry Pi ... 28
2.3.1 Raspberry Pi’s Operating System ... 29
2.3.2 Raspberry Pi Hardware Specifications ... 29
Chapter 3: Hardware Implementation ... 32
3.1 Assessment of both the GPIO and UART Approaches to Implementing SDI-12 ... 32
3.1.1 GPIO ... 32
3.1.2 UART ... 33
3.1.3 Informing the Approach ... 33
3.1.4 Testing the GPIO Suitability ... 34
3.2 Component Selection and Implementation Considerations ... 36
3.2.1 74XX1T45 Series Chip ... 37
3.2.2 74XX240 Series Chip ... 38
3.3 Schematic of Prototype Implementation ... 39
vii-
Chapter 4: Software Development ... 43
4.1 The Arduino SDI-12 Library Implementation ... 43
4.1.1 Description of Modifications to SDI12.cpp ... 43
4.1.2 Description of the setState(state) Function in the SDI12 library for Defining Five Communication States ... 44
4.1.3 Waking Up and Talking To Sensors ... 47
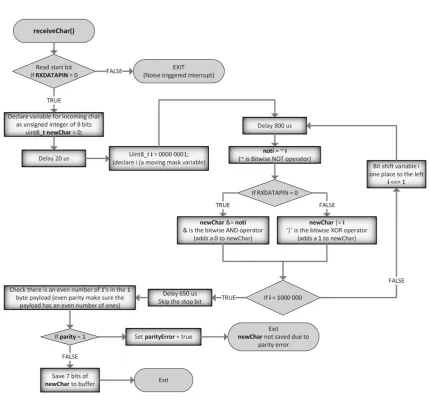
4.1.4 Interrupt Service Routine to Read Data into the Buffer ... 50
Overview of Raspberry Pi Interrupts receiveChar() 4.1.5 Checking for a Valid Response and Reading from the Buffer ... 54
4.2 Configuration File ... 56
4.2.1 Conceptual Design... 56
4.2.2 Specification for the Database of SDI-12 Sensors ... 58
4.2.3 Specification for the Configuration File ... 59
4.3 SDI-12 Logger Program ... 61
4.3.1 Broad Overview of Functions Called through the HMI ... 61
4.3.2 Organisation of SDI-12 Logger Program ... 63
4.3.3 Main ... 63
4.3.4 Measurement Handling Functions ... 64
4.3.5 Device Configuration Functions ... 69
4.3.6 Generic Functions ... 71
Chapter 5: Analysis and Performance ... 72
5.1 Analysis of SDI-12 Exchanges ... 72
5.1.1 Test Description ... 72
5.1.2 SDI-12 Data Line Waveform Analysis ... 73
5.1.3 Terminal Command Prompt Analysis ... 75
5.2 Testing of Raspberry Pi SDI12 Logger with Three Sensor Attached ... 78
Chapter 6: Conclusions and Further Work ... 81
6.1 Achievement of Project Objectives ... 81
6.2 Evaluation of the Logger ... 82
viii-
References ... 84
Appendix A: Project Specification ... 86
Appendix B: Project Management ... 88
Appendix B Contents ... 88
Appendix B.1: Risk Assessment ... 89
Appendix B.2: Resource Requirements... 91
Appendix B.3: Project Timeline ... 92
Appendix C: SDI12 C++ Library ... 94
Appendix C Contents ... 94
Appendix C.1: SDI12 Library Header File (SDI12.h) ... 95
Appendix C.2: SDI12.cpp ... 97
Appendix D: Complete SDI12 Logger Program Listing (Excluding SDI12 Library) ... 109
Appendix D Contents ... 109
Appendix D.1: Organisation and Description of SDI12 Logger Program ... 110
Appendix D.2: main() Function ... 113
Appendix D.3: Measurement Handling Functions ... 114
Appendix D.4: SDI-12 Device Configuration Functions ... 127
Appendix D.4.1 Main Configuration Handler Function ... 127
Appendix D.4.2: Add SDI-12 Device ... 129
Appendix D.5: Generic Functions ... 133
Appendix E: Flowcharts for SDI-12 Logger Functions ... 136
Appendix E Contents_Toc433562070 ... 136
Appendix E List of Figures ... 136
Appendix E.1: Flowchart for main() ... 137
Appendix E.2: Flowchart for dataFileHeadings() ... 138
Appendix E.3: Flowchart for measurementDelay() ... 139
Appendix E.4: Flowchart for takeMeasurment() ... 140
Appendix E.5: Flowchart for sendAndReceive() ... 141
ix-
List of Figures
Figure 1 Types of nodes in a sensor network (Bell 2013, p. 27) ... 15
Figure 2 Functional block diagram of IEEE 1451 (Wright & Dillon n.d. p2) ... 18
Figure 3 Overview of the STIM (IEEE Standards Board 1997) ... 19
Figure 4 Physical context of the SDI-12 interface ... 21
Figure 5 Recommended equivalent SDI-12 circuit (SD1-12 support group 2013, p. 4) ... 24
Figure 6 Decagon Devices’ low impedance equivalent SDI-12 circuit (Decagon Devices n.d., p. 2) ... 24
Figure 7 Example SDI-12 transmission of character 'a' ... 25
Figure 8 SDI-12 timing (SDI-12 support group 2013, p. 24) ... 26
Figure 9 Raspberry Pi Model A+ (Raspberry Pi Foundation 2015) ... 29
Figure 10 Raspberry Pi 2 Model B (Raspberry Pi Foundation 2015) ... 29
Figure 11 Raspberry Pi pinout (Raspberry Pi 2015) ... 31
Figure 12 Screen shot of the oscilloscope for a test where GPIO toggled at 600 Hz ... 36
Figure 13 Functional block diagram for the SN74LVC1T45 (Texas Instrument 2014) ... 37
Figure 14 Functional block diagram for a SN74HCT240 (Texas Instruments 2015) ... 38
Figure 15 Simplified circuit schematic ... 38
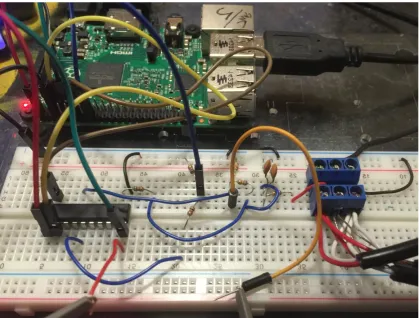
Figure 16 Schematic of prototype implementation ... 40
Figure 17 Schematic with comparator ... 40
Figure 18 Picture of prototype implementation ... 41
Figure 19 Waveform of TXDATAPIN voltage (yellow) and RXDATAPIN (blue) (see figure 16) .... 42
Figure 20 Waveform of TXDATAPIN voltage (yellow) and voltage at 2Y1 (blue) (see figure 16) 42 Figure 21 Waveform of TXDATAPIN voltage (yellow) and voltage at 1A1 (blue) (see figure 16) 42 Figure 22 Simplified schematic ... 45
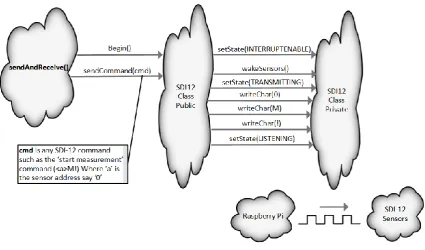
Figure 23 Inheritance diagram for waking up, and sending a command to a SDI-12 sensor ... 47
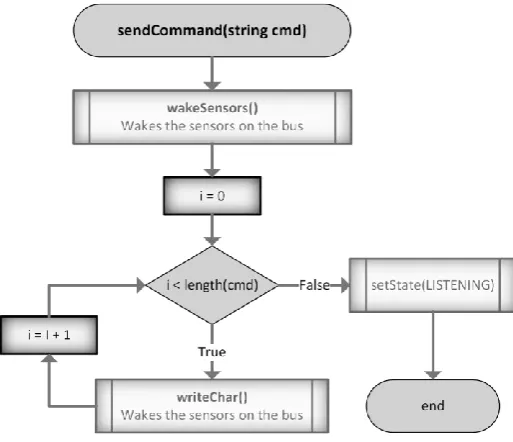
Figure 24 Flowchart for sendCommand() and wakeSensors() ... 48
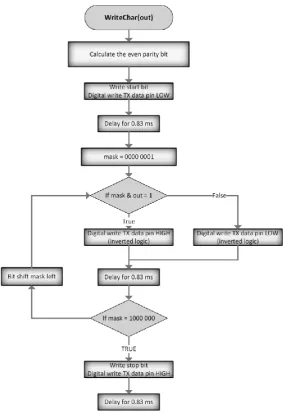
Figure 25 Flowchart representation of the writeChar function ... 50
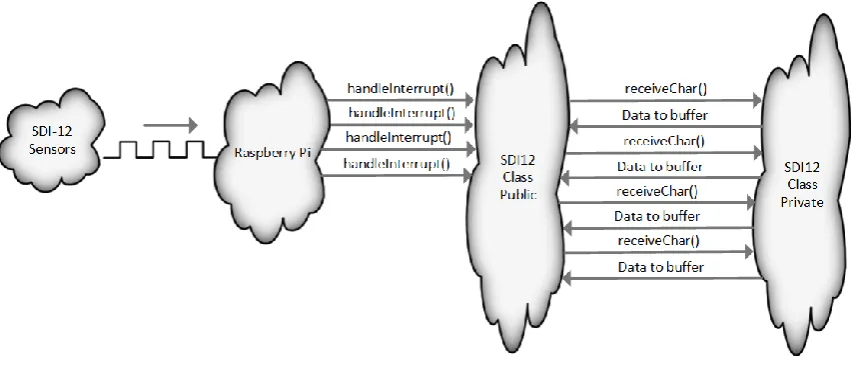
Figure 26 Inheritance diagram for reading data into the buffer ... 53
Figure 27 Flowchart representation of the receiveChar function ... 54
Figure 28 SDI12 functions for checking a valid response and reading from the buffer ... 55
x-
Figure 30 Flowchart of main() ... 64
Figure 31 Flowchart for SDI-12 logging (option 3 from ‘Main’ menu) and flow of external data ... 65
Figure 32 Flowchart for dataFileHeadings() ... 66
Figure 33 Flowchart for measurementDelay() ... 67
Figure 34 Data line waveform showing transmission of command ‘?!’ and sensor ... 73
Figure 35 Oscilloscope display capturing transmission of address query command (?!) ... 74
Figure 36 Oscilloscope display capturing sensor response to address query command (6<CR><LF>) ... 74
Figure 37 Data line waveform (yellow) and RXDATAPIN waveform (blue)... 74
Figure 38 Data line waveform (yellow) and RXDATAPIN waveform (blue) during sensor response ... 75
Figure 39 Plot of temperature data from 3 SDI-12 sensor... 78
Figure E.1 Flowchart for main() ... 137
Figure E.2 Flowchart for dataFileHeadings() ... 138
Figure E.3 Flowchart for measurementDelay() ... 139
Figure E.4 Flowchart for takeMeasurement() ... 140
Figure E.5 Flowchart for sendAndReceive() ... 141
xi-
List of Tables
Table 1: SDI-12 voltage thresholds (SDI-12 support group 2013, p. 3) ... 23
Table 2: SDI-12 Command set and response format (SDI-12 support group 2013, p. 8) ... 27
Table 3: Key for table 3 response characters ... 27
Table 4: GPIO pin voltage threshold ... 31
Table 5 Frequency of delays to 3 GPIO toggle frequencies for a set of minimum pulse width times. ... 35
Table 6: Minimum and maximum voltage levels for SN74LVC1T45 where, VCCA = 3-.3.6V and VCCB = 4.5 - 5.5 V ... 37
Table 7: Minimum and maximum voltage levels for SN74HCT240 – referenced to figure 15 ... 39
Table 8 Mode and logic level of Raspberry Pi pins ... 46
Table 9: Erroneous data recorded over 24 hour test period logging at 5 minute intervals ... 79
Table B.1: Risks in the development stage of the product ... 89
Table B.2: Risks to users of the Raspberry Pi-based SDI-12 logger ... 90
Table B.3a: Timeline (Semester 1) ... 92
xii-
Abbreviations
API: Application Programming Interface BMS: Building Management System CRC: Cyclic Redundancy Check
DMC: Distributed Measurement and Control EDA: Environmental Data Acquisition
EM: Environmental Monitoring EMS: Energy Management System GPIO: General Purpose Input Output HMI: Human Machine Interface I/O: Input/output
NCAP: Network Capable Application Processor OOP: Object Oriented Programming
OS: Operating System
SDI-12: Serial Digital Interface at 1200 baud STIM: Smart Transducer Interface Module TIM: Transducer Interface Modules
xiii-
Organisations Cited
Priva: A company who develop and manufacture building management solutions. OpenEnergyMonitor project: A group of developers building energy monitoring tools. YDOC: A manufacturer of low-power data acquisition systems suitable to monitor off-grid or hard to reach locations.
Decagon Devices: A manufacturer of sensors and data loggers.
Chapter 1: Introduction
1.1 The Problem at Hand
Individuals, small and large businesses enterprise, and governments have and continue to take from the environment without concern for, desire to address, resources to address or understanding of the long term impacts (MacKay 2008). The general public are not always prepared to invest resources (time and money) if there is no obvious return. Sensing networks have the potential to empower people to understand the environment. Simple control systems can be used to optimise the variables that have a direct impact on the environment. There are many sensing network implementations each with advantages and disadvantages for a specific application class. SDI-12 is a cost effective digital interface for EDA.
A broad range of industry applications are reliant on sensory networking, including; science/research, building management, quality control, waste management, various industrial settings, energy supply, public infrastructure, horticulture, agriculture, aviation, military, mining and boating industries. A Raspberry Pi based SDI-12 logger could be used within both well-established industry applications and by individuals or groups with non-profit applications that would benefit society as a whole. The networking capabilities of the Raspberry Pi increase the potential for use as a data logger.
In modern society, it is important for businesses who harvest raw materials and change the environment in some way, manufacturers of products or providers of services and individuals who use the products or services (who create demand) to understand their impact on the environment.
Sensory networks may be used to provide feedback to automate processes and to empower people with knowledge. The constraints in setting up a successful sensor network to monitor and or control the environment or a process include,
1) lack of user resources (e.g. time, budget and expertise)
The development of a monitoring product should address points 1 and 3. Point two is a consequential effect of lack of education.
A constraint in time resources includes the time required for a potential user to source a system that fits the requirement, time in learning the system capabilities, time to setup, install and test the system and time to process, analyse and use the data. Factors influencing the sale cost of a commercial logging package include the scale of manufacture, the market size and competition, the life-cycle management costs, the design features offered, product reliability etc. A cheap and powerful tool such as the Raspberry Pi can greatly reduce the associated life-cycle management costs. Lack of user expertise is not easily addressed in the development of a product which includes difficulties in data analysis, installation requirements and knowledge of sensors technologies (i.e. what technologies are available for any specific application and how it is integrated to an existing system).
Point three is the inherent complexity in providing flexibility i.e. mesh networking, or interfacing to the various wireless sensors with various different protocols, SDI-12 sensors and 4-20mA while keeping the system user friendly. An intuitive graphical user interface will ease the learning curve for computer based products. Point three requires sufficient research and development and good engineering design.
One example of a prime candidate for EDA are commercial greenhouses which are increasing in popularity across the world. Greenhouses allow for greater control over the growing environment of plants and can thereby improve food production in marginal environments. The fact greenhouses are producing more of our food is a direct consequence of a rapidly expanding food demand and change in food eating habits. Blush Greenhouse in Guyra covers an area of 20 hectares and greenhouses around the world are reported to be larger than this. Growers typically monitor soil moisture, electrical conductivity, air humidity, temperature and control the climate through an automatic climate control. System maintainers need flexibility in terms of power and communication between logger and sensors. Sensors need to be moved seasonally and for other reasons.
Personal experience in providing support for environmental monitoring products has found that acceptance of a technology is partially dependent on design that is intuitive and simple to setup, install and configure. It is also important to address practical application issues, such as; minimising wiring and other hardware (sensor network hardware) and maximising the network coverage in built-up and open environments.
1.2 Project Aim
1.3 Objectives
The project will be conducted in the following stages.
Stage 1. Review of environmental monitoring and broad context.
The dissertation investigates the environmental monitoring industry and technologies specifically focusing on the constraints to implementing flexible sensory networks such as; sensing requirements, installation requirements, interfacing hardware, communication channel mediums, communication protocols, environmental influences on communications, and emerging standards.
Stage 2. Conceptual design.
Review of SDI-12 protocol specification, the Raspberry Pi capabilities and programming languages.
Stage 3. Development and Test.
Design and build a hardware interface to implement the SDI-12 protocol. Test.
Design and code software modules for the SDI-12 protocol interface and data logger.
Specify a configuration file format and data storage plan.
Develop a basic HMI for the data logging system.
1.4: Assessment of Consequential Effects / Implications/
Ethics
As the designer of a product, consideration must be given to the direct and indirect impact it has on the environment, the user and the general public. Scheiber (2001) reports the purpose of manufacturing is to provide:
The most products
At the lowest possible cost
In the shortest time
At the highest possible quality
The chief environmental concerns related to the electronic manufacturing industry include the use of energy (electricity), water and nasty chemicals that need to be disposed of particularly in the process of manufacturing microchips and printed circuit boards. A typical facility producing semiconductor wafers reportedly uses 240 000 kilowatt hours of electricity and over 7.5 million litres of water a day. The disposal of the electronics products is inherently difficult because they are not easily disassembled and contain toxic materials (lead for example) resulting in large amounts of waste that cannot be recycled. Sustainability of the industry is a concern due to the risk in polluting the environment.
The software is intended to be distributed for free without any hardware. The Raspberry Pi is purchased by a customer as a circuit board with no enclosure. Third-party enclosures developed specifically for the Raspberry Pi are available but an extensive search has not revealed a water proof model. Water proof enclosures not specifically for the Pi are available in all shapes and sizes that comply with standards such as IP64 and higher but the customer would need to mount the Raspberry Pi and cut holes for cables.
As the hardware is third-party and with no intension to sell with software, it is easy to disregard the consequential effects related to its manufacture. The positive implications of using a cheap, off the shelf third party computer platform is significant in terms of initial development costs and overall reduces the life cycle management cost related to;
Product development
Manufacturing
Test
Service
Field returns
The company’s “image of quality”
outdoor settings or humid environments. In designing of a water proof enclosure, pressure differences between the inside and outside of the enclosure due to rapid changes in temperature need to be considered. Pressure difference can draw water inside the unit. A short-lived computer that is continually replaced will have an impact on the environment.
Quality research and development will ensure a product lasts for a long time and is competitive. Part of research and development is testing of individual modules under a range of conditions to identify problems. The statistics on the failure rate of the Raspberry Pi is not likely to be available or accurate as the customer may not claim the warranty due to its low cost. An electronics product should be tested for a range of external influencing variables including temperature extremes, temperature cycling, vibrations, water ingress and more.
1.5 Existing Solutions
The consumer is demanding devices, and systems with better capabilities and high levels of functionality. Existing monitor solutions, hardware and applications are considered.
1.5.1 Low Cost Raspberry Pi Based Monitoring Solutions
the state of pins to be checked through simple terminal commands (Henderson 2015). This program simplifies experimenting with hardware.
The OpenEnergyMonitor project have developed open-source tools for energy monitoring and analysis. It is a project aimed at empowering people to monitor energy use (OpenEnergyMonitor 2015). The OpenEnergyMonitor tools are based on both the Arduino and Raspberry Pi and designed to be a cost effective solution for monitoring energy use. The main monitoring system consists of sensors connected to an Arduino. Data is transmitted to a Raspberry Pi wirelessly (using the RFM69CW module) and this information is then stored locally or remotely for viewing and analysis. It is designed to be easily configured using only supported systems and supported sensors although anyone can freely use and modify the software as it is open-source. The system is not currently capable of outputting control signals.
Although it is possible to build the system using an Arduino, a Raspberry Pi and the available online resources this would not be typical. The consumer kits which are ready to go preinstalled with software and include a protection case and other electronic hardware are reasonably priced. The logger base (EmonPi) is $350 and the wireless sensing node is $150 excluding sensors. It would be better for a consumer to have freedom of choice as to what sensors could be interfaced, and allow some level of control. It does not allow SDI-12 sensors but offers flexibility in monitoring of indoor environments.
1.5.2 Low Cost SDI-12 Loggers
A search of the internet reveals a small number of low cost loggers capable of SDI-12. One of the better solutions is the ML-315 data logger manufactured by YDOC with the basic system costing about $550. Decagon Devices and Campbell Scientific also produce loggers with SDI-12 capabilities. Decagon Devices’ loggers are around $500 but are limited to a maximum of 5 sensors per logger and limited to decagon sensors only. Campbell Scientific offer more expensive solutions.
1.5.3 Building Management Systems
Optimise energy flows, and provide up-to-date energy use information
Allow you to monitor and manage the indoor climate, energy, lighting, fire, security, and other comfort controls.
Automate processes.
On 23 April 2015, Mr J van Loon, provided me with information about the Priva BMS systems. He indicates that Priva are able to provide solutions to automate processes in buildings. He says the Priva BMS solutions have analogue 0-5 volt inputs for connecting analogue sensors. The Priva BMS is capable of logging the input signals. Priva provide software for configuring control systems and data viewing remotely. The Priva BMS is a full feature solution but not aimed at domestic home owners as the solutions are expensive and more robust then needed in domestic installations. He said that there is potential for using an intermediate control system between the Priva hardware interface and sensors to make use of smart sensors.
1.6 Potential Project Outcomes
The benefit of a Raspberry Pi based logger over some of the commercial solutions include its small physical form (it’s about the size of a credit card), the Linux operating system and the software available for it including development environments, the general purpose inputs/outputs (GPIO), its network capabilities and its low cost which can potentially be leveraged by the consumer or a business providing monitoring solutions or solutions to address unique requirements such as automation. The top of the line Raspberry Pi computer is available internationally for $35 US + shipping + local taxes and is sold through distributors all over the world (Raspberry Pi 2015). A consumer kit could be developed to save the consumer some work and sold for a small profit. The basic system may not need to be sold and a business could be based on creating solutions to specific applications and unique requirements such as automation. A simple base design with software modularity will allow easy modification of the software to suit any particular application.
the environment for comfort and optimisation and many more. Certain small and large business enterprise will also benefit greatly from low cost solutions. Use of low cost third party hardware will reduce the manufacturing and testing costs. The lifecycle management of the Raspberry Pi based system is also simplified and less costly (see section: Assessment of Consequential Effects / Implications / Ethics).
SDI-12 is good choice in applications where many smart sensors need to be connected to a single input (Decagon Devices 2015). It is a cost effective way to read data from many sensors. It simplifies the programming and hardware requirements of the logger. SDI-12 sensors can measure multiple parameters and return the values in engineered units. SDI-12 sensor are often produced to return multiple parameter measurements. The complete range of SDI-12 sensors produced by Decagon Devices return between 3 and 6 parameters per sensor. An example sensor is the Decagon GS3 which measures soil dielectric permittivity (unit: e), temperature (unit: ℃) and electrical conductivity (unit: dS/m). Smart sensors that take multiple parameter measurements are particularly cost effective if all multiple parameters are needed.
Bus based systems allow some flexibility required in the applications areas mentioned but there are some shortcomings in practical applications that could be addressed to increase the flexibility and thus acceptance and popularity of the bus based monitoring and SDI-12. A hybrid wireless SDI-12 host-to-SDI-12 bus is a potential product to address the unique requirements in field monitoring applications such as large greenhouses where sensors need to be moved, keeping cables out of the way, fitting systems within the environment and sending data over long distances. This could be implemented in a variety of environments to utilise the strengths of both wired and wireless systems. An extensive search does not find an existing SD1-12 host and slave wireless hybrid adaptions. Bus based system are suited to indoor and industrial environments. A well designed digital electrical interface should be very immune to noise that exists within building.
1.7 Project Methodology
This project is underpinned by an experimental methodology. The three key stages of the project include conceptual design, development and testing of software and hardware. The software will be developed iteratively with a series of experiments that develop an expanding body of knowledge. The software is implemented in C++ and consists of; specifying a configuration file format and modification of C++ Arduino SDI-12 library. The configuration of the logger channels, and initiating measurements is done through a command line based human machine interface (HMI).
1.7.1 Research
The research part of the methodology is as follows:
Research the hardware capabilities of the Raspberry Pi GPIO pins including the driving and loading limits.
Assess both the UART and GPIO pin approach to SDI-12 asynchronous serial communication. Look for existing accounts where the GPIO of a Raspberry Pi is used to communicate serial data. Inform an approach based on the difficulty and other advantages and disadvantages identified.
Review of SDI-12 protocol specifications and capabilities.
o Assess the robustness of the SDI-12 protocol in terms of not error detection. o Calculate the bus impedances and find the driving and loading limits.
o Identify the commands that will be issued
o Assess the format of a sensor response to each command that will be issued.
Review literature on C++ and also for developing applications for the Raspberry Pi.
1.7.2 Prototype Implementation
Hardware is required to translate from Raspberry Pi TTL logic to the SDI-12 data line voltage levels (0-5.5 V). Prototyping will also involve testing and experimenting with manipulating the GPIO pins. The prototype part of the methodology is as follows:
Experiment with the Raspberry Pi GPIO pins and confirm the informed approach to SDI-12 asynchronous communication is possible.
o Investigate the operating system scheduling interruption frequency and period that the interruption lasts. Write a test program to toggle 1’s and 0’s and analyse the output using an oscilloscope set to trigger for pulses that are greater than a set period. If the interruption are severe the UART approach may be more suitable.
o Investigate and experiment with the Raspberry Pi interrupts.
Investigate hardware options for performing bi-directional communication and level shifting from 3.3 volts to 5 volts and from 5 volts to 3.3 volts.
Design hardware and implement using a breadboard.
Test hardware. Develop test software which writes toggles a digital HIGH and LOW to a GPIO pins and analyse the signal using an oscilloscope. Connect any hardware and test at the output. Load the hardware and retest.
1.7.3 Software Development
With no previous C/C++ programming experience knowledge will be gained through analysing existing code, experimentation and testing. Face-to-face mentoring is suggested to be a good way to learn how to program (Agile manifesto 2015). It would be more effective learning to code through experienced software developers at work or practical based training programs. The program will be written in C++ using the Geany development environment for Linux which is installed on the Raspberry Pi. Skills in programming can be developed by writing small test programs. Individual parts of the C++ code will be tested with a range of input conditions to ensure each section will work as intended.
Design and code software modules for the SDI-12 protocol interface and data logger. o Assess the logical sequences for SDI-12 exchanges, and identify an approach
to:
Setting states of the GPIO pins for transmitting and listening if this approach is used. Both GPIO and UART approach would be different.
Sending commands. (A command is a string of ASCII characters. Each ASCII character is sent in a frame with 7 data bits, 1 parity bit, a start and stop bit)
Receiving ASCII characters
o SDI-12 devices do not return extensive information about themselves in response to the identification command so a user will have to manually configure the SDI-12 channel by giving it a name, unit, and specifying which result from that sensor corresponds to it. This information will be stored for each logger channel in the configuration file.
o Research how to read and write from a file.
o Identify a sequence of configuration file entries that will allow the logger to perform a measurement from each configured sensor address and return the parameter(s) to its corresponding channel.
Develop a main program and command line based HMI for configuring the data logger. o Use the SDI-12 functions to send the measurement commands to configured
sensors at measurement intervals and append data to the data file. o Allow basic configuration of sensors.
1.7.4 Final Testing and Evaluating the System
Test the logger with 3 SDI-12 sensors
o Manipulate the configuration file parameters to see that data is stored correctly.
Chapter 2: Background Information
The development process must give consideration to the various technologies, techniques and principles. The first section of this chapter gives background information on environmental monitoring systems. The second section of this chapter looks at SDI-12. The third section gives background information on the Raspberry Pi and an assessment of the GPIO driving capabilities.
2.1 Review of Environmental Monitoring Systems
Major factors that usually rule the development of Environmental Monitoring (EM) systems
are; energy efficiency, cost of the overall system, response time of the sensor module, good
accuracy of the system, adequate signal-to-noise ratio, radio frequency
interference/electro-magnetic interference (RFI/EMI) rejection during varying atmospheric conditions and in
inhomogeneous environments, a user friendly interface with the computer, and complexity
of computation (Kumar et al. 2013).
2.1.1 Overview of Environmental Sensors
SDI-12 was designed for environmental data acquisition (EDA) (SD1-12 support group 2015). Classification of sensors is conventionally by physical quantity being measured, the conversion principle, technology used, or by application (Sinclair 2001). Environmental monitoring sensors can also be classed according to broad physical characteristics of the environment it is measuring. A sensor can be discriminated as measuring either biotic or abiotic environmental quantities. Sensors measuring abiotic quantities can be further categorised according to the physical properties it is measuring for example soils, atmosphere, water and manmade environments or systems. I.e current through a wire conductor would be a manmade system. This is not a perfect organisation for example a temperature sensor can exist in all four categories. An abiotic environment may be related closely to a biotic environment so environmental sensor distributors may choose to separate sensors by application also.
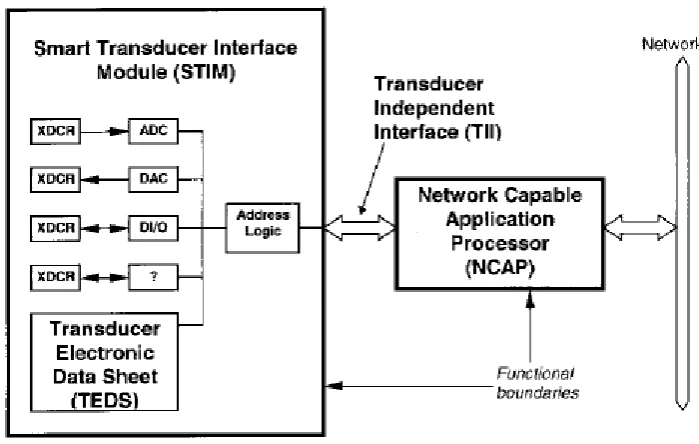
2.1.2 Smart Sensors
An analogue sensor is a transducer that detects a physical, biological, or chemical parameter and responds with an electrical signal. Electrical signals from a sensor may need to be conditioned in the sensor. Signal conditioning is a process involving filtering, amplification, compensation and normalisation. Further processing of the conditioned signal may take place in the data system such as adaptive noise cancelling, spectrum analysis or any other algorithm needed for a specific purpose (IEEE Standards Board 1997).
Sensors can integrate microprocessors, ADC’s and other electronics, which are getting smaller, cheaper and more powerful into the sensor to form a ‘smart’ sensor. A microprocessor in a sensor may calibrate the sensor, control the sensor measurement, control a process and measure the process variable(s) and convert raw sensor reading into engineering units (SD1-12 support group 2015). A smart sensor is able to communicate measurements directly to a data system. The smart sensor makes the job of the application engineer easier by shifting the task of designing the signal conditioning, and complex process control and measurement functions to the sensor manufacturer. A smart sensor is able to supply the analogue sensors with any specific power and voltage requirements using internal regulators that would otherwise be difficult to do with from the data node. Assuming the digital interface between smart sensor and the data system is well designed there should not be data corruption due to noise pick up. Furthermore, smart sensors can be networked.
2.1.3 Sensor Networks
Figure 1 Types of nodes in a sensor network (Bell 2013, p. 27)
Data is communicated between nodes either through a wired or wireless medium. Hybrid systems combine both wireless and wired technologies.
Wired Networks
Many implementations of wired networks are currently available. Digital sensor buses were developed mainly due to a need in the process and control industry to connect sensors and transducers directly to digital networks for factory automation and closed loop-control (Write and Dillon n.d.). Write and Dillon (n.d.) states the ‘large growth in slow speed sensors (for the measurement of temperature, pressure and position for example) contributed to the development of digital bus architectures such as Fieldbus, Profibus, LonWorks, and DeviceNet’. He said that, ‘these systems have drawbacks and problems like bandwidth limitations, proprietary hardware and the major design work needed to interface with existing sensors’. Other wired communication protocol implementations include TCP/IP, BASnet, Modbus and Ethernet. Wired systems in general have drawbacks relating to the need to purchase and route cables which add costs in installation, maintenance and upgrade.
Wireless Networks
Hybrid Network
Hybrid networks combine both wired and wireless medium. An example maybe an interface for SDI-12 logger-to-SDI-12 sensor/bus. The slave interface at the sensor site would power the sensors from an internal battery or external source and provide the SDI-12 protocol messaging and timing. The master interface can be powered from the host (logger). This would allow use of SDI-12 solutions for more widely distributed monitoring applications. An SDI-12 bus can be routed to a well position wireless SDI-12 slave module providing a lot of flexibility.
2.1.4 Distributed Measurement and Control – Towards
Networked Smart Sensors
Applications for control systems can take several forms. The most notable control environments are segregated (or individual), centralised, or distributed control (Lee & Schneeman 2000, p. 623). The segregated (or individual) control functions as a standalone system in a non-networked environment. An individual control node may control one or more processes which will be application specific. The centralised and distributed control forms function in Distributed Measurement and Control (DCM) environments. The centralised
control form is where a master controller directly controls slave nodes on a network. The process connection is thorough the slave nodes. The distributed control form is where sensor information is sent to a networked nodes through a controller gateway(s). A distributed
networked node is able to process information on the network and make a control decision. A distributed control networked node has distributed intelligence.
Further work outside the scope of this project involves the development of the Raspberry Pi logger to work as a node at the process control level in a DMC environment. The Suitability of the Raspberry Pi as a process control node of DMC environment will depend on measurement and control requirements, overall system frameworks and technologies used.
The Smart Sensor Interface Standard (IEEE1451)
The distributed measurement and control industry is migrating away from proprietary
hardware and software in favour of open source systems and standardised approaches (LEE
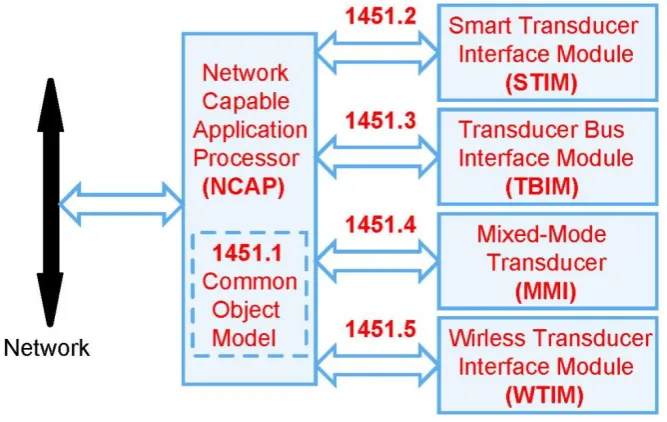
The ‘IEEE standard for smart sensor transducer interface for sensors and actuators’ (IEEE 1451), is a standard to define common interfaces for connecting transducers to microprocessor based systems, instruments and field networks.
IEEE Standards Board (1997, p. iii) states, the main objectives of the IEEE 1451.2 standard are to:
Enable plug and play at the transducer level by providing a common
communication interface for transducers.
Enable and simplify the criteria of networked smart transducers.
Facilitate support of multiple networks.
IEEE Standards Board (1997, p. iii) states: ‘The existing fragmented sensor market is seeking ways to build low-cost, networked smart sensors.’ There are many implementations of the control network each with its own strengths and weaknesses for a specific application class. IEEE Standards Board (1997, p. iii) reports that, ‘interfacing sensors to all the control networks and supporting a wide variety of protocols represents a significant and costly effort to transducer manufacturers’. Existing control networks include digital bus protocols such as Fieldbus, Profibus, LonWorks, Modbus and DeviceNet, TCP/IP, LonWorks, BASnet, Ethernet and many more. Wireless protocols used include WiFi, Bluetooth, ZigBee & XBee. The IEEE 1451 standard objective is to develop an interface standard that will ‘isolate the choice of transducer from the choice of networks’ (IEEE Standards Board 1997, piii).
Figure 2 Functional block diagram of IEEE 1451 (Wright & Dillon n.d. p2)
2.2 Overview of SDI-12
This section describes an interface between data loggers (data nodes) and microprocessor based sensors (sensor nodes).
2.2.1 Introduction
SDI-12 stands for Serial Digital Interface at 1200 baud. SDI-12 is a three wire serial digital interface providing a means for transferring measurements taken by an SDI-12 sensor to a data node for environmental data acquisition. The SDI-12 standard defines an electrical interface, protocols and timing (SD1-12 support group 2013). The protocol describes the normal data retrieval operation on the SDI-12 bus using a command set specified in the standard. SDI-12 sensors are an intelligent microprocessor based sensor which use SDI-12 to talk with data nodes. Only the data node can initiate communications. While all SDI-12 sensor must conform to the SDI-12 specification, it is not a plug and play type system. Detailed knowledge of the sensor such as the amount of data the sensor is returning and the order in which the data is returned is required to configure it.
2.2.2 Background
The SDI-12 protocol grew out of a need for a low power, standard serial interface for serial-data acquisitioning (SD1-12 support group 2015). The first version of SDI-12 specification was created in 1988 with input from a group of companies that were operating in the environmental monitoring industry but mostly written by Campbell Scientific. SDI-12 has been refined over the years but remains backward compatible with earlier versions. The SDI-12 support group maintains the SDI-12 standard (SD1-12 support group 2015).
2.2.3 Electrical Interface
Figure 4 Physical context of the SDI-12 interface
Each sensor on the multisensory bus has a unique address with a maximum of 62 addresses on the bus. SD1-12 support group (2013) specifies that an SDI-12 bus with 10 sensors would limit the maximum cable length per sensor to 60 meters but indicates that using fewer sensors means a longer length of cable per sensor is possible. This means that 10 SDI-12 sensors could be placed anywhere within a 60 meter radius of the data node if the cable goes directly between each sensor and the data node. Decagon Devices produce SDI-12 sensors with a ‘low impedance’ variant of the equivalent circuit recommended in the SDI-12 specification (Decagon Devices n.d.). Decagon Devices (n.d., p. 5) states that ‘this allows for up to 62 sensors to be connected onto the bus at one time instead of the 10 that is stated in the standard’. The recommended equivalent circuit and the Decagon Devices ‘low impedance’ variant are discussed in the serial data line section below. The complete range of Decagon Devices’ SDI-12 compatible sensors also specify a different logic HIGH requirement which also allows more SDI-12 sensors to be connected to the bus. The Decagon Devices SDI-12 sensor digital input variant is also discussed in the serial data line section below.
Line Definitions
The SDI-12 communication is done over a single data line. The 3 physical connection are,
1) 12-volt line 2) a ground line 3) a serial data line
12-Volt Line
a) The voltage on the 12-volt line shall be between 9.6 V and 16 V with respect to the ground line under maximum sensor load of 0.5 A.
b) The data node is expected to be able to supply a maximum sensor load power 0.5 amperes. The SDI-12 protocol initiates communication by waking all sensors on the SDI-12 bus therefore the 12 volt line must power all devices at once for a small period of time. While all devices do not take a measurement at this time or at once it is possible that the SDI-12 control circuit in the sensor (typically consisting of a micro-processor or FPGA) may need up to 50 mA, however, for low power sensors using low power 8 bit microprocessors it is likely to be less than 50 mA. The complete range of Decagon Devices’ SDI-12 compatible sensors (approximately 10 in total) require between 10 and 25 mA of current during a measurement and up to 0.3 mA quiescent (Decagon Devices 2015).
c) An SDI-12 sensor may use separate power supply as necessary.
Ground Line
a) The ground line must be connected to the data node circuit ground and an earth ground at the data node. The sensor circuit ground is connected to the ground line. The sensor circuit ground is usually isolated from ground (frame or earth). b) The ground line should be large enough so that a maximum voltage drop along
line between sensor and data node is 0.5V for combined sensor current drain.
Serial Data Line Logic Levels
Table 1: SDI-12 voltage thresholds (SDI-12 support group 2013, p. 3)
Condition Binary State Voltage range
marking 1 -0.5 to 1.0 volts
spacing 0 3.5 to 5.5 volts
conditioning undefined 1.0 to 3.5 volts
Drive and Loading
Figure 5 Recommended equivalent SDI-12 circuit (SD1-12 support group 2013, p. 4)
The Decagon Devices ‘low impedance’ variant on the recommended equivalent circuit is shown in figure 6. This circuit has a lower DC impedance in comparison to the DC impedance of the recommended circuit but a higher AC impedance at 1200 Hz. For a bus with 10 sensors connected the AC impedance seen by the transmitter is approximately 9.9kΩ∠-9°. When the transmitter is driving towards a HIGH state (5.5V) it must be capable of sourcing 540 μA, which is much less than required if sensor use the recommended equivalent circuit. The voltage on the data line with 10 low impedance variant SDI-12 sensors connected would be approximately 4.72 volts if driven at 1200 Hz. The capacitive reactance of the Decagon low impedance variant equivalent circuit is reduced and so current and voltage are almost in phase. This may increase the slew rate. The DC impedance seen by the transmitter is 10kΩ.
Figure 6 Decagon Devices’ low impedance equivalent SDI-12 circuit (Decagon Devices n.d., p. 2)
Voltage Transitions
2.2.4 Protocol
The SDI-12 communication is done over a single data line (the ‘serial data line’) via precisely-timed signal conditioning, resulting in an exchange of ASCII characters as defined by the standard. The SDI-12 protocol allows for a maximum of 62 sensors to be connected to the bus. Sensor measurements are triggered by protocol command. Communication is addressed specifically to each sensor. Each sensor requires a unique ASCII character address. The valid addresses are ASCII characters 0-9, a-z and A-Z giving a total of 62 unique addresses. To add more than one SDI-12 sensor to a system the address of each sensor should be changed while no other sensors are connected to the bus.
Baud Rate and Byte Frame Format
The SDI-12 protocol sends characters at 1200 baud. Each byte frame has 1 start bit, 7 data bits (LSB first), 1 parity bit (even parity) and 1 stop bit. For even parity, the number of bits whose value is 1 are counted. If that total is odd, the parity pit is set to 1, making the total count of 1's in the set an even number. If the count of 1's in a given set of bits is already even, the parity value remains 0. The SDI-12 protocol uses negative logic. An example of a transmission of character ‘a’ is shown in figure 7. The 7 bit binary code for ASCII character ‘a’ is 110 0001.
Figure 7 Example SDI-12 transmission of character 'a'
SDI-12 Timing
Figure 8 SDI-12 timing (SDI-12 support group 2013, p. 24)
The maximum time for a sensor response to all but the concurrent measurement is 380 ms. The SDI-12 interchanges follow the general pattern presented here:
1) The data node wakes all sensors by placing a break on the SDI-12 bus. ‘Break’ is the name of a command for a continuous spacing for at least 12 milliseconds. There is no upper limit on the break period. A sensor must wake within 100 ms after detecting the break.
2) The data node sets the data line to marking (logic LOW) for at least 8.33 ms. A sensor can go back to sleep after 100ms of marking so the upper limit on marking can be say 90ms.
3) The data node announces an SDI-12 command (see table 3) to a specific sensor and immediately waits for the reply.
4) If the addressed sensor is awake and has detected the command it will set the data line to marking for 8.33 ms immediately followed by the transmission of the command response. The response must begin within 15 ms of receiving the command stop bit of the last byte . If there are other sensors on the bus and detect an invalid address they must return to standby.
SDI-12 Commands and Responses
A subset of the SDI-12 commands and sensor responses are given in table 2. The commands listed in table 2 will be issued by the prototype Raspberry Pi logger which will allow automatic configuration of SDI-12 sensors and logging of configured sensors. The first character of all command issued by a data logger and the first character in the sensor response is the sensor address. The last character of every command is always an exclamation mark (!). The final characters of all sensor responses are carriage return and line feed (<CR><LF>). Sensor that comply with the latest standard have a variant command that includes a three character CRC with the response. These variants may be implemented in the future.
Table 2: SDI-12 Command set and response format (SDI-12 support group 2013, p. 8)
Command Name Command String Response
Address Query ?! a<CR><LF>
Send Identification aI! allccccccccmmmmmmvvvxxxxxxxxxxxxx<CR><LF> Send Data aD0-9! a<value(s)<CR><LF>
Start Measurement aM! atttn<CR><LF>
Table 3: Key for table 3 response characters
Key Meaning
a Address
I SDI-12 version number
c 8-character vendor identification
m 6-characters indicating sensor model number n Number of data values being returned
t Time in seconds until data will be ready (when service request should be issued) v 3-character sensor version number
<value(s)> pd.d
P – polarity sign
d- numeric digits before the decimal place . – decimal point (optional)
Benefits in Using SDI-12 in Environmental Data Acquisition
Using SDI-12 provides considerable benefits, which include plug-and-play modularity, availability of a growing number of SDI-12 sensors, one data logger port for connecting different sensors and the benefits of smart sensors as outlined in the section ‘Smart Sensors’. In essence using SDI-12 will simplify the process of installing and configuring sensors. Using SDI-12 sensor nodes simplifies the hardware requirements of the data node as the measurement channels and signal conditioning is part of the sensor. SDI-12 sensors may control a complex process and measure the process variable(s) which are used to determine the desired quantity. An example of this might be measuring the sap flow in a tree using the heat ratio method. Heat is input via a probe and the upstream and downstream temperature is recorded over time from which sap flow can be calculated. Assuming the SDI-12 digital interface is well designed there should not be data corruption due to noise pick up. The disadvantage to SDI-12 is the more sensors you have on a bus the more difficult it will be to isolate a faulty sensor and restore the sensor network.
2.3 The Raspberry Pi
2.3.1 Raspberry Pi’s Operating System
The Raspbian operating system (a Linux distribution) is not a real time system and any thread can be interrupted by the OS. While it is possible to code a bare metal version of logging firmware for the Raspberry Pi that would be strictly real-time it would require a lot of development. The Raspberry Pi kernel has useful features to manage a program (or thread) that can be leveraged to interface with the outside world. The Linux kernel allows an interrupt to be detected on any GPIO input as a rising or falling edge transition and the main program can continue to run while waiting for an interrupt.
2.3.2 Raspberry Pi Hardware Specifications
The Raspberry Pi has most on board devices found on a typical personal computer, including; HDMI port, USB ports, micro SD Card port, and an Ethernet port. It is a small but capable computer. The Model A+ is less suitable for use as a logger as it does not include an Ethernet port and is thus not considered as an alternative. The Specification for the Raspberry Pi 2 Model B are highlighted here.
Broadcom BCM2836 - System on Chip (SoC) (CPU, GPU, DSP, SDRAM, 1 USB port)
The Raspberry Pi is based on the Broadcom BCM2836 SoC, which was designed for multimedia processing applications (Raspberry Pi 2015). The Raspberry Pi 2’s CPU is a 900 MHz quad-core ARM Cortec-A7. It has 1 GB SDRAM RAM which it shares with the GPU.
Figure 10 Raspberry Pi 2 Model B (Raspberry Pi Foundation 2015)
Dimensions
The Raspberry Pi is 85.6 mm x 56.5 mm (about the size of a credit card).
Ethernet Port
The Raspberry Pi’s network readiness maybe leveraged to make use of existing internet hardware to get information to a BMS interface. The Raspberry Pi can be connected into a Router or Network switch. A USB Wi-Fi transmitter device can be connected as an alternative way of connecting it to the internet.
Power Supply Requirements
The Raspberry Pi is powered through the micro USB-type B port. It requires a supply of 5 volt. The current drawn by the Raspberry Pi depends on what is connected to it therefore it is recommended that a PSU is current limited. It is recommended that the Raspberry Pi 2 is supplied using a power supply unit with a capacity of 1.8 A (Raspberry Pi 2015). Without any peripherals (bare-board) the active current consumption is up to 500 mA. The maximum total USB peripheral current draw is 600 mA. The maximum current that can be supplied through the 5V GPIO power pin safely is 1.3 Amps (1.8 A – 0.5 A) without any other peripherals connect i.e. monitor, keyboard, mouse etc. A powered USB hub can be connected to the Pi USB hub when required.
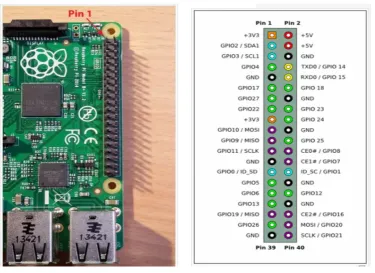
General Purpose Input Output (GPIO) Pins
Figure 11 Raspberry Pi pinout (Raspberry Pi 2015)
[image:45.595.126.502.71.344.2]The GPIO pin voltage thresholds are given in table 4. The GPIO when set as an input can be configured as a Schmitt trigger, with input hysteresis. With hysteresis there are different threshold voltages for rising and falling transition but these are not actually specified by in the Broadcom BCM2835-ARM-Peripherials datasheet (Broadcom 2012).
Table 4: GPIO pin voltage threshold
Output LOW voltage (VOL) < 0.7 V Output HIGH voltage (VOH) > 2.6 V Input LOW voltage (VIL) < 0.8 V - > 0 V Input HIGH voltage (VIH) > 2.0 V - < 3.3 V
RTC
Chapter 3: Hardware Implementation
This chapter outlines the design process for the SDI-12 electrical interface. The first section of this chapter looks at two different approaches to the implementing SDI-12 and informs an approach based on the advantages and disadvantages of both. The second section of this chapter investigates hardware options for level shifting the SDI-12 exchanges. The third section presents the schematic and the fourth and final section of the chapter outlines a series of functional test and results.
3.1 Assessment of both the GPIO and UART Approaches to
Implementing SDI-12
SDI-12 communications relies on precise signal conditioning resulting in an exchange of ASCII characters in frames with 7 data bits, 1 parity bit, a start bit and a stop bit at 1200 Baud. Two possible approaches to interface the Raspberry Pi to SDI-12 sensors are, 1) the GPIO pins 2) the UART. In both approaches hardware is required to level shift between the Raspberry Pi TTL logic and the SDI-12 voltage levels.
3.1.1 GPIO
Henderson (2015) reports that the Raspberry Pi 2 is capable of toggling a GPIO pin 0 and 1 at a frequency of 9.6 MHz using his wiringPi C/C++ library functions (with no overclocking). By setting a delay period after each transition a GPIO pin is capable of transmitting and receiving serial data at 1200 baud. The major disadvantage of this approach is the possibility of un-reliable data exchanges due to the Raspbian operating system sharing system resources with other threads which may result in intermittent read and write control.
will result in a different combination of the 3, 4 or 5 characters. When considering a command that is 3 ASCII characters (excluding the address) such as the measurement commands, there will be three 10 bit frames or a total of 30 bits resulting in 232 possible bit combinations. With only 20 valid bit combinations the likelihood of receiving an incorrect command is small. Additionally, the parity bit and stop bit must also be valid.
The inherent risk in receiving the incorrect sensor response is greater as the response length is variable (up to 35 characters (350 bits)) and only the first 10 bits and the last 20 bits of the response are known. All frames of a sensor response must have a valid start and stop bit. Certain commands including the send measurement command can also request a 3 character CRC code which will provide assurance the data is valid. Only sensors compliant with the latest SDI-12 specification version 1.3 (2013) implement the CRC feature.
The advantage of the GPIO pin approach over the UART approach is that multiple SDI-12 buses are possible, i.e. as many as there are GPIO pins available on the Raspberry Pi.
3.1.2 UART
The Raspberry Pi has one externally accessible Universal Asynchronous Receiver/Transmitter (UART) on pins BCM14 (TXD) and BCM15 (RXD) that is capable of performing SDI-12 exchanges with additional hardware. The UART sends and receives serial data and performs timing and parity checking. The UART transmits and receives one bit at a time at a specific rate using hardware such as bit shift registers that get timing from the system clock. The UART approach is inherently safer than the GPIO approach.
A consideration for implementing the UART approach is that the idle state of the UART is a logic HIGH whereas the idle state of the SDI-12 bus is a logic LOW (Broadcom 2012). This will not be a significant problem as the hardware required to level shift the incoming and outgoing signals can also invert the signals.
3.1.3 Informing the Approach
time constraints and unknown work load. The unanswered problems to address for the UART approach are:
1) How to send a wake sensors command (12 ms break (logic HIGH) and 8.33 ms marking (logic LOW)). The break is longer than a 10 bit frame (8.33 ms). It would not be possible to send a break using the UART TX unless it is possible to disable the stop bit generation at the end of the frame (logic low).
2) How to level shift between the Raspberry Pi UART TX pin to the SDI-12 voltage levels. Any hardware used to level shift and drive the SDI-12 bus must be capable of being put into a high impedance state when the SDI-12 logger is listening for a response from a sensor on a bi-directional line. As the UART is somewhat automatic it may be a challenge to know exactly when the UART starts and finishes sending a command to the sensor. If the time the transmission finishes is known, the driver can be put into a high impedance state.
3.1.4 Testing the GPIO Suitability
Before proceeding with the GPIO approach experimentation is undertaken to detect the nature of the interruptions. The test aims to approximate the frequency of the interruptions and the length of time the interruptions last. The piHiPri() function from the wiringPi library is tested also. piHiPri() is a function that sets the priority of a process anywhere from low (1) to high (99).
positive or negative pulse width that is greater than α, the actual number of interruptions for each test should be interpreted as double the value given in table 5.
Table 5 Frequency of delays to 3 GPIO toggle frequencies for a set of minimum pulse width times.
α
(a positive pulse width greater than α will re-trigger the oscilloscope)
Test conditions
– demand placed on the CPU
Test 1 - toggle at 9 MHz (no delay)
Test 2 - toggle at 2.5 kHz (200μs
delay)
Test 3 - toggle at 600 Hz (830μs
delay) Low Priority (1) High Priority (99) Low Priority (1) High Priority (99) Low Priority (1) High Priority (99)
> 50 μs High
Demand
> 1000 > 500 - - - -
> 100 μs High
Demand
> 1000 > 100 - - - -
> 200 μs High
Demand
> 1000 3 - - - -
> 500 μs High
Demand
> 50 0 > 500 > 100 - -
> 500 μs Minimal
Demand
1 0 > 100 0 - -
> 1 ms
(1.25 bts at 1200 baud)
High Demand
> 40 2 > 500 > 35 > 1000 120
> 1 ms
(1.25 bits at 1200 baud)
Minimal Demand
0 0 27 0 80 0
> 1.26 ms
(1.5 bits at 1200 baud)
High Demand
40 0 > 500 0 > 500 60
> 1.26 ms
(1.5 bits at 1200 baud)
Minimal Demand
0 0 20 0 70 0
> 1.66 ms
(2 bits at 1200 baud)
High Demand
30 0 > 500 0 > 500 20
> 1.66 ms
(2 bits at 1200 baud)
Minimal Demand
1 0 50 0 60 0
> 2.49 ms
( 3 bits at 1200 baud)
High Demand
24 0 > 350 0 > 500 0
> 2.49 ms
(= 3 bits at 1200 baud)
Minimal Demand
2 0 23 0 30 0
interruptions than the case of maximum toggle frequency with similar priority. The results show significant interruptions for test 3 with high priority that last 1.66 ms (equal to double the toggle delay) when there is high demand. This is an indication that the GPIO approach may fail if there is a high demand on the CPU, however if the SDI-12 exchange failed the command would be re-issued. Figure 12 shows a screenshot from the oscilloscope for the test where the GPIO is toggled at 600 Hz. The oscilloscope has captured a positive pulse width of 2.08 ms which was a result of the operating system de-scheduling the process momentarily.
Figure 12 Screen shot of the oscilloscope for a test where GPIO toggled at 600 Hz
3.2 Component Selection and Implementation
Considerations
3.2.1 74XX1T45 Series Chip
The 74XX1T45 series chips are a single-bit dual supply bus transceiver with configurable voltage translation and 3-state outputs (it is not available in a dual inline package for breadboard prototype). Figure 13 shows a functional block diagram for the SN74LVC1T45. Texas Instruments (2014) states the ‘logic levels of the direction-control (DIR) input activate either the B-port outputs or the A-port outputs. The device transmits data from the A bus to the B bus when the B-port outputs are activated and from the B bus to the A bus when the A-port outputs are activated.’ The high voltage level at each A-port is dependent on the supply voltage VCCA or VCCB. VCCA and VCCB accept any voltage from 1.65 V to 5.5 V.
Figure 13 Functional block diagram for the SN74LVC1T45 (Texas Instrument 2014)
Table 6 shows minimum and maximum expected voltage levels for two supply voltages that would allow exchanges between the Raspberry Pi and SDI-12 sensors. In this case port A is connected to the Raspberry Pi and port B is connected to the SDI-12 bus. The voltage levels in table 6 are for when port A supply voltage (VCCA) is between 3 and 3.6 V and port B (VCCB) is between 4.5 and 5.5 V.
Table 6: Minimum and maximum voltage levels for SN74LVC1T45 where, VCCA = 3-.3.6V and VCCB = 4.5 - 5.5 V Port A connected to
RPi data pin. (RPi logic HIGH voltage is: 3.3 V)
Port B connected to SDI-12 bus. (Max Logic HIGH SDI-12 voltage is: 5.5V)
Min Max Min Max
VIH 2 V 5.5 V 3.15 V 5.5 V
VIL 0 V 0.8 V 0 V 1.65 V
VOH
(IOH = -24 mA)
2.4 V 3.3 V 4.2 V 5.5 V
VOL
(IOH = 24 mA)
3.2.2 74XX240 Series Chip
The 74XX240 chips are an octal buffer and line driver with 3-state outputs available in a PDIP-20 package. Figure 14 shows a function block diagram. Texas Instruments (PDIP-2003) states; ‘the 74HCT240 devices are organized as two 4-bit buffers/drivers with separate output-enable (𝑂𝐸̅̅̅̅) inputs. When 𝑂𝐸̅̅̅̅ is low, the SN74HCT240 passes inverted data from the A inputs to the Y outputs’. When 𝑂𝐸̅̅̅̅ is high, the outputs are in the high-impedance state.
Figure 14 Functional block diagram for a SN74HCT240 (Texas Instruments 2015)
Figure 15 shows a simplified circuit diagram to implement the 74XX240 series chip. Additional components are required if this chip is used.
Figure 15 Simplified circuit schematic
Table 7: Minimum and maximum voltage levels for SN74HCT240 – referenced to