eurostat
■■
ELEKTRIZITATSPREISE
ELECTRICITY PRICES
PRIX DE L'ÉLECTRICITÉ
1985-1991
/
eurostat
STATISTISCHES AMT DER EUROPÄISCHEN GEMEINSCHAFTEN STATISTICAL OFFICE OF THE EUROPEAN COMMUNITIES OFFICE STATISTIQUE DES COMMUNAUTÉS EUROPÉENNES
L-2920 Luxembourg - Tél. 43 01-1 - Télex: Comeur Lu 3423
B-1049 Bruxelles, bâtiment Berlaymont, rue de la Loi 200 (bureau de liaison) — Tél. 235 1 1 1 1
Eurostat hat die Aufgabe, den Informa-tionsbedarf der Kommission und aller am Aufbau des Binnenmarktes Beteilig-ten mit Hilfe des europäischen statisti-schen Systems zu decken.
Um der Öffentlichkeit die große Menge an verfügbaren Daten zugänglich zu machen und Benutzern die Orientierung zu erleichtern, werden zwei Arten von Publikationen angeboten: Statistische Dokumente und Veröffentlichungen. Statistische Dokumente sind für den Fachmann konzipiert und enthalten das ausführliche Datenmaterial: Bezugsda-ten, bei denen die Konzepte allgemein bekannt, standardisiert und wissen-schaftlich fundiert sind. Diese Daten werden in einer sehr tiefen Gliederung dargeboten. Die Statistischen Doku-mente wenden sich an Fachleute, die in der Lage sind, selbständig die benötig-ten Dabenötig-ten aus der Fülle des dargebote-nen Materials auszuwählen. Diese Daten sind in gedruckter Form und/oder auf Diskette, Magnetband, CD-ROM verfüg-bar. Statistische Dokumente unterschei-den sich auch optisch von anderen Veröffentlichungen durch den mit einer stilisierten Graphik versehenen weißen Einband.
Die zweite Publikationsart, die Veröffent-lichungen, wenden sich an eine ganz bestimmte Zielgruppe, wie zum Beispiel an den Bildungsbereich oder an Ent-scheidungsträger in Politik und Verwal-tung. Sie enthalten ausgewählte und auf die Bedürfnisse einer Zielgruppe abge-stellte und kommentierte Informationen. Eurostat übernimmt hier also eine Art Beraterrolle.
Für einen breiteren Benutzerkreis gibt Eurostat Jahrbücher und periodische Veröffentlichungen heraus. Diese
enthal-It is Eurostat's responsibility to use the European statistical system to meet the requirements of the Commission and all parties involved in the development of the single market.
To ensure that the vast quantity of accessible data is made widely avail-able, and to help each user make proper use of this information, Eurostat has set up two main categories of document: statistical documents and publications. The statistical document is aimed at specialists and provides the most com-plete sets of data: reference data where the methodology is well established, standardized, uniform and scientific. These data are presented in great detail. The statistical document is intended for experts who are capable of using their own means to seek out what they re-quire. The information is provided on paper and/or on diskette, magnetic tape, CD-ROM. The white cover sheet bears a stylized motif which distinguishes the statistical document from other publica-tions.
The publications proper tend to be com-piled for a well-defined and targeted public, such as educational circles or politicai and administrative decision-makers. The information in these docu-ments is selected, sorted and annotated to suit the target public. In this instance, therefore, Eurostat works in an advisory capacity.
Where the readership is wider and less well defined, Eurostat provides the infor-' mation required for an initial analysis,
such as yearbooks and periodicals which contain data permitting more in-depth studies. These publications are available on paper or in Videotext data-bases.
Pour établir, évaluer ou apprécier les différentes politiques communautaires, la Commission des Communautés euro-péennes a besoin d'informations. Eurostat a pour mission, à travers le système statistique européen, de répon-dre aux besoins de la Commission et de l'ensemble des personnes impliquées dans le développement du marché unique.
Pour mettre à la disposition de tous l'importante quantité de données acces-sibles et faire en sorte que chacun puisse s'orienter correctement dans cet ensemble, deux grandes catégories de documents ont été créées: les docu-ments statistiques et les publications. Le document statistique s'adresse aux spécialistes. Il fournit les données les plus complètes: données de référence où la méthodologie est bien connue, standardisée, normalisée et scientifique. Ces données sont présentées à un niveau très détaillé. Le document statis-tique est destiné aux experts capables de rechercher, par leurs propres moyens, les données requises. Les informations sont alors disponibles sur papier et/ou sur disquette, bande magnétique, CD-ROM. La couverture blanche ornée d'un graphisme stylisé démarque le document statistique des autres publications.
ELEKTRIZITATSPREISE
ELECTRICITY PRICES
PRIX DE L'ÉLECTRICITÉ
Bibliographische Daten befinden sich am Ende der Veröffentlichung Cataloguing data can be found at the end of this publication Une fiche bibliographique figure à la fin de l'ouvrage
Manuskript abgeschlossen im Juni 1991 Manuscript completed in June 1991 Manuscrit achevé en juin 1991
Für alle Informationen über diese Veröffentlichung wenden Sie sich bitte an :
For all information concerning this publication, contact :
Pour toute information concernant cette publication, s'adresser à : EUROSTAT, Tel.: Luxembourg 43011 ext. 2565 ou 4919
Nachdruck - ausgenommen zu kommerziellen Zwecken - mit Quellenangabe gestattet
Reproduction is authorised, except for commercial purposes provided the source is mentioned
Reproduction autorisée, sauf à des fins commerciales, moyennant mention de la source
INHALT / CONTENTS / SOMMAIRE
I. EINLEITUNG 7 INTRODUCTION 27 INTRODUCTION 47
II. BEDINGUNGEN UND METHODEN 9 CONDITIONS AND METHODS 29. CONDITIONS ET METHODES 49
III. WERTEINHEITEN 17 UNITS OF VALUE 37 UNITES DE VALEUR 57
IV. STEUERLICHE BELASTUNG 21
TAXES 41 FISCALITE 61
V. ELEKTRIZITÄTSPREISE IN NATIONALER WÄHRUNG, ECU und KKS NACH LÄNDERN ELECTRICITY PRICES IN NATIONAL CURRENCIES, ECU and PPS BY COUNTRY PRIX DE L'ELECTRICITE EN MONNAIES NATIONALES, ECU et SPA PAR PAYS 1. Haushalte / Households / Usages domestiques
Deutschland - Frankfurt/M 74
Deutschland - Stuttgart 75
Deutschland - München 76
Deutschland - Südliches Gebiet 77
Ellas - Athinai 78
España - Madrid 79
France - Paris 80
France - Lille 81
France - Strasbourg 82
France - Lyon 83
France - Marseille 84
France - Toulouse 85
Ireland - Dublin 86
Italia - Settentrionale e centrale 87
Italia - Meridionale e Insulare 88
G. D. Luxembourg - Luxembourg 89
Nederland - Rotterdam 90
Nederland - Noord Holland 91
Nederland - Noord Brabant 92
Portugal - Lisboa 93
United Kingdom - London 94
United-Kingdom - Leeds 95
Danmark - Nord Sjælland luz
Deutschland - Düsseldorf 104
Deutschland - Hamburg 106
Deutschland - Hannover 108
Deutschland - Westliches Gebiet 110
Deutschland - Frankfurt/M 112
Deutschland - Stuttgart 114
Deutschland - München 116
Deutschland - Südliches Gebiet 118
Ellas - Athinai 120
España - Madrid 122
France - Paris 124
France - Lille 126
France - Strasbourg 128
France - Lyon 130
Ireland - Dublin 132
Italia - Settentrionale e Centrale 134
Italia - Meridionale e Insulare 136
G.D. Luxembourg - Luxembourg 50% 138
G.D. Luxembourg - Luxembourg 0% 140
G.D. Luxembourg - Luxembourg 100% 142
Nederland - Rotterdam 142
Nederland - Noord Holland 144
Nederland - Noord Brabant 146
Portugal - Lisboa 148
United Kingdom - London 150
United-Kingdom - Birmingham 156
United-Kingdom - Glasgow 158
VI. ZWISCHENSTAATLICHER VERGLEICH / COMMUNITY COMPARISON / COMPARAISON COMMUNAUTAIRE
Tabelle für die Umrechnung der ECU,des KKS, Verbrauchpreiseindizes und Preisindizes des PIB
Conversion factors for ECU, PPS, consumer price indices and GDP price indices
Table de conversion ECU, SPA, indice des prix à la consommation
et du PIB 161
Zusammenfassung der Haushalte in Landeswährung /kWh Recapitulation of households in national currency /kWh
Récapitulatif en monnaies nationales pour usages domestiques
/kWh 163
Haushalte / Households / Usages domestiques ECU/100 kWh 164
Haushalte, preisbereinigt KKS/lOO kWh Households deflated PPS/100 kWh
Usages domestiques SPA déflatés/100 kWh 165
Zusammenfassung der Industrie in Landeswährung /kWh Recapitulation of industry in national currency /kWh
Récapitulatif en monnaies nationales pour usages industriels
/kWh 166
Industrie / Industry / usages industriels ECU/100 kWh 167
Industrie, preisbereinigt KKS/100 kWh Industry deflated PPS/100 kWh
EINLEITUNG
Die vorliegende Veröffentlichung enthält die neuesten, 1991 geltenden Preise sowie Preise für 1985 und ab 1988.
Es wurden dieselben Definitionen und Methoden wie in früheren Studien verwendet, so daß die Entwicklung der Elektrizitätspreise über eine längere Zeitreihe verfolgt werden kann.
In anderen Veröffentlichungen derselben Reihe werden zusätzlich zu den in diesem Band enthaltenen Preisangaben die Struktur der Elektrizitätsindustrie nach Ländern beschrieben, die angewandten Tarife behandelt und die Ergebnisse analysiert.
Diese Studie zeigt für die 3 betreffenden Preisniveaus, die Preise im Landeswährung, in Ecus (mittlerer Wert für Januar) und in KKS
(jährlicher Wert, geschätzt für 1991 (stand: 10.Juni 1991).
Die vorliegende Veröffentlichung ist in drei Sprachen (Englisch, Französisch und Deutsch) verfügbar.
ZEICHEN UND ABKÜRZUNGEN
- / Nichts
Kein Nachweis vorhanden
% Prozent
0 jährlicher durchschnittlicher prozentualer Anstieg
V Volt
kV Kilovolt (= 1 000 V)
kVA Kilovoltampere
kW Kilowatt
h Stunde
kWh Kilowattstunde
GWh Gigawattstunde (10° kWh)
n Anzahl
BFR Belgischer Franc
DKR ere Dänische Krone, ere - 1/100 DKR
DM pf Deutsche Mark, Pfennig = 1/100 DM
DRA Griechische Drachme
PTA Spanische Peseta
FF cent. Französischer Franc, Centimes
IR£ ρ Irisches Pfund, Pence = 1/100 IRE
LIT Italienische Lira
LFR Luxemburger Franc
HFL cent Holländischer Gulden, Cents
ESC Portugiesischer Eskudo
UK£ ρ Pfund Sterling, Pence = 1/100 UK£
KKS Kaufkraftstandard
ECU Europäische Währungseinheit
EUR 12 Gesamtheit der Mitgliedsländer der Europäischen
Gemeinschaften
II. BEDINGUNGEN UND METHODEN
1. ERFASSUNGSBEREICH
Die vorliegende Untersuchung bezweckt die Erfassung der tatsächlichen Preise für Elektrizität, die von den Verbrauchern in den Mitgliedstaaten der Europäischen Gemeinschaft gezahlt werden.
Die Preise werden zu Beginn jedes Jahres erhoben; sie ergeben sich aus dert zu Beginn des Jahres geltenden Tarifen, Verträgen, Bedingungen und Vorschriften. Es handelt sich um die von dem Verbraucher von Elektrizität gezahlten tatsächlichen Preise, die der Rechnungsstellung einschließlich etwaiger Rabatte franco Verbraucher zu Beginn jedes Jahres entsprechen. Unter Verbraucher sind hier die Abnehmer zu verstehen, die die Elektrizität für ihren eigenen Verbrauch beziehen, wodurch die Wiederverkäufer ausgeschlossen sind. Infolgedessen sind nicht die Eingangspreise in das Elektrizitätsverteilungsnetz erhoben worden.
Was die Verbraucher betrifft, so bezweckt die Untersuchung, den gesamten von der öffentlichen Elektrizitätsversorgung mit Nieder-, Mittel- und Hochspannung belieferten Abnehmerkreis zu erfassen. Um die Darstellung zu vereinfachen, werden die Verbraucher in zwei Gruppen, und zwar Haushalte und Industrie, unterteilt.
Ausgenommen von der Erhebung sind jedoch die Industrieabnehmer:
1) die einen Teil der von ihnen benötigten Elektrizität selbst erzeugen (Eigenerzeuger);
2) die Elektrizität wegen der außergewöhnlichen Bedingungen ihres Leistungsbedarfs und Verbrauchs nach einer besonderen Vertragsregelung beziehen.
Diese Ausnahmen betreffen vor allem die Großunternehmen der Eisen- und Stahlindustrie sowie der Chemie, die Gewinnung von Aluminium und anderen Metallen durch Elektrolyse, aber auch die Eisenbahn, die öffentliche Beleuchtung usw.
Die genannten Unternehmen weisen meistens einen Verbrauch von mehr als 24 000 000 kWh im Jahr auf. Obwohl ihre Zahl gering ist, verbrauchen sie doch einen erheblichen Teil der zur Verteilung gelangenden elektrischen Energie.
Für die Auswahl der Plätze waren mehrere Kriterien maßgebend: Bevölkerungszahl, wirtschaftliche Bedeutung, unterschiedliche Tarifzonen, geographisch ausgewogene Erfassung eines Staates sowie Harmonisierung mit den für die Preisstatistik anderer Energieträger, insbesondere für die Gaspreise, benutzten Plätze.
Die Preise werden an folgenden Plätzen erhoben:
- Belgien
- Dänemark
- BR Deutschland
- Griechenland
- Spanien
- Frankreich
- Irland
- Italien
Belgien (landeseinheitlicher Tarif)
Kopenhagen (KB), Nord-Seeland (NESA)
Hamburg, Hannover, Düsseldorf, Frankfurt/Main, Stuttgart, München, Westliches Gebiet, Südliches Gebiet
Athen (landeseinheitlicher Tarif)
Madrid (landeseinheitlicher Tarif)
Lille, Paris, Marseille, Lyon, Toulouse, Straßburg
Dublin
Nord- und Mittelitalien, Süditalien und italienische Inseln
- Großherzogtum Luxemburg: Großherzogtum (CEGEDEL)
Niederlande
Portugal
Rotterdam (GEB), Nord-Holland (PEN), Nord-Brabant (PNEM)
Lissabon (landeseinheitlicher Tarif)
- Vereinigtes Königreich : London, Glasgow, Leeds, Birmingham
Einige der ausgewählten Plätze sind für mehr oder weniger umfangreiche Gebiete repräsentativ.
2. VERBRAUCHER-TYPEN
Da
Db
Dc
Dd
DP
600
1 200
3 500
7 500
20 000
-(1 300)
(2 500)
(15 000)
3
3 - 4
4 - 9
6 - 9
9
Fünf Verbraucher-Typen für den Haushalt (Versorgung in Niederspannung) mit den Kodes D bis D wurden gewählt:
Jahresverbrauch kWh Bestellte
Ver- - Leistung Wohnungstyp braucher Insgesamt (darunter (Richtwert)
-Typen Nachtstrom) in kW
o
50m Zwei Zimmer + Küche o
70m Drei Zimmer + Küche 2
90m Vier Zimmer + Küche
100m2 Vier bis fünf Zimmer + K. o
120m Fünf Zimmer + Küche
Die Verbraucher-Typen verfügen über folgenden Richtbestand an elektrischen Geräten :
D : Beleuchtung, Rundfunk, Fernsehen, Kühlschrank, elektrische Kleingeräte; (z.B. Staubsauger, Brotröster, Haartrockner, Mixgerät, Kaffeemühle usw.)
Di : Gerätebestand D + Waschmaschine oder Geschirrspüler
D ,DJ : Gerätebestand Di mit Waschmaschine und Spülmaschine + Heißwasserbereiter mit Speicher
D : Sogenannter "vollelektrischer" Gerätebestand mit elektrischer Hei-ßwasserbereitung und Heizung auf Speicherbasis.
Sieben Verbraucher-Typen der Industrie (siehe Punkt 4 für die Lieferspannung) mit den Kodes I bis I wurden gewählt :
Verbraucher-Typen Jahresverbrauch kWh Maximaler Lei-stungsbedarf kW (Höchstlast)
Jahresnutzungs-dauer (Stunden)
(1)
Ia 30 000 30 1 000
Ib 50 000 50 1 000
Ic 160 000 100 1 600
Id 1 250 000 500 2 500
Ie 2 000 000 500 4 000
If 10 000 000 2 500 4 000
I 24 000 000 4 000 6 000
o
Der maximale Leistungsbedarf ist die in Kilowatt (kW) ausgedrückte, und im Zeitraum eines Jahres viertelstündig gemessene Höchstlast.
Der Preis gilt für COS Φ - 0,90.
Die jährliche Nutzungsdauer bestimmt die Regelmäßigkeit, mit der elektrische Energie von dem Verbraucher im Laufe des Jahres aus dem Netz entnommen wird. Je höher die Dauer ist, um so mehr verteilt sich der Verbrauch regelmäßig auf die 8 760 Stunden des Jahres. Sie gibt die Zahl der Stunden an, in denen der Verbraucher seinen Jahresverbrauch bei ständiger Inanspruchnahme der seiner Höchstlast entsprechenden Leistung erreichen könnte.
In einigen Fällen sind für die Anwendung der Tarife folgende zusätzliche Angaben erforderlich :
- Im Falle eines Tarifs, der sich auf die halbstündig gemessene Leistung stützt, wird die Höchstlast des Verbraucher-Typs mit dem Faktor 0,98 multipliziert ;
- im Falle eines Tarifs, der sich auf eine in kVA gemessene Leistung stützt, erfolgt die Berichtigung, indem die in kW ausgedrückte Höchstlast des Verbraucher-Typs durch den Koeffizienten cos ^ : 0,90 dividiert wird;
- stützt sich die Tarifgestaltung auf Messungen der Leistungsmaxima während eines kürzeren Zeitraums als einem Jahr, so wird der Betrag des Leistungspreises durch Multiplikation mit folgenden Faktoren berichtigt :
Tabelle zur Berichtigung der Belastungswerte
Verbraucher-Typen 1& Ib Ic I¿ Ie If I
Jahresbenutzungsdauer :
(Stunden) 1 000 Std 1 600 Std 2 500 Std 4 000 Std 6 000 Std
Monatshöchstlast
Zwe imonatshöchs tias t
Dreimonatshöchstlast
Mittel der 3 höchsten Monatswerte der
Höchstlast
Mittel der 2 höchsten 0,96 0,97 0,98 0,99 0,995
Monatswerte der
0 , 8 1
0,83
0,86
0,94
0,83
0,85
0,88
0,95
0,85
0,87
0,90
0,96
0,90
0 , 9 1
0,95
0,98
0,96
0,97
0,98
Eine harmonisierte Tabelle des Schwachlastverbrauchs wurde ebenfalls aufgestellt, um in Fällen, in denen die Tarife nach der Tageszeit differenziert sind (z.B. niedrigerer Tarif während der Nacht), die Preise einheitlich berechnen zu können.
Tabelle des Schwachlastverbrauchs
Ver- Jahres- Jahres- Zu "Schwachlast"-Preisen berechneter braucher benutzungs- verbrauch Anteil am Jahresverbrauch (in 1 000 kWh) Typen dauer in Abhängigkeit von der tariflichen
Schwachlaststundenzahl pro Tag
Stunden 1 000 kWh 7 Std 8 Std 9 Std 10 Std 11 Std 12 Std
1 000
1 000
1 600
2 500
4 000
4 000
6 000
30
50
160
1 250
2 000
10 000
24 000
0 0 0 0 0 0
0 0 0 0 0 0
11 13 16 19 22 25
197 225 262 300 338 375
438 500 580 660 740 820
2 190 2 500 2 900 3 300 3 700 4 100
7 140 8 160 9 120 10 080 11 040 12 000
Erstreckt sich die Rechnungsstellung für Schwachlastzeiten auf andere Zeitspannen, z.B. den ganzen Sonntag, so wird nur die Hälfte dieser zusätzlichen Schwachlastzeiten berücksichtigt. Auf diese Fälle wird im Hauptteil der Untersuchung hingewiesen.
Ändern sich die Tarifparameter im Laufe des Jahres, so werden diese Änderungen nicht berücksichtigt. Mit anderen Worten : Eine Gewichtung der Preise in einem Jahr erfolgt nicht.
3. DEFINITIONEN DER ERHOBENEN PREISE
Alle Preise werden in verkauften Elektrizitätseinheiten, d.h. in Kilowattstunden (kWh) ausgedrückt. Die Ergebnisse stellen die zu Beginn jedes Jahres angewandten Preise je Einheit einschließlich der zum 1. Januar eingetretenen Tarif-, Parameter-, Indexänderungen usw. dar. In den Fällen von kurzfristig (monatlich, vierteljährlich) indexierten Tarifen oder Verträgen wird der im Januar geltende Index angewandt.
Besteht die Möglichkeit, mehrere Tarife wahlweise anzuwenden, so wird nach Ausschluß der in der Praxis nicht verwendeten oder nur für eine Randgruppe oder geringe Zahl von Abnehmern verwendeten Tarife der für den Abnehmer günstigste Tarif berücksichtigt.
Bestehen nur Quasi-Tarife oder Einzelverträge oder werden die Preise frei ausgehandelt, so werden die Preise erhoben, die dem repräsentativen Wert der gewählten Lieferbedingungen (dem am häufigsten angewandten Preis) entsprechen. Im Fall von frei ausgehandelten Preisen oder Verträgen erstrecken sich die Erhebungen auf die im Monat Januar bezahlten Rechnungen oder auf die Preise, die sich aus den im gleichen Monat geltenden und am häufigsten geschlossenen Verträgen ergeben. Diese Fälle werden im Hauptteil der Untersuchung aufgezeigt und erläutert.
Wird ein Verbraucher über einen Zweittarif-Zähler beliefert (z.B. Tagtarif und Nachttarif), so ergibt sich der Preis aus dem Gesamtverbrauch.
Tarifsonder- und Zusatzregelungen, die ggf. für den Blindstrom gelten, sind berücksichtigt worden.
Drei Preise werden angegeben :
- Preis vor Steuern
- Preis ohne Mehrwertsteuer (MwSt)
- Abgabepreis, einschließlich aller Steuern.
Der Preis vor Steuern ergibt sich unmittelbar aus der Anwendung der Tarife oder Verträge.
Der Preis ohne MwSt umfaßt ggf. die übrigen spezifischen Steuern, der Preis ist von Interesse, wenn die MwSt. abzugsfähig ist.
Der Preis einschließlich aller Steuern entspricht dem vom Abnehmer gezahlten Betrag.
Unter "Steuern" sind hier die Erhebung von Steuern und steuerähnlichen Abgaben zu verstehen, die auf der Stufe der Abgabe an den Verbraucher unmittelbar für Elektrizität gelten. Die genannten Steuern können landesweit oder auf regionaler, kommunaler, städtischer Ebene usw. zugunsten des Staates, der regionalen oder kommunalen Verwaltungen, der Berufsverbände usw. erhoben werden.
Für den internationalen Vergleich mußte eine gemeinsame Währungseinheit gewählt werden, die repräsentativ sein mußte und beim räumlichen und zeitlichen Vergleich zu möglichst wenigen Verzerrungen führte. Daher wird in der vorliegenden Untersuchung der Kaufkräftetandard (KKS) verwendet. Ferner sind internationale Vergleichstabellen in Europäischen Währungsseinheiten
(ECU) aufgenommen worden. Die genannten Werteinheiten werden im folgenden Kapitel dargestellt und erläutert.
4. VERSORGUNGSSPANNUNG
Die VersorgungsSpannung, mit der die Elektrizität dem Verbraucher geliefert wird, ist ein Faktor, der das Preisniveau für die Industrie beeinflussen kann. Je höher die Spannung ist, um so niedriger liegt der Abgabepreis. In diesem Falle geht aber der Transformator mit den Investitions- oder Mietkosten usw. zu Lasten des Verbrauchers.
In der Praxis sind die Versorgungsspannungen je nach Netz und Tarif gestaltung unterschiedlich. In Übereinstimmung mit den allgemeinen Definitionen wird die Spannung berücksichtigt, mit der die elektrische Energie dem Verbraucher tatsächlich geliefert wird.
Stehen mehrere Versorgungsspannungen für ein und dieselbe Kategorie von Verbrauchern nebeneinander zur Verfügung, so wird die gängigste Spannung
(größte Zahl von Abnehmern) berücksichtigt.
VersorgungsSpannung
kV
Verbraucher-Belgien
Dänemark
BR Deutschic
- Südliches
- Hamburg, l
Düsseldori
- Westliches Stuttgart,
Griechenlanc
Spanien
Frankreich
Irland
Italien
Luxemburg
Niederlande
- GEB
- PEN
- PNEM
Portugal
Vereinigtes
Typen :
md
Gebiet
[anno ver,
".Frankfurt
. Gebiet, München
1
0
τΒ Ib
40
0.38
0.38
Xc
10/
!d
15
!e
< 10
20
10
Xf
10
h
10
0
0 38
<= 1
0,38
0,38
38| |
1
1
6,
| > 1-36
I
<= 50
10/ 15 6
15
10
0,38
0,38
1
1
10
20
36·
38
1
22•72,5
140-130
1
65
10
1
1
1
25I
10
1 1
| 0,415
> 1 < 60
1
11
| >= 60
III. WERTEINHEITEN
Um Vergleiche zwischen Staaten zu ermöglichen, müssen die in Landeswährung ausgedrückten Preise in eine gemeinsame Einheit umgerechnet werden. In der vorliegenden Studie werden folgende zwei gemeinsame Einheiten verwendet:
- die Europäische Währungseinheit (ECU);
- der Kaufkraftstandard (KKS).
1. DIE EUROPÄISCHE WÄHRUNGSEINHEIT (ECU)
Bei der ECU handelt es sich um einen "Währungskorb", der sich auf die zu den auf dem Devisenmarkt notierten Wechselkurse für gewisse Beträge der einzelnen Landeswährungen der Gemeinschaft stützt, wobei eine Gewichtung erfolgt, bei der das Bruttoinlandsprodukt und der innergemeinschaftliche Handel jedes Mitgliedstaates berücksichtigt werden.
Die neue Zusammensetzung des Währungskorbs der ECU stellt sich wie folgt dar:
0.6242 DM 1.332 FF 0.2198 HFL 3.301 BFR 0.13 LFR 151.8 LIT
0.1976 DKR 0.008552 IRL 0.08784 UKL 1.44 DR 6.885 PTA 1.393 ESC
Die Umrechnungsfaktoren zwischen ECU und Landeswährungen im Januar jeden Jahres sind in einer Tabelle im statistischen Anhang aufgeführt.
Nach ihrer Definition spiegelt der ECU durchaus die Wechselkursschwankungen wider und ist daher zur Messung der Preise und Werte der internationalen Waren- und Dienstleistungsströme geeignet. Die in ECU ausgedrückten Daten ermöglichen infolgedessen einen Vergleich zwischen den Preisen nach Umtausch von Devisen bei der Bank. Dieser Währungsumtausch zu den auf dem Devisenmarkt notierten Wechselkursen hat jedoch den Nachteil, dass mit der Zeit unter der Einwirkung zahlreicher Faktoren, die von den Bewegungen der Inlandspreise unabhängig sind, Fluktuationen auftreten:
- Kapitaltransfers,
- politische Entscheidungen,
- psychologische Faktoren,
- Zinssätze.
So kann eine Landeswährung im Vergleich zu ihrer wirklichen Kaufkraft unter- oder überbewertet werden.
Ausserdem existieren grosse Unterschiede zwischen bestimmten Ländern beim BIP je Einwohner, die nicht nur auf ein grösseres Volumen der Verwendung von Waren & Dienstleistungen, sondern daneben auch auf ein höheres
allgemeines Preisniveau zurückzuführen sind.
Um diese Differenzen auf dem allgemeinen Preisniveau auszuschalten, ist es notwendig, die Kaufkraftparitäten zu berechnen.
Ausserdem ändert sich die Definition des ECU bei der Aufnahme einer neuen Währung, wie es im Fall des Beitritts Griechenlands, Spaniens und Portugals der Fall war; zudem fehlt eine Kohärenz mit den Preisindizes des Bruttoinlandsprodukts, so dass Deflationsschwierigkeiten auftreten.
Um diesen Nachteilen zu begegnen, ist die tatsächliche Kaufkraft jeder Landeswährung zu berechnen, wodurch man zu dem Begriff des Kaufkraftstandards gelangt.
2. KAUFKRAFTSTANDARD (KKS)
Der KKS ist eine Bezugseinheit, die in der Art und Weise berechnet wird, dass ihre Relationen zu den verschiedenen Landeswährungen sich proportional zu den Kaufkraftparitäten (KKP) der genannten Währungen verhalten.
Derartige Paritäten würden ausreichend sein, um alle Daten preisbereinigt in der Landeswährung jedes beliebigen Staates auszudrücken. Das Verfahren gewährleistet, dass sie transitiv und unabhängig von dem als Bezugsgrösse gewählten Staat sind. De facto wird für die Gemeinschaftsberechnungen eine andere Werteinheit - genannt KKS - verwendet. Sie wird definiert, indem die Preisrelationen auf das BIP in Landeswährung der Staaten angewandt und die Paritäten in der Art und Weise bemessen werden, dass der Wert des BIP der Gemeinschaft (EUR 12) im Jahre 1975 (Retropolation im Jahre 1975 der Ergebnisse der Untersuchung von 1985) unabhängig davon, ob es in ECU oder in KKP ausgedrückt wird, übereinstimmt. Nur seine Aufteilung auf die Staaten wird geändert.
Wenn die Preise mit Hilfe der BIP-Parität in KKS umgerechnet werden, so lässt sich folgende Aussage machen:
Wenn 1 Gigajoule Energie im Lande A 10 KKS und im Lande Β 5 KKS kostet, so bedeutet dies, dass - abgesehen von dem allgemeinen Preisniveau der beiden Länder - 1 Gigajoule Energie in dem Land A doppelt so teuer ist wie in dem Land B.
Diese Bewertung ist unabhängig von den Wechselkursen, deren Werte noch von anderen Faktoren als dem Preisniveau beeinflusst werden (Kapitalbewegungen, Spekulation, Zinssätze, politische Entscheidungen usw.).
Die Umrechnungsfaktoren für die in dieser Studie erfassten Berichtsjahre sind in einer Tabelle im Anhang enthalten. Sie sind bei der Änderung des Basisjahres revidiert worden.
3. PREISE IN NICHT PREISBEREINIGTEN KKS UND IN KONSTANTEN KKS
Die Preiserhebungen zur Erstellung der Kaufkraftparitäten werden nicht jedes Jahr durchgeführt. Die letzte zur Verfügung stehende Erhebung stammt aus dem Jahre 1985 und die vorhergehende von 1980. Da es sich bei den Paritäten aber um Preisrelationen handelt, kann ihr Wert für andere Jahre geschätzt werden, indem sie entsprechend den relativen Schwankungen der Indizes der Preise für die einzelnen Länder im Vergleich zu dem Gemeinschaftsmittel extrapoliert werden: Das Ergebnis sind die sogenannten preisbereinigten Paritäten.
Die, wie oben beschrieben, berechneten Daten können ebenfalls zwischen Ländern verglichen werden. Die Ergebnisse dieses Vergleichs werden relativ gesehen - mit den Ergebnissen übereinstimmen, die bei Verwendung der nicht inflationsbereinigten Preise und der nicht inflationsbereinigten KKS erzielt werden, weil die letztgenannten, ausgehend von den gleichen Indikatoren, nämlich den Preisindizes des BIP für jedes Land und dem mittleren Gemeinschaftsindex, extrapoliert werden.
Die Berechnung in deflationierten KKS wird somit wie folgt durchgeführt:
1) Die Preise der Zeitreihe in nicht inflationsbereinigten Landeswährungen werden durch ein Hundertstel des Preisindex des BIP für jedes der berücksichtigten Jahre dividiert;
2) Diese deflationierte Reihe wird mit dem Umrechnungsfaktor des Basis-Jahres 1985 in KKS umgerechnet.
4. PREISREIHEN
Aufgrund der obigen Beschreibung werden die Ergebnisse der vorliegenden Preiserhebung in der Gemeinschaft in drei Formen dargestellt, und zwar:
1) Als Reihen mit nicht inflationsbereinigten Preisen für jedes Land, in Landeswährung, Ecu und KKS.
2) Als Tabelle mit zusammenfassender Wiederholung für eine Region pro Land :
a) mit Preisen im laufender Landeswährung b) mit Preisen in laufenden Ecus
IV. STEUERLICHE BELASTUNG
In der Gemeinschaft unterliegt die Abgabe von elektrischer Energie einer allgemeinen indirekten Steuer, der Mehrwertsteuer (in Griechenland: bis einschließlich 1986 der - nur auf Haushalte anzuwendenden - Umsatzsteuer).
Ferner bestehen in sieben Ländern spezifische Steuern auf die elektrische Energie.
Die in dieser Studie aufgeführten Preise nach Steuern schließen alle Steuern ein. In den Tabellen im Anhang ergibt die Differenz zwischen Preisen vor MwSt. und Preisen vor Steuern den absoluten Betrag der etwaigen spezifischen Steuern; dagegen ergibt die Differenz zwischen Preisen nach Steuern und Preisen vor MwSt. den absoluten Betrag der Mehrwertsteuer (in Griechenland: Umsatzsteuer) in Landeswährung je kWh.
1. ALLGEMEINE INDIREKTE STEUER
Im allgemeinen wird die MwSt. auf den Preis vor MwSt. (proportionale Abgabe) aber einschließlich der etwaigen spezifischen Steuern, die in die Bemessungsgrundlage fallen, berechnet und angewandt. Die spezifischen Steuern können proportional oder fest sein. Eine Ausnahme bildet Frankreich, wo die MwSt. auf den Preis vor spezifischen Steuern berechnet wird.
Es werden die folgenden Sätze erhoben :
Auf die Abgabe von elektrischer Energie erhobene Mehrwertsteuer (MwSt.) % des Preises vor MwSt.
Januar 1980 1988 1989 1990 01-1991
Belgien Dänemark
BR Deutschland Griechenland Spanien Frankreich Irland Italien (Haushalte) Italien (andere (Verbraucher Haushalte) Luxemburg (G· Niederlande Portugal Vereinigtes Königreich
als
D)
16 20, 13 25
8(1) -17,
0 6
14
5 18 -0
6
17 22 14 16 12 18,6
0 9
9/18
6 20 8 0
17 22 14 16 12 5,5/18,6
5 9
9/19
6 18,5
8 0
17 22 14 16 12 5,5/18,6
5 9
9/19
6 18,5
8 0
17 22 14 18 12 5,5/18,6
10 9
9/19
6 18,5
8 15
In Frankreich findet auf die Grundgebühren der Haushalte ein Satz von 5,5 % und auf die Energiekosten der Haushalte sowie auf die Industrieabnehmer ein Satz von 18,6 % Anwendung.
In Italien hängen die neuen MwSt.-Sätze seit 1985 von der jeweiligen Wirtschaftstätigkeit ab, d.h. es wird ein Satz von 9 % für die Bergbau-und Fertigungsindustrie, einschließlich Druckerei Bergbau-und Verlagsgewerbe, Bergbau-und ein Satz von 18 % auf (19 %) für die sonstigen Tätigkeiten ohne Haushalte erhoben. In der vorliegenden Studie wird der Satz von 9 % auf die Verbraucher-Typen I und 1^ und der Satz von 18 % (19 %) auf die Verbraucher-Typen I - I angewandt.
Seit Ol Juli 1991 wird ein MWS vum 15% im Königreich eingeführt. Von der MWS sind die Haushalte, die sehr niedrigen Verbrauchertypen sowie gemeinnützige Gesellschaften ausgeschlossen.
Die MwSt. ist für die Abnehmer in Industrie und Handel, die dem allgemeinen Steuersystem unterliegen, abzugsfähig.
2. SPEZIFISCHE STEUERN
a) Dänemark
Im April 1977 wurde auf elektrische Energie eine Regierungssteuer mit folgenden Sätzen eingeführt :
1.1.1983 15,50 ere/kWh 1.1.1986 19,00 øre/kWh 1.1.1987 32,50 øre/kWh 1.1.1990 33,00 øre/kWh (1) 1.1.1991 33,00 ere/kWh (1)
(1) Bei einer Abnahme von mehr als 4000 kWh/Jahr für Haushalte mit Elektroheizung (D ) auf 29,5 øre/kWh herabgesetzt.
Die Steuer ist Teil der Berne s sungs grundlage für die MwSt. und ebenso abzugsfähig wie die MwSt.
b) BR Deutschland
Ausgleichsahgabe (% des Preises vor Steuern)
Städte 1980 1988 1989 1990 01-1991
Hamburg Hannover Düsseldorf
Westliches Gebiet Frankfurt/Main Stuttgart München
Südliches Gebiet
5,1 4,3 5,3 5,3 4,1 4,0 4,0 4,0
8,1 7,5 7,9 7,9 6,9 6,4 7,0 7,0
9,5 8,9 9,2 9,2 8,2 7,6 8,3 8,3
9,2 8,6 8,9 8,9 7,9 7,4 8,0 8,0
8,9 8,4 8,6 8,6 7,7 7,2 7,8 7,8
Bundesdurchschnitt 4,5 7,3 8,7 8,4 8,1
c) Griechenland
Von 1984 bis zum 31.12.1986 wurde auf die Abgabe von Elektrizität an Haushalte eine Stempelabgabe von 1,2 % auf den Preis vor Steuern erhoben. Diese Abgabe war in der Bemessungsgrundlage für die Umsatzsteuer enthalten.
d) Spanien
Im Zeitraum 1980-1985 wurden mehrere Steuern erhoben. Diese zum 31.12.1985 abgeschafften Steuern lassen sich wie folgt zusammenfassen :
Zeitraum
1980/1985
Sektor
Haushalte Industrie
Sondersteuer Ptas/kWh
0,35 0,35
IGTE %
6 6
Provinz-steuer
%
0,3 0,3
Gemeinde-steuer
%
-Die drei proportionalen Steuern werden auf den Preis vor Steuern berechnet und nicht kumuliert. Die IGTE ist eine allgemeine Abgabe auf
mehr getrennt ausgewiesen. Sie ist seit diesem Zeitpunkt in den Kosten und damit in den Tarifen enthalten, auch wenn die Versorgungsunternehmen den Betrag weiterhin an die Gemeinden entrichten. Die Steuer war nur von Verbrauchern auf städtischem Gebiet zu entrichten.
Viele große und mittlere Industriebetriebe brauchten die Steuer nicht zu entrichten, da sie außerhalb der Städte angesiedelt waren. Der tatsächlich angewandte Satz betrug für die Industrie insgesamt durchschnittlich nur 0,8 % für die in Hochspannung (lkV) versorgte Industrie 0,6 %.
Der Einfachheit halber würde in dieser
Kleinabnehmer aus Industrie und Handel (I„ - I„) der vollen Satz der Studie für alle Haushalte und -a - Xc> Gemeindesteuer (1,5 %) gewählt; bei den anderen Industrieabnehmer-Typen
(IJ - I ) wird ein Standort außerhalb der Städte angenommen.
Am 1. Januar 1986 wurden die verschiedenen Steuern durch die Mehrwertsteuer abgelöst.
e) Frankreich
Die Sätze und die Bemessungsgrundlage der Gemeinde- und Departementssteuern auf die Abgabe von elektrischer Energie wurden durch das Gesetz vom 29. Dezember 1984 mit Wirkung vom März 1985 geändert und wirkten sich im Januar 1986 auf die Preise aus. Es gilt jetzt folgende Bernessungsgrundlage :
Leistungsbedarf
kVA kW % des Preises vor Steuern Verbraucher-Typen
<36 36-250 >250
<32,4 32,4-225
>225
80 30 0
Da à De Ia
Zuvor wurden die Niedrigspannung (D„ angewandt.
Steuern
bis De> auf 80 % des lediglich für Preises vor Steuern die Versorgung in
Gemeindesteuer und Departementssteuer (%)
Städte Gemeindesteuer Departementssteuer Insgesamt
1980-85 1986-01.91 1980-85 1986-01.91 1980-85 1986-01.91
Lille Paris Marseille Lyon Toulouse Straßburg
8 13,2
8 8 8
8 13,2
8 8 8
1
4
2 4
4 4 4 4
9 13,2 12
8 10 4
10 13,2 12 12 12 4
f) Italien
Der Verbrauch von Elektrizität unterliegt einer spezifischen staatlichen Steuer (imposta erariale), deren Sätze seit 1981 wie folgt lauten (Vor 1981 bestand ein komplizierteres System):
(LIT/kWh)
Gebiet Zeitraum Haushalte Andere Verbraucher als Haushalte
für die ersten für die 200 000kWh folgenden kWh des Monats des Monats
Norden und Mitte 1981-1988 1989-01.1991
Süden und Inseln 1981-1988 1989-01.1991
1.10 4.10
0.55 2.05
1.10 4.10
0.55 2.05
0.65 2.45
0.325 1.220
Bestimmte Abnehmer sind von der Steuer befreit: Elektrochemie, Elektrometallurgie, öffentliche Beleuchtung, Fahrstrom.
(Lit/kWh)
Gemeinden Provinzen
1986-87 1988 1989-01.91 1986-87 1988 1989-01.91 Verbraucher
Haushalte (1) 13 15 18
Andere Verbraucher 5,5
als Haushalte (2) 6,5 6,5 5,5 8,5 11,5
(1) Von 1985 bis 1989 ist der Verbrauch unter 900 kWh/Jahr für Da und Db steuerfrei, wenn die Lieferung an den Hauptsitz des Abnehmers erfolgt.
(2) Von 1986 bis 1989 für die Verbraucher deren maximalen Leistungsbedarf unter 1 000 kWh liegt, für die ersten 200 000 kWh des Monats.
Diese Steuern wurden in 1990 und 1991 einheitlich für die Haushalte und industrielle Verbraucher angewendet, wobei die Letzteren nur für die ersten 200 000 kWh des Monats besteuert werden (Gesetz von 27.01.89)
Einem Gesetz vom 26.06.90 zufolge ist eine neue Steuer in Kraft getreten. Sie ist in den beiden Regionen : Nord und Zentrum, Süd und Inseln gleich. Ihre Höhe wird wie folgt bestimmt :
Haushalte
Industrie
7 Lit/kWh für ortsansässige Verbraucher, 10,5 Lit/kWh für nicht ortansässige Verbraucher.
7 Lit/kWh für Lieferungen unterhalb 30 kW,
10,5 Lit/kWh für Lieferungen zwischen 30 und 3000 kW, 4 Lit/kWh für Lieferungen überhalb 3000 kW.
Alle genannten Steuern fallen in die Bemessungsgrundlage für die MwSt.
g) Portugal
Es wird eine Inspektionssteuer, die in die Bemessungsgrundlage für di« MwSt. fällt, mit den nachstehenden Sätzen erhoben :
ESC/Monat
SYMBOLS AND ABBREVIATIONS
%
0
NIL
No data available Per cent
Annual average percentage increase
V kV
kVA
kW
h kWh GWh
n
Volt
Kilovolt (= 1 000 V) Kilovoltampere
Kilowatt Hour
Kilowatthour
Gigawatthour (106 kWh)
Number
BFR Belgian franc
DKR ere Danish crown, øre=l/100 DKR DM pf German mark, Pfennig=l/100 DM
DRA Greek drachma
PTA Peseta
FF cent. French franc, centime
IR£ ρ Irish pound, penny=l/100 IR£
LIT Italian lira
LFR Luxembourg franc HFL cent Dutch guilder, cent
ESC Escudo
UK£ ρ Pound sterling, penny=l/100 UK£
PPS/SPA Purchasing power standard
ECU European currency unit
EUR 12 Total of the member countries of the European Communities
I. INTRODUCTION
The present publication contains the most recent prices, valid in 1991 together with prices for 1985 (base year for comparisons) from 1988.
The definitions and methods remain the same as those used in previous studies, so that the development of electricity prices can be observed over a very long time series.
Other publications in this series have, in addition to giving the same range of price information as seen here, described the structure of the electricity industry by country, detailed the tariffs applied and analysed the results.
This study gives for the three price levels concerned prices in national currencies, Ecu (average value for January) and PPS (annual value, as estimates for 1991, as available on 10 June 1991).
This publication is available in three languages : English, French and German.
II. CONDITIONS AND METHODS
1. SCOPE AND LOCATIONS
The present study aims to show the actual price of electricity paid by the consumer in the member countries of the European Community.
The prices are recorded at the beginning of each year based on the tariffs, contracts, conditions and rules in force at that time.
It is concerned with the actual price paid by the electricity consumer, corresponding to the invoiced delivery price to the consumer at the beginning of each year including any eventual rebates and subsidies. Our consumers are defined as those who purchase electricity for their own use and exclude those who offer it for resale. We have not considered the bulk price paid by the electricity distributors.
As regards consumers, the study considers all types of customers supplied through the public distribution network with low, medium and high-voltage electricity. In the interests of simplified presentation, consumers are subdivided into two groups, one for domestic and the other for industrial users. The survey does not cover certain industrial consumers :
1) who themselves produce part of their electrical energy requirement;
2) who purchase electricity under special contract terms because of their exceptionally high power requirements and consumption demand.
These exceptions are mainly steelmaking and chemical industries, or those engaged in the production of aluminium and other metals by electrolysis and also railways, etc.
Most of these industries consume over 24 million kWh annually. They are few in number, but nevertheless consume an appreciable part of the total electrical energy supplied.
In order to reflect as accurately as possible the real position of consumers, it seemed advisable to record prices at selected locations, i.e. towns, conurbations or distribution networks, rather than give average prices per country.
The prices were
Belgium
Denmark
FR of Germany
Greece
Spain
France
Ireland
Italy
Luxembourg
Netherlands
Portugal
United Kingdom
recorded in the following towns or conurbations :
: The country as a whole (standard national tariff).
: Copenhagen (KB), North Zealand (NESA).
: Hamburg, Hanover, Düsseldorf, Frankfurt am Main, Stuttgart, Munich, Western Zone, Southern Zone.
: Athens (standard national tariff).
: Madrid (standard national tariff).
: Lille, Paris, Marseille, Lyon, Toulouse, Strasbourg.
: Dublin.
: Northern and central Italy, southern Italy and the islands.
: Grand Duchy (Cegedel).
: Rotterdam (GEB), North Holland (PEN), North Brabant (PNEM).
: Lisbon.
: London, Glasgow, Leeds, Birmingham.
Certain towns selected are representative of larger regions.
2. STANDARD CONSUMERS
The survey is based on the system of standard consumers, i.e. the prices are recorded for certain levels of electricity consumption and under certain conditions of supply, chosen as being representative of the population of electricity consumers. These standard levels of consumption remain fixed from one year to the next and for all the countries, this being one of the primary conditions for spatial and temporal comparability of prices.
Two groups of standard consumers are taken
Annual consumption kWh Approx.
Standard -- subscribed Standard dwelling consumer Total (of which night) demand in kW
600
1 200
3 500 (1 300)
7 500 (2 500)
20 000 (15 000)
3 50m 2 rooms+kitchen
3 - 4 70m 3 rooms+kitchen
4 - 9 90m 4 rooms+kitchen
6 - 9 100m 4-5 rooms+kitchen
120m 5 rooms+kitchen
As a guideline these standard consumers may be expected to possess the following household facilities and appliances :
D : Lighting, radio, television, refrigerator, small electric appliances (E.g. : vacuum cleaner, electric toaster, hair dryer, food mixer, coffee grinder, etc...).
D, : as for D plus washing machine or dishwasher;
as for D^ with washing machine and dishwasher plus storage water heater;
D : "all-electric" system with water heater and electric central heating operating on a storage basis.
Seven industrial standard consumers (for voltage see point 4) coded I Dc Dd
to
h
haveStandard consumer
Ia
ib
ic id ic
xf
h
been taken :
Annual
1 2 10 24
consumption kWh
30 000 50 000 160 000 250 000 000 000 000 000 000 000
Maximum demand in kW
30 50 100 500 500 2 500 4 000
Annual load factor h
1 000 1 000 1 600 2 500 4 000 4 000 6 000
(1) Annual duration of maximum demand
The price of supply is calculated for cos 10= 0.9.
The annual load factor determines the regularity of consumer offtake of electricity from the grid during the year. The longer this time the more even the pattern of consumption during the 8 760 hours of the year. It indicates the number of hours in which the consumer would reach his annual consumtion level if the demand level were permanently equal to maximum demand.
Additional details are sometimes needed before the tariffs can be applied :
- In the case of tariffs based on half hourly maximum demand, the maximum demand of the standard consumer is multiplied by a coefficient of 0.98.
- In the case of tariffs based on a maximum demand expressed in kVA an adjustment is made by dividing the standard consumer's maximum demand in kW by the coefficient cos j = 0.90.
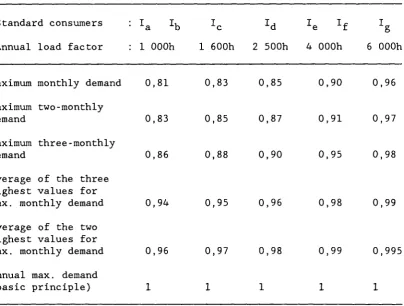
[image:34.595.107.512.367.673.2]- In the case of tariffs based on maximum demand readings more frequent than once a year the standing charge is multiplied by the following coefficients :
Table of power correction coefficients
Standard consumers : I 1^ Ic 1^ I& 1^ I
Annual load factor : 1 000h 1 600h 2 500h 4 000h 6 000h
Maximum monthly demand 0,81 0,83 0,85 0,90 0,96
Maximum two-monthly
demand 0,83 0,85 0,87 0,91 0,97
0 , 8 3
0 , 8 5
0 , 8 8
0 , 8 5
0 , 8 7
0 , 9 0
0 , 9 0
0 , 9 1
0 , 9 5
Maximum three-monthly
demand 0,86 0,88 0,90 0,95 0,98
Average of the three highest values for
max. monthly demand 0,94 0,95 0,96 0,98 0,99
A harmonized table for consumption during "off-peak" periods has also been compiled in order to be able to calculate prices when tariffs vary according to the time of the day (e.g. lower tariff during the night).
Table of consommation during off-peak rates
Annual
Standard load Annual consumer factor consumption
Annual consumption (in 1 000 kWh) charged at off-peak rates according
to the average daily duration of off-peak periode
h
1 000
1 000
1 600
2 500
4 000
4 000
6 000
1 000 kWh
30
50
160
1 250
2 000
10 000
24 000
7 h 8 h 9 h 10 h 11 h 12 h
0 0 0 0 0 0
0 0 0 0 0 0
11 13 16 19 22 25
197 225 262 300 338 375
438 500 580 660 740 820
2 190 2 500 2 900 3 300 3 700 4 100
7 140 8 160 9 120 10 080 11 040 12 000
If off peak rates are charged during other periods, for example all day Sunday we have only taken one half as supplementary off peak hours.
Account has not been taken of changes in tariff parameters during the course of a year. In other words no weighted price is calculated for a year.
3. DEFINITION OF THE PRICE LEVELS RECORDED
If there are several possible tariffs, it is the tariff which is most advantageous to the consumer that is taken into account, after the elimination of the tariffs which are not used in practice or which apply only to a marginal or negligible number of users.
When there are only quasi - tariffs, special contracts, or freely negotiated prices, the most commonly found price (most representative)
for the given supply conditions has been recorded. In the case of freely negotiated prices or contracts, the returns relate respectively to the bills paid during the month of January or to the prices resulting from the contracts in force during that month.
In the case of a consumer having two separate meters or a switch meter (e.g. to record night and day consumption), the price reflects total consumption.
Account has been taken of special tariff or supplementary arrangements which may exist for reactive power.
Three price levels are shown :
- the price net of tax;
- the price excluding VAT but including all other taxes;
- the selling price (inclusive of all taxes).
The price excluding tax is obtained directly from the tariffs or contracts.
The price excluding VAT includes, where payable, other specific taxes which is interesting in cases where VAT is deductible.
The price inclusive of all taxes corresponds to the sum paid by the consumer.
"Taxes" is used here to mean fiscal and para-fiscal levies applying directly to electricity at the stage of sale at the consumer. These taxes may be levied at the national, regional, local or municipal level, etc. by the State, regional or local administrations, professional associations, etc.
On the other hand, the taxes levied before the sale of the electricity, such as taxes on companies, profits, wages, etc., are not calculated separately. They remain an integral part of the price excluding tax.
These units of value are explained in the following chapter.
4. TARIFF VOLTAGE
The voltage at which electricity is supplied to the consumer is an element which may affect the industrial price levels. The higher the voltage, the lower the price. But in this case, the consumer has to bear the expense of the electricity transformer (the investment cost or the rental).
In practice the supply voltages vary according to the grid and the' tariffs. According to our general definitions, the voltage taken into account is the one at which electricity is commonly supplied to the consumer.
Where several supply voltages coexist for the same category of users it is the most representative (greatest number of users) which is considered.
Voltage applied to industrial standard consumers
kV
Standard consumers a b Belgium
Denmark
FR of Germany - Südliches Gebiet - Hamburg, Hannover,
Düsseldorf,Frankfurt - Westliches Gebiet
Stuttgart, München Greece
Spain France Ireland Italy Luxembourg Netherlands
- GEB - PEN - PNEM Portugal
United Kingdom
0,40
0.38 0.38
10/ 15
< 10
20 10
10
10 0,38
<= 1 0,38 0,38 0,38|
I
1
I
1 >
ι-6,6 •36
15 10 <= 50
10/ 15
0,38
0,38
1
1
10
20 36
38
| 22
1
-72,5140-130
I
65
10
1
1
1
251
10
1 1
1
0,415> 1 < 60
1 n
1
III. UNITS OF VALUE
To permit comparisons between countries, prices expressed in national currencies need to be converted to a common unit. In this study two common units are used :
- the European currency unit (ECU); - the purchasing power standard (PPS).
1. THE EUROPEAN CURRENCY UNIT (ECU)
The ECU is a basket-type currency unit based on the market exchange rates of a certain amount of each of the Community currencies, weighted according to the gross national product and intra-Community trade of each Member State.
The new composition of the ECU basket is as follows:
0.6242 DM 1.332 FF 0.2198 HFL 3.301 BFR .0.13 LFR 151.8 LIT
0.1976 DKR 0.008552 IR£ 0.08784 UK£ 1.44 DR 6.885 PTA 1.393 ESC
The conversion rates for the ECU against the national currencies in January of each year are given in a table in the Statistical Annex.
The definition of the ECU is such that it reflects fluctuations in exchange rates and is suitable for measuring the prices and values of international flows of goods and services. Data expressed in ECU therefore permit the comparison of prices in terms of money changed at a bank. Such currency conversion at the market exchange rates, however, has the disadvantage that it fluctuates in time under the influence of many factors which are independent of internal price movements :
- capital transfers;
- political decisions;
- regulations ;
- speculation;
- interest rates.
Moreover, there are great differences between the different countries concerning the GDP per head, which represents not just a greater volume of goods and servies consumed, but also a higher general price level.
It is necessary to calculate the purchasing power parities in order to chimiste these differences on the general price level.
The ECU also has the inconvenience that its definition changes when a new currency is introduced, as was the case with the inclusion of Greece, Spain and Portugal, and that it is possibly not coherent with the gross domestic product price index, which makes it difficult to deflate.
THE PURCHASING POWER STANDARD (PPS)
The PPS is a reference unit so calculated that its value in relation to the various national currencies is proportional to the purchasing power parities (PPP) between these currencies.
The purchasing power parities reflect the ratios between price levels in the different countries. The ratios between the prices expressed in national currencies are calculated for each of the products included in the uses of the GDP. If these ratios are suitably weighted, one obtains mean price ratios, the most general of which is the mean calculated for the GDP and known as the PPP at GDP level.
Such parities would be adequate to express all the data in real terms in the currency of any one of the countries considered. The method ensures that they are transitive and unaffected by the country chosen as a basis of reference. For Community calculations another reference unit known as the PPS is used. It is defined by applying the price ratios to the GDP of the various countries expressed in national currency and adjusting the parities so that the value of the GDP of the Community as a whole in 1975 is identical whether expressed in ECU or PPS. Only the proportion accounted for by each country will be different.
When prices are converted to PPS using the GDP parity, the result may be interpreted as follows :
3. PRICES IN CURRENT PPS AND CONSTANT PPS
The price surveys required to calculate purchasing power parities are not carried out every year. The most recent available is that for 1985 and the one before for 1985. Since the parities are price ratios, however, their value for the other years may be estimated by extrapolation using the movement of the GDP price indices for the various countries, referred to as the Community average. These are known as "current parities".
The data can also be converted into base year PPS. If price series deflated by the GDP price index for each country are expressed in base year PPS, one obtains an indication of the change in prices for the product in question in relation to the general level of prices in the country. The data so calculated can also be compared between countries, giving the same results in relative terms as will be obtained using current prices and current PPP, since the latter are extrapolated using the same indices, namely, the GDP price indices for each country and the average Community index.
Calculation using deflated PPS is thus carried out as follows :
1) The prices of the time series in current national currency are divided by one hundredth of the GDP price index of each of the years concerned;
2) This deflated series is converted to PPS using the conversion factor of the base year 1985.
PRICE SERIES
In the light of the foregoeing, the results of this survey of Community prices are given in four forms :
1) A series of current prices for each country, in national currency, Ecu and PPS.
2) Summary tables giving for one region per country : a) Current prices in national currencies
b) Prices in current Ecus
IV. TAXES
In the Community, sales of electricity are subject to a general indirect tax, value added tax (turnover tax applicable to domestic consumption only, in Greece up to and including 1986).
Furthermore, specific taxes are levied in seven countries.
The prices inclusive of all taxes shown in this study comprise all the taxes mentioned above. In the tables in the annex, the amount of any specific taxes can be calculated from the difference between the tax¿ exclusive and VAT-exclusive price, while the difference between the total tax-inclusive price and VAT-exclusive price gives the amount of value-added tax (or turnover tax for Greece) in national currency per kWh.
1. GENERAL INDIRECT TAX
In general, VAT (proportional tax) is calculated and applied to the price exluding VAT but including any specific taxes, these being part of the basis of assessment. The specific taxes can be proportional or fixed. France constitutes an exception since VAT is computed on the price excluding specific taxes.
The rates are as follows :
Value-added tax on electricity sales (% of price before VAT)
January 1980 1988 1989 1990 01-1991
Belgium Denmark
FR of Germany Greece
Spain France Ireland Italy (domestic) Italy
(non-domestic) Luxembourg Netherlands Portugal
United Kingdom
16 20, 13 25
8(1) -17,
0 6
14
5 18 -0
6
17 22 14 18 12 18,6
0 9
9/18
6 20 8 0
17 22 14 16 12 5,5/18,6
5 9
9/19
6 18,5
8 0
17 22 14 16 12 5,5/18,6
5 9
9/19
6 18,5
8 0
17 22 14 18 12 5,5/18,6
10 9
9/19
6 18,5
8 15
In France the rate of 5.5% is applied to domestic standing charges whilst the rate of 18.6% is applied to domestic energy charges and all elements of industrial prices.
Since 1985, in Italy, the new VAT rates depend on the activity; 9 % for extractive and manufacturing industries, including printing and publishing, and 18 % (19%) for other non-domestic activities. In this study 18% (19%) has been applied to the standard consumers I and Ï-. and 9% to I„ - I„.
c g
The VAT (15%) was introduced in the United Kingdom on 7/1/91; excluded from VAT are the households, the lowest consumption groups as will as societies of public benefit.
VAT is deductile for industrial and commercial consumers registered for the purposes of value added tax.
2. SPECIFIC TAXES
a) Denmark
A special government tax on electricity was introduced in April 1977, the rates of which were as follows :
1.1.83 15.50 øre/kWh 1.1.86 19.00 øre/kWh 1.1.87 32.50 øre/kWh 1.1.90 33.00 øre/kWh (1) 1.1.90 33.00 øre/kWh (1)
(1) reduced to 29.5 øre/kWh for consumption in excess of 4 000 kWh/year for homes with electric heating (D ).
This tax is included in the assessment to VAT and is deductible in the same way as VAT.
b) Federal Republic of Germany
Compensation tax (% of price before tax)
1980 1988 1989 1990 01-1991
Hamburg Hannover Düsseldorf Western Zone Frankfurt/Main Stuttgart München
Southern Zone
5.1 4.3 5.3 5.3 4.1 4.0 4.0 4.0
8.1 7.5 7.9 7.9 6.9 6.4 7.0 7.0
9.5 8.9 9.2 9.2 8.2 7.6 8.3 8.3
9.2 8.6 8.9 8.9 7.9 7.4 8.0 8.0
8.9 8.4 8.6 8.6 7.7 7.2 7.8 7.8
Federal average 4.5 7.3 8.7 8.4 8.1
c) Greece
From 1984 until 31.12.86 a stamp duty of 1.2 % which is taken into account in calculating turnover tax was applied to the tax exclusive selling price of electricity to domestic consumers only.
d) Spain
Several specific taxes were applied during the period 1980-1985. These taxes which were abolished on 31.12.85 may be summarised as follows :
Period Sector Special tax IGTE
PTA/kWh % Provincial tax Municipal tax % %
1980-1985 Households
Industry 0.35 0.35 0.3 0.3
The three proportional taxes are calculated on the tax exclusive price and are not cumulative. The IGTE is a general transaction tax. The municipal tax is a charge for the area occupied by the aerial or underground lines within the urban conurbations. This tax is not shown separately from October 1984 onwards. Instead it is taken as a general cost and included in the tariffs, nevertheless the distributors continue payment of the tax to the communes. Only consumers within the urban territory were subject to this tax.
For simplicity in this study we have taken the full rate of the municipal tax (1.5%) for all domestic and small industrial/commercial consumers (Ia-Ic) whilst the other industrial standard consumers (In'^p) were considered to be outside the urban territory.
From 1 January 1986 the various taxes were replaced by value added tax.
e) France
The rates and basis for the assessment of municipal and departmental taxes on electricity supplies were modified by the law of 29 December 1984 though the change only came into effect in March 1985 and affected prices in our study in January 1986. The basis of assessment is now as follows :
Subscribed demand % of tax Standard kVA kW excl. price consumers
< 36 < 32.4 80 Da-De I&
36-250 32.4-225 30 Ifa Ic
> 250 > 225 0 IH...I„
d g
Previously the taxes were applied to 80% of the tax exclusive price for low voltage supplies (standard consumers D -D ).
The maximum rate permitted by the law is 12% with however an exception for Paris. The following table summarises the rate of the municipal and departmental taxes during the period studied :
Municipal and departemental taxes (%)
Municipal tax Departmental tax Total
1980-85 1986-01.91 1980-85 1986-01.91 1980-85 1986-01.91 Locations
Lille Paris Marseille Lyon Toulouse Strasbourg
8 13.2
8 8 8
-8 13 8 8 8
-4 -4 4
2 4 4 4
9 13.2 12
8 10 4
f) Italy
Electricity consumption is subject to a State tax (imposta erariale), the rates of which have been as follows since 1981 (A more complicated system was in force before 1991) :
(LIT/kWh)
Region Period Domestic Non domestic
for the first for the 200 000 kWh following kWh of the month of the month
North & Centre
South & Islands
1981-1988 1989-01.1991
1981-1988 1989-01.1991
1 4
0 2
10 10
55 05
1. 4, 10 10
0.55 2.05
0.65 2.45
0.325 1.220
Certain types of consumption are exempt from this tax
chemical, electro-metallurgical, public lighting, railways.
electro-Furthermore, at the end of 1982 local taxes were introduced as follows:
(LIT/kWh)
Municipalities Provinces
1986-87 1988 1989-01.91 1986-87 1988 1989-01.91 Users
Domestic (1) 13 15 18
Non-domestic
(2) 5,5 6,5 6,5 5,5 8,5 11,5
(1) From 1985 to 1989, the consumptions of Da and Db under 900 kWh/year are tax-free, if delivery was at the consumers main residence.
(2) From 1986 to 1989, for the consumers which maximum demand is inferior to 1 000 kWh, for the first 200 000 kWh of the month.
According to a law of 26 June 1990, a new tax was enfored. It is the same for the two regions : North & Center, South and Islands.
Its rate is as follows :
Domestic users : 7 Lit/kWh for residentary users,
10.5 Lit/kWh for users which are not residentary. Industrial users : 7 Lit/kWh for supply below 30 kW,
10.5 Lit/kWh for supply between 30 and 3000 kW, 4 Lit/kWh for supply above 3000 kW.
All these taxes are included in the basis of assessment to VAT.
g) Portugal
An inspection tax which is included in the basis of assessment to VAT is levied at the following rates :
(esc/month)
6 . 8 . 7 6 ■ 2 3 . 4 . 8 2 ·
• 2 2 . 4 . 8 2 2 . 5 0 7 . 5 0
Households Industry
I. INTRODUCTION
Cette publication présente les prix les plus récents valables pour 1988 à 1991, ainsi que ceux de 1985 (année de base pour les comparaisons).
Les définitions et méthodes restent identiques à celles des études antérieures sur ce sujet, de sorte qu'il est possible de suivre l'évolution des prix de l'électricité sur une très longue série chronologique.
Les études antérieures contiennent, en plus des séries de prix reproduites ici, une description de l'industrie électrique par pays, un exposé des tarifs appliqués et une analyse des résultats.
Cette étude précise pour les 3 niveaux de prix concernés les prix en monnaies nationales, en Ecus (valeur moyenne de janvier 1991) et SPA
(valeur annuelle, estimée pour 1991, connue au 10 juin 1991).
Cette publication est disponible en trois langues : allemand, anglais et français.
SIGNES ET ABBREVIATIONS
/ Néant
Donnée non disponible Pourcentage
Pourcentage moyen d'évolution annuel
V Volt
kV Kilovolt (= 1 000 V)
kVA Kilovoltampère
kW Kilowatt
h Heure
kWh Kilowattheure
GWh Gigawattheure (106 kWh)
n Nombre
BFR Franc belge
DKR øre Couronne danoise, øre - 1/100 DKR
DM pf Deutsche Mark, Pfennig = 1/100 DM
DRA Drachme grecque
PTA Peseta espagnole
FF cent. Franc français, centime
IR£ ρ Livre irlandaise, pence = 1/100 IR£
LIT Lire italienne
LFR Franc luxembourgeois
HFL cent Florin néerlandais, cent
ESC Escudo portugais
UK£ ρ Livre sterling, pence = 1/100 UK£
PPS/SPA Standard de pouvoir d'achat
ECU Unité monétaire européenne
EUR 12 Ensemble des Etats membres des Communautés européennes
II. CONDITIONS ET METHODES
1. CHAMP COUVERT
La présente étude vise à saisir les prix réels de l'électricité, payés par les consommateurs, dans les pays membres de la Communauté économique européenne.
Les prix sont relevés au début de chaque année et découlent des tarifs, contrats, conditions et règles en vigueur à cet instant. Il s'agit dé prix réels payés par le consommateur d'électricité, ce qui correspond à
la facturation franco-consommateur, y compris les ristournes éventuelles. Par consommateur, on entend ici les abonnés qui achètent l'électricité pour leur propre consommation, ce qui exclut les revendeurs. N'ont donc pas été relevés les prix d'entrée dans la distribution d'électricité.
En ce qui concerne les consommateurs, l'étude vise l'ensemble de la clientèle approvisionnée par la distribution publique en basse, moyenne et haute tension. Pour simplifier la présentation, les consommateurs sont répartis en deux groupes appelés usage domestique et usage industriel.
Sont toutefois exclus de l'enquête certains consommateurs industriels : 1) qui produisent eux-mêmes une partie de l'énergie dont ils ont
besoin (autoproducteurs);
2) qui achètent l'électricité sous un régime de contrat particulier en raison de leurs conditions exceptionnelles de demande en puissance et en consommation.
Ces exceptions visent surtout les grandes entreprises sidérurgiques et chimiques, la production d'aluminium et autres métaux par electrolyse, les réseaux ferrés, l'éclairage public, etc.
Ces entreprises présentent le plus souvent une consommation supérieure à 24 000 000 kWh par an. Elles sont peu nombreuses, mais consomment une part sensible de l'énergie électrique distribuée.
Les prix sont relevés sur les places suivantes
- Belgique
- Danemark
- Allemagne (RF)
- Grèce
- Espagne
- France
- Irlande
- Italie
- Luxembourg (G-D)
- Pays-Bas
- Portugal
- Royaume-Uni
Belgique (tarif national unifié);
Copenhague (KB), Zelande Septentrionale (NESA);
Hambourg, Hanovre, Düsseldorf, Francfort/Main, Stuttgart, Munich, Zone Ouest, Zone Sud;
Athènes (tarif national unifié).
Madrid (tarif national unifié);
Lille, Paris, Marseille, Lyon, Toulouse, Strasbourg;