ISSN 1017-6004
eurostat
EXTERNAL TRADE
AND BALANCE OF PAYMENTS
Monthly statistics
1 D 1993
Part 1 : Commentaries
Part 2: External trade
Part 3: Balance of payments
Í
_ ternal trade
3^
eurostat
OFICINA ESTADÍSTICA DE LAS COMUNIDADES EUROPEAS
DE EUROPÆISKE FÆLLESSKABERS STATISTISKE KONTOR
STATISTISCHES AMT DER EUROPÄISCHEN GEMEINSCHAFTEN
ΣΤΑΤΙΣΤΙΚΗ ΥΠΗΡΕΣΙΑ ΤΩΝ
ΕΥΡΩΠΑΪΚΩΝ ΚΟΙΝΟΤΗΤΩΝ
STATISTICAL OFFICE OF THE EUROPEAN COMMUNITIES
OFFICE STATISTIQUE DES
COMMUNAUTÉS EUROPÉENNES
ISTITUTO STATISTICO DELLE COMUNITÀ EUROPEE
BUREAU VOOR DE STATISTIEK DER EUROPESE GEMEENSCHAPPEN
SERVIÇO DE ESTATÍSTICA DAS COMUNIDADES EUROPEIAS
L2920 Luxembourg Tél. 430 11 Télex: Comeur Lu 3423
B1049 Bruxelles, bâtiment Berlaymont, rue de la Loi 200 (bureau de liaison) — Tél. 235 1111
Las publicaciones de Eurostat están clasificadas por temas y por series. La clasificación se encuentra al
final de la obra. Para mayor información sobre las publicaciones, rogamos se pongan en contacto con
Eurostat.
Para los pedidos, diríjanse a las oficinas de venta cuyas direcciones figuran en la página interior de la
contracubierta.
Eurostats publikationer er klassificeret efter emne og serie. En oversigt herover findes bag i hæftet.
Yderligere oplysninger om publikationerne kan fås ved henvendelse til Eurostat.
Bestilling kan afgives til de salgssteder, der er anført på omslagets side 3.
Die Veröffentlichungen von Eurostat sind nach Themenkreisen und Reihen gegliedert. Die Gliederung ist
hinten in jedem Band aufgeführt. Genauere Auskünfte über die Veröffentlichungen erteilt Eurostat.
Ihre Bestellungen richten Sie bitte an die Verkaufsbüros, deren Anschriften jeweils auf der dritten
Umschlagseite der Veröffentlichungen zu finden sind.
Οι
εκδόσεις της Eurostat ταξινομούνται κατά θέμα και κατά σειρά. Η ακριβής ταξινόμηση
α ν α φ έ ρ ε τ α ι στο τ έ λ ο ς κάθε έκδοσης. Για λ ε π τ ο μ ε ρ έ σ τ ε ρ ε ς πληροφορίες σχετικά με τις εκδόσεις
μπορείτε να απευθύνεσθε στην Eurostat.
Για τις παραγγελίες μπορείτε να απευθύνεσθε στα γραφεία πώλησης, των οποίων οι διευθύνσεις
αναγράφονται στη σελίδα 3 τ ο υ εξωφύλλου.
Eurostat's publications are classified according to themes and series. This classification is indicated at
the end of the publication. For more detailed information on publications, contact Eurostat.
Orders are obtainable from the sales offices mentioned on the inside back cover.
Les publications d'Eurostat sont classées par thème et par série. Cette classification est précisée à la fin
de l'ouvrage. Pour des informations plus détaillées sur les publications, contactez Eurostat.
Pour les commandes, adressez-vous aux bureaux de vente dont les adresses sont indiquées à la page 3
de la couverture.
Le pubblicazioni dell'Eurostat sono classificate per tema e per serie. Tale classificazione è precisata alla
fine dell'opera. Per informazioni più dettagliate sulle pubblicazioni rivolgersi all'Eurostat.
Per eventuali ordinazioni rivolgersi a uno degli uffici di vendita i cui indirizzi figurano nella 3
a
pagina della
copertina.
De publikaties van Eurostat zijn ingedeeld naar onderwerp en serie. Deze indeling is achter in het boek
opgenomen. Voor nadere informatie over de publikaties kunt u zich wenden tot Eurostat.
Gelieve bestellingen op te geven bij de verkoopbureaus, waarvan de adressen op bladzijde 3 van de
omslag zijn vermeld.
As publicações do Eurostat estão classificadas por tema e por série. Esta classificação está indicada no
fim da obra. Para mais infomações sobre as publicações é favor contactar o Eurostat.
EXTERNAL TRADE
AND BALANCE OF PAYMENTS
Monthly statistics
Part 1 : Commentaries
Part 2: External trade
Part 3: Balance of payments
Luxembourg: Office for Officiai Publications of the European Communities, 1993
© ECSC-EEC-EAEC, Brussels · Luxembourg, 1993
Reproduction is authorized, except for commercial purposes, provided that the source is acknowledged.
Table of contents
Commentary
V
Charts XXVII
General summary of trade by country:
Tab. 1: Yearly and quarterly data .
Tab. 2: Monthly data
General summary of trade by commodities:
Tab. 3: Yearly and quarterly data
Tab. 4: Monthly data
Trends in trade by country:
Tab. 5: World, intra- and extra-EC . . .
Tab. 6: Intra-EC by member countries
Tab. 7: Major areas
Trends in trade by commodities:
Tab. 8: SITC sections
Trade by partner countries:
Tab. 9: All commodities (monthly cumulative data)
Tab. 10: SITC sections and main partner countries (quarterly cumulative data)
Indices:
Tab. 11: Volume and unit value indices
Trade of main non-Community countries:
Tab. 12: Trends in total trade and with the EC (EUR 12)
Conversion rates:
Tab. 13: Member countries, United States of America, Japan and Switzerland
EC trade in agricultural products:
Tab. 14: Main product groups
Tab. 15: Products subject to common agricultural policy regulations
EC trade in petroleum products:
Tab. 16: Petroleum and petroleum products
EC and world trade:
Tab. A: World, Community and main non-Community countries
Trade of the FR of Germany, including West Berlin, as constituted prior to 3 October 1990:
Tab. B: Trade by countries
Tab. C: Trade by products
8
11
16
24
30
52
92
100
102
106
Catalogue of regular publications of external trade
108
109
112
118
Symbols and abbreviations used
EUR 12: Total of the EC member countries
UEBL: Belgo-Luxembourg Economic Union
DK: Denmark
D: Federal Republic of Germany
GR: Greece
E: Spain
F: France
IRL: Ireland
I: Italy
NL: Netherlands
P: Portugal
UK: United Kingdom
USA: United States of America
0: Data less than half the unit used
Mio: Million
Mrd: 1 000 million
ECU: European currency unit
Eurostat: Statistical Office of the European Communities
NOTE
This edition combines external trade and balance of payments statistics for the Community,
the aim being to provide the reader with all statistical information relating to the Community's
external transactions.
Owing to different periodicities of data collection (monthly for external trade, quarterly for
balance of payments), figures for the balance of payments will appear four times a year in this
publication.
The statistical tables will be preceeded by a concise analysis which will comment upon the
main economic trends. To this end, certain Community aggregates will be estimated it the
necessary data is available for most member states.
Seasonal Adjustment: Results
Seasonally adjusted European Community exports
to the rest of the world (extra-EC) picked up again
in mid-1991, after the downward tendency at the
end of 1990. They have been fluctuating around a
high level already recorded at the beginning of 1990
but recently again showed a declining tendency.
The drop in extra-EC exports in the first half of 1991
can mainly be attributed to the Gulf war whereas the
recent economic slowdown in the EC's main trading
partners explains the recent declining tendency in
the EC's exports to the rest of the world. In August
1992, seasonally adjusted-extra-EC exports
decreased by 3,4% compared to July 1992, a
continuation of the downward tendency overthe last
three months.
Seasonally adjusted European Community imports
from the rest of the world (extra-EC) have been
decreasing slightly overthe past few months due to
the economic slowdown in most EC MemberStates.
In August 1992, seasonally adjusted extra-EC
imports dropped by 4,2% compared to July 1992, a
confirmation of the downward tendency registered
overthe last few months.
The European Community's seasonally adjusted
trade balance started to improve slightly during the
second half of 1991 compared to the first half of
1991 and continued this movement in the first
months of 1992. The trade balance fluctuated
around a record low level in the first half of 1991. It
is now back at its mid-1990 level. In August 1992,
the seasonally adjusted Community trade deficit
stood at -3.7 billion ECU.
Trade between EC Member States (intra-EC)
is stabilising around a high level, after an upward
movement recorded since the beginning of 1991. In
August 1992, seasonally adjusted trade
between European Community Member States
dropped by 2,2% compared to July 1992. The large
drop in the unadjusted data for August 1992 is thus
largely due to seasonal influences.
EUR 12 Exports Extra-EC
1984 19Θ5 1986 1987 1988 1989 1990 1991 1992
— Unadjusted — Seasonally Adjusted
EUR 12 Imports Intra-EC
1984 1985 1986 1987 1988 1989 1990 1991 1992
Unadjusted Seasonally Adjusted
EUR 12 Imports Extra-EC
Bio. ECU
1984 1985 1986 1987 1988 1989 1990 1991 1992
- Unadjusted
Seasonally Adjusted
EUR 12 Trade Balance Extra-EC
Bk>. ECU
1984 1985 1986 1987 1988 1989 1990 1991 1992
[image:11.595.48.565.12.776.2]
(12)TABEL I - EUR 12 EXPORTS, IMPORTS, TRADE BALANCE (1)
Seasonally Adjusted Series(2) - Mrd. ECU
Period
Exports Extra-EC
Not Adjusted Seasonally
Adjusted
Imports Extra-EC
Not Adjusted Seasonally
Adjusted
Imports Intra-EC
Not Adjusted Seasonally
Adjusted
Trade Balance Extra-EC
Not Adjusted Seasonally
Adjusted
Jan-89
Feb-89
Mar-89
Apr-89
May-89
Jun-89
Jul-89
Aug-89
Sep-89
Oct-89
Nov-89
Dec-39
Jan-90
Feb-90
Mar-90
Apr-90
May-90
Jun-90
Jul-90
Aug-90
Sep-90
Oct-90
Nov-90
Dec-90
Jan-91
Feb-91
Mar-91
Apr-91
May-91
Jun-91
Jul-91
Aug-91
Sep-91
Oct-91
Nov-91
Dec-91
Jan-92
Feb-92
Mar-92
Apr-92
May-92
Jurt-92
Jul-92
Aug-92
30,3
30,9
34,8
33,7
33,4
37,4
34,0
31,3
34,4
37,8
37,1
37,4
34,1
33,6
37,7
33,3
35,6
35,1
35,5
31,4
31,2
38,8
36,9
35,4
32,6
31,7
34,4
34,5
34,4
34,6
38,6
32,1
34,3
40,0
37,5
38,4
32,7
34,2
38,3
37,1
34,0
35,9
39,4
30,1
33,5
33,0
34,1
33,5
33,7
36,1
33,9
34,2
36,1
34,8
35,0
34,9
37,2
36,0
35,7
34,9
35,5
35,1
33,9
34,5
33,0
35,4
34,9
33,8
34,8
33,8
34,1
34,2
34,5
35,2
36,3
36,5
35,8
35,9
36,6
35,4
35,2
36,2
36,0
37,3
36,0
35,3
36,6
35,3
35,4
34,3
38,0
37,6
39,1
40,1
35,3
34,4
37,7
40,6
39,1
343
39,6
35,6
40,2
37,1
39,4
373
363
35,2
36,6
43,9
41,9
36,0
43,0
37,3
39,2
43,3
42,3
40,4
43,9
37,0
41,6
44,5
42,2
38,3
41,4
39,8
44,0
42,5
40,0
40,6
42,0
33,3
35,2
35,9
36,9
36,9
38,4
39,0
36,9
37,3
37,9
37,9
38,0
37,3
38,6
37,5
38,0
37,6
38,0
37,6
36,6
38,7
37,6
40,4
40,4
39,3
41,6
39,4
383
41,0
41,2
41,2
42,7
413
42,1
40,5
41,6
40,6
40,6
41,6
41,3
41,4
40,7
39,4
40,7
39,0
47,7
49,1
54,1
52,0
52,5
57.Ì
50,4
42,5
50,8
58,1
56,4
51,5
53,9
52,3
60,6
54,4
56,6
54,7
54,8
44,5
53,3
62,3
61,1
52,6
59,3
56,0
59,6
60,0
59,1
59,0
61,9
45,6
57,3
64,9
60,6
57,0
58,1
60,0
66,2
62,9
58,4
60,9
62,3
44,4
49,7
49,7
50,3
50,5
51,7
54,1
52,2
52,2
523
53,2
53,6
53,9
553
53,1
54,6
54,4
54,4
53,9
54,1
55,8
55,8
57,1
56,1
54,0
593
563
56,7
56,9
57,7
583
603
58,2
58,9
58,2
59,4
58,5
59,4
60,3
59,3
603
59,5
58,2
60,2
58,8
-5,1
-3,4
-3,2
-3,9
-«,7
-2,7
-1.3
-3,0
-3,3
-3,0
-2,0
2,5
-5,5
-2,0
-2.5
-3,7
-3,8
-2,7
-1,3
-3,8
-5,3
-5,2
-6,0
-0,6
-10,5
-5,7
-4,9
- 3 3
-7,9
-5,7
-5,8
-4,9
-7,3
-4,4
-4,7
0,1
-8,6
-5,6
-5,7
-5,4
-6,0
-4,7
-2,6
-3,1
-1,7
-2,9
-2.8
-3,4
-4,7
-2,9
-«,1
-3,1
-1,8
-3,1
-3,0
-2.4
-1,4
-1,5
-2,3
-2,7
-2.6
-2.5
-2.6
^ , 2
-4,6
-5.0
-5,5
-5,5
- 6 3
-5,6
-4,6
-6,8
-€,7
-6,0
-6,4
-5,3
-6,3
-4,6
-5,0
-5,3
-5,4
-5,4
-5,3
-4,0
-4,7
-4,1
-4,1
-3,7
(1) As from October 1990, the territory of the Federal Republic of Germany includes the territory of the former German Democratic Republic, including East Berlin.
Community results are drawn up accordingly.
(2) Seasonal Adjustment via X11/ARIMA procedure
GLOBAL TRENDS: Results for August 1992.
In the first eight months of 1992 the United States' deficit was ECU 47.3 billion,
compared with a Community deficit of ECU 41.3 billion, while Japan's surplus
was approaching ECU 54 billion.
■
The cumulative extraCommunity trade deficit from
January to August 1992 reached ECU 41.3 billion,
compared with ECU 53.7 billion for the same period
in 1991. The divergence between the rates of change
for exports and imports, which was nearly 10 points
forthe period JanuaryAugust 1991, became positive
for the corresponding period in 1992 and rose to
more than 2 points.
In August 1992 the extraCommunity trade deficit
was ECU 3.1 billion an improvement of ECU 1.8
billion over August 1991. ExtraCommunity imports
dropped more sharply than exports in August 1992
compared with August 1991 (by 10% and 6% res
pectively). The falMn ecu terms in the cost of the
Community's supplies of crude oil contributed to the
improvement in the extraCommunity balance of
trade between these two periods. Although the cost
of these supplies rose by 2% in dollar terms per
barrel, there was a sharp drop in ecu terms because
of the 16% depreciation of the dollar against the ecu
between August 1991 and August 1992.
The United States' trade deficit from January to
August 1992 was ECU 47.3 billion, a deterioration of
ECU 4.7 billion compared with JanuaryAugust
1991.
The deficit in August 1992 was ECU 8.3 billion, ECU
0.6 billion up on the figure for August 1991. US
exports fell by 12.8%
in August 1992, compared with
a decrease of only 8.5% in imports. In dollar terms
US imports were up by nearly 10%, while exports
rose by less than 5%.
Japan's cumulative surplus forthe first eight months
of 1992 was ECU 53.6 billion, nearly ECO 14 billion
up on the same period in 1991.
In August the surplus was ECU 5.9 billion, compared
with ECU 6.2 billion in August 1991. Japan's exports
were 11.7% down in ecu terms compared with Au
gust 1991, which represents a slight decrease in
terms of the yen (2%) and an increase of more than
5% in dollar terms. Japanese imports showed a
sharp drop of 14.2% in ecu terms compared with
August 1991 equivalent to a fall of nearly 4% in
terms of the yen and an increase of 3% in dollar
terms.
GR.II IMPORTS AND EXPORTS (CIF, FOB)
(annual % change in value)
a·
JÜ
·«■ ■is
I
j j
90
91
91
92
91
92
0108
08
EUR12
90
91
91 92
0108
USA
91
92
08
Imports
90
91
91
92
0148
91
92
JAPAN
D
Exports
COUNTRIES
EUR-12(2)
United Stales**
Japan
BLEU
Denmark
Germany
Greece
Spain
France
Ireland
Italy
Netherlands
Portugal
United Kingdom
EUR-12(2)
United States**
Japan
BLEU
Denmark
Germany
Greece
Spain
France
Ireland
Italy
Netherlands
Portugal
United Kingdom
EUR-12(2)
United Stales
Japan
BLEU
Denmark
Germany
Greece
Spain
France
Ireland
Italy
Netherlands
Portugal
United Kingdom
Memorandum item
1 USDs...ECU
1 YEN
s..
ECU
1990
~*2,9
-95,2
41,2
-5,8
2,4
47,4
-9,2
-20,1
-17,3
2,3
-9,3
0,3
-€,7
-31,9
3,6
-9,3
-8.9
6,0
2.9
10,3
6,0
7,7
4.9
3,8
2,9
5,3
14,0
-1,6
1.6
-6,2
-9,8
2,3
7,8
2,8
-7,8
9.3
3,9
-0,6
4,7
2,0
11,7
4,6
-13,5
-17,3
TABLE I I
-1991
-70,5
-89,5
62,9
-7.2
2,6
9,2
-10,4
-21,3
-15,4
2,7
-10,4
-2,7
-7,9
-22,3
TRADE BALANCE, IMPORTS AND EXPORTS (1)
1992
I
1992
II
1991
01-08
1992
01-08
TRADE BALANCE (Bio ECU)
-19,9
-12,6
22,2
-2,8
0,9
3,2
-2,3
-6,0
-2,4
1,1
-5,1
-0,2
-1,8
-7,2
-16,3
-18,0
•19,3
-1,1
0,9
2,4
-3,1
-«,3
-1,0
1,5
-3,6
-0,9
-2,4
-7,2
-53,7
-42,6
39,8
-5,0
1,5
3,5
-6,0
-14,4
-10,7
1.4
-7,3
-2,4
-5,3
-17,1
IMPORTS
-41,3
-47,3
53,6
-5,4
2,4
8,9
-6,9
-16,4
-4,3
3,3
-63
-1,9
-53
-20,4
1991
08
-4.9
-7,7
6,2
-1,6
0,3
1,4
-0,7
-1,6
-1,1
0,1
0,2
-0,2
-03
-23
%
change o n the corresponding period of the previous year
6,8
1,2
3,7
4,0
4,8
16,6
11
3
9,6
4,3
3,3
2.9
3,7
7,9
-3,6
4,7
13,0
3,9
4,6
7,2
4,2
4,1
13,4
3,3
-0,2
7,2
2,8
9,6
4,6
-2,2
2,4
-9.7
-0,9
-0,9
-3,0
15,2
43
03
0,4
1,7
-2,4
1,6
4,4
8,0
-2,4
7.9
4,2
4,9
21,9
-2,1
8,9
3,7
4,8
3,0
4,7
8,8
-4,0
EXPORTS
-1,1
3,1
-5,9
0,1
0,6
-0,7
9,7
7,4
0.2
-0,4
2,7
-1,0
8.6
3,1
5,0
8,7
10,0
-3,0
-1.1
12,0
16,3
143
1,6
3,9
-1,4
-3,6
4,9
-0,4
% change o n the corresponding period of the previous year
0,9
9.9
12,7
2,6
5,2
2,1
10,5
11,2
5,9
4,8
2.2
1,0
2,4
2,2
6,7
15,9
15,6
-0,3
12,4
4,3
28,0
8,1
9,5
15,3
5,5
2,8
12,1
4,5
3,3
-2,2
2,0
0.7
2,6
1,4
-103
2.8
53
15,8
1,1
-1,0
-3,6
1,2
-1,4
6,1
12,1
3,3
5,7
1,6
10,4
12,1
3,9
1,2
13
1,1
0,6
3,1
EXCHANGE RATE
3,3
1,6
3,7
-0,4
5,5
1,9
4,1
4,7
5,6
14,7
3,4
-0,4
7,9
0,2
2,1
18,4
22,6
-6,0
8,1
5,4
30,3
4,4
3,6
20,0
-0,6
2,2
3,2
03
% change o n the corresponding period of the previous year
23
10,3
6,2
10,4
-6,6
-03
-0,3
10,2
-4,7
1.1
11,9
20,5
1992
08
-3,1
-8,3
5.9
-1,3
0,3
2,7
-0,6
-1,7
-0,8
0,3
1,1
-0,5
-03
-3,4
-10,0
-β,5
-14,2
-3,3
-6,4
-10,7
-15,6
-0.7
-3,6
0,0
-9.1
-63
33,8
-4,2
-6,0
-12,8
-11,7
0,1
-2,2
-4,9
-14,6
-4,6
-1,3
93
2,4
-10,1
0,4
-13,4
-16,1
-9,0
(1) External Trade Statistics (Importe CIF, Exporta FOB).
(2) EUR-12 includes only extra «owe. Figures lor Member States include world flows.
' Estimate.
** CIF component estimated.
: Mot available.
EXTRACOMMUNITY TRADE BY PARTNER COUNTRIES: Results for August 1992.
Trade with the developing countries accounted for twothirds of the improvement
in the extraCommunity Trade deficit between August 1991 and August 1992, and
trade with the industrialized countries for onethird.
The Community's balance of trade with the industria
lized countries showed a deficit of ECU 1.9 billion in
August 1992 compared with ECU 2.5 billion in Au
gust 1991. The deficits with the United States and
Japan fell by ECU 0.3 billion in each case, to stand
at ECU 0.6 billion and ECU 2.1 billion respectively.
The trade surplus with the EFTA countries rose to
ECU 0.7 billion in August 1992, compared with ECU
0.5 billion in August 1991.
ExtraCommunity imports showed a sharp fall
compared with August 1991, but this reference pe
riod is distorted by the aftermath of the Gulf War.
Imports from the industrialized countries were 11.3%
down on the figure for August 1991. Imports from the
United States and Japan showed trends similar to
those of the dollar and the yen against the ecu:
17.4% (16.1% for the dollar) and 10.4% (9% for
the yen) respectively. Imports from the EFTA coun
tries were 5.1% down on August 1991.
Exports to the industrialized countries were down by
9.3%. Exports to the United States and Japan suffe
red from tne appreciation of the ecu against the dollar
and the yen and fell by 13.4% and 5.7% respectively.
Exports to the EFTA countries dropped by 2.8%.
Trade with the developing countries was nearly in
balance in August 1992, with a deficit of ECU 0.1
billion compared with ECU 1.3 billion in August 1991.
The trade deficit with the newlyindustrializing coun
tries in Asia fell by half a billion to ECU 0.2 billion.
Trade with the OPEC countries and the countries of
Latin America showed a deficit of ECU 0.4 billion in
each case, representing drops of ECU 0.3 billion and
ECU 0.4 billion respectively compared with August
1991. Trade between the Community and the Medi
terranean countries was in balance in August 1992,
as was the case with trade with the ACP countries.
Imports from the developing countries fell sharply by
12% compared with August 1991. The depreciation
of the dollar against the ecu helped to lower the
energy bill, and imports from the OPEC countries fell
by 12% as against August 1991. Imports from the
newlyindustrializing countries in Asia were down by
almost 17%, as were imports from Latin America.
Community imports from the Mediterranean coun
tries also snowed a downward trend (9.8%). Imports
from the ACP countries were relatively unchanged
over August 1991 (1.4%).
Exports to the developing countries were 2.5% down
on August 1991. Exports to the Mediterranean coun
tries and the OPEC countries were down by 14.7%
and 6.3% respectively. Exports to the newlyindus
trializing countries in Asia and the ACP countries
were up by less than 1 % in each case, while exports
to the countries of Latin America rose by 4.5%.
Community trade with the countries of central and
eastern Europe showed a deficit of ECU 0.2 billion,
compared with ECU 0.1 billion in August 1991. Im
ports from these countries increased by 4.9%, while
exports rose by only 0.8%.
GR.III EXTRA TRADE BALANCE (MAIN PARTNERS)
(BN ECU)
« · ■
•15 ·■
JAPAN
•
DC
JAPAN
91
92
0108
TABLE III - EUR-12 TRADE BALANCE AND TRADE FLOWS BY MAIN PARTNERS (1)
1991
STRUC-TURE
%
1990
1991
1992
I
1992
II
1991
01-08
1992
01-08
1991
08
1992
08
TRADE BALANCE (Bio ECU)
EXTRA-EC whose
INDUSTRIALIZED THIRD
COUNTRIES
- United States
-Japan
-EFTA
DEVELOPING COUNTRIES
-Asian NICs (2)
-OPEC
- Mediterranean Basin
-ACP
COUNTRIES IN MIDDLE
AND EASTERN EUROPE
EXTRA-EC whose
INDUSTRIAUZED THIRD
COUNTRIES
- United States
-Japan
-EFTA
DEVELOPING COUNTRIES
-Asian NICs (2)
-OPEC
- Mediterranean Basin
-ACP
COUNTRIES IN MIDDLE
AND EASTERN EUROPE
MTRA-EC
EXTRA-EC Whose
INDUSTRIAUZED THIRD
COUNTRIES
- United States
-Japan
-EFTA
DEVELOPING COUNTRIES
-Asian NICs (2)
-OPEC
- Mediterranean Basin
-ACP
COUNTRIES IN MIDDLE
AND EASTERN EUROPE
100,0
59,4
18,6
10,5
22,4
30,4
6,2
9,5
8,8
3,9
7,0
^ 2 , 9
-25,5
-8,6
-23,5
2,8
-9,5
-0,1
-9,5
3,3
-3,5
-2,9
00,0
57,2
16,8
5,2
25,7
33,7
6,1
9,3
10,8
3,8
7,5
1.6
0,9
-1.9
7,5
3,2
2,5
1,5
1,2
12,1
0,1
12,6
3,6
2,0
1.8
-0,2
5,9
5,0
-1.3
10,1
13,8
2,7
10,1
6,3
-70,5
-51,1
-20,7
-29,7
-1,9
-7,6
-4,8
-7,5
2.4
-3,2
-2,7
-19,9
-16,6
-7,1
-7,8
-1,2
-0,6
-0,9
-0,7
0,6
-1,0
0,0
-16,3
-15,2
-4,5
-8,7
-1,4
1.8
-0,2
-0,1
1,0
-0,5
-0,5
-53,7
-36,3
-16,0
-19,5
-1,2
-0,1
-3,0
-5,9
0,8
-2,3
-2,4
-41,3
-36,3
-11,5
-21,2
-2,7
2,7
-1,3
-1,1
2,0
-1,4
-03
-43
-25
-0,9
-2,4
0,5
-1,3
-0,7
-0.7
0,1
-0,1
-0,1
IMPORTS
% change on the corresponding period of the previous year
6,8
6,2
7,9
12,1
2,0
4,4
15,9
4,2
2,8
-4,9
15,1
5,9
4,7
7.4
13,5
9,3
2,1
0,2
3,4
-7.9
-5,1
-1,1
-6,2
5.2
-2,2
-3,8
-10,0
-0,1
-0,3
-2,2
-4,6
-2,2
-4,2
-1,4
5,9
8,0
6,6
6,5
12,1
4,0
6,8
16,3
11,6
9,1
3,6
22,4
-1,1
-1,1
-4,4
1,6
0,5
-3,0
-3,6
-7,4
-5,1
-3,7
2,0
2,9
50
6,4
7,6
9,1
1,0
03
85
4,2
12,5
-19,2
9,5
2,5
2,3 6,5
EXPORTS
% change on the corresponding period of the previous year
0,9
-0,4
-7.0
-2,5
-2,2
6,1
10,3
10,9
0,5
-4,3
17,2
6,7
2,0
11,2
-4,0
-0,8
150
12,4
20,7
4,2
8,0
57
3,3
-2,1
2,7
-8,5
-2,3
10,5
4.0
11,8
-1,3
2,0
12,8
-1,4
-43
-11,1
-4,5
-2,5
0,6
7,8
2,5
-0,9
-6,7
29,0
3,3
-1,4
33
-7,6
-1,7
9,8
6,1
10,2
-0,7
4.4
9,8
2.1
-2,7
-4,8
-7,2
-2,7
4,2
2,4
9,2
3,0
-2,2
49,7
-3,1
-13
-0,6
-Í.1
0,7
-0,1
-0,2
-0,4
0,0
0,0
-0,2
-10,0
-11,3
-17,4
-10,4
-5,1
-12,0
-16,9
-12,0
-9,8
-1,4
43
-2,7
-6,0
-9,3
-13,4
-5,7
-2.8
-2,5
03
-6,3
-14,7
0,8
0,8
(1) External Trade Statistics (Imports CIF, Exports FOB).
(2) Asian NICs include the following countries: Singapore, South Korea, Taiwan and Hong Kong.
* Estimate.
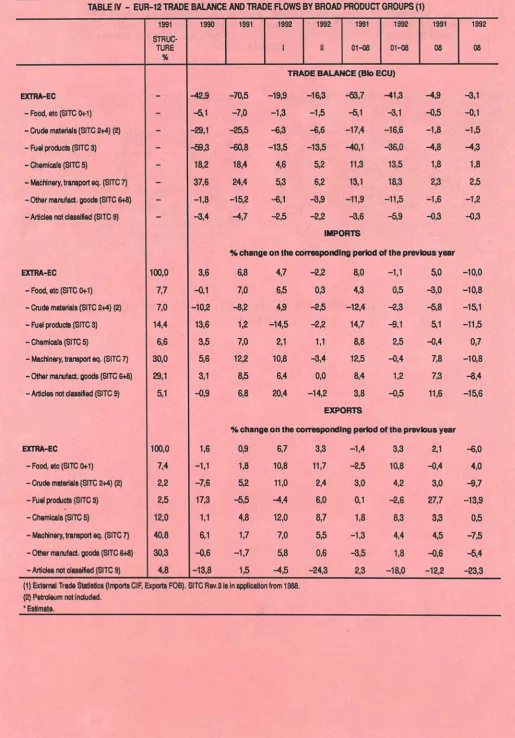
EXTRACOMMUNITY TRADE BY PRODUCTS: Results for August 1992:
Deficits on "other manufactured goods" (SITC 6+8) and "food, etc" (SITC 0+1)
down by ECU 0.4 billion each.
The surplus on "machinery and transport equipment"
(SITC
7)
came to ECU 2.5 billion in August 1992, up
ECU 0.2 billion against August 1991. Trade in "che
micals" (SITC 5) remainedsteady with a surplus of
ECU 1.8 billion. The deficit on "fuel products" decrea
sed by ECU 0.3 billion to ECU 4.3 billion. Trade in
"other manufactured goods" (SITC 6+8) remained in
deficit but improved by ECU 0.4 billion to ECU 1.2
billion. "Crude materials" (SITC 2+4) improved by
ECU 0.3 billion over August 1991 to show a deficit of
ECU 1.5 billion. In August 1992 trade in "food, etc."
(SITC 0+1) was more or less in balance (ECU 0.1
billion), as against ECU 0.5 billion in August
1991 .ExtraCommunity imports showed a downward
trend for ail product groups except chemicals, im
ports of which rose slightly (0.7%). Imports of fuel
products fell by 11.5% because of the depreciation
of the dollar against the ecu. Imports of machinery
and transport equipment were down 10.8% against
August 1991. Imports of "other manufactured goods"
fell Dy 8.4%, while imports of "food, etc." and crude
materials" were down by some 11% and 15% res
pectively.
Exports of machinery and transport equipment fell by
7.5% and those of other manufactured goods" by
5.4%. Exports of chemicals were up by 0.5%, while
those of 'food, etc." rose by 4% over August 1991.
GR.IV EXTRA TRADE BALANCE (PRODUCT GROUPS)
(BN ECU)
«
» ■ ■
a
4
-60
Manufactures
Primgoods
Fuels
Manufactures
10 τ
5
Primgoods
Fuels
Manufactures
91
92
[image:17.595.48.564.22.761.2]
(18)TABLE IV - EUR-12 TRADE BALANCE AND TRADE FLOWS BY BROAD PRODUCT GROUPS (1)
EXTRA-EC
-Food, etc {SITC 0+1)
- Crude materiale (SITC 2+4) (2)
- Fuel products (SITC 3)
- Chemicals (SITC 5)
- Machinery, traneport eq. (SITC 7)
- Other manufact. goode (SITC 6+8)
- Articles not classified (SITC 9)
EXTRA-EC
-Food, etc (SITC 0+1)
- Crude materiale (SITC 2+4) (2)
- Fuel products (SITC 3)
- Chemicals (SITC 5)
- Machinery, traneport eq. (SITC 7)
- Other manufact. goode (SITC 6+8)
- Articles not classified (SITC 9)
1991
STRUC
TURE
%
-100,0
7,7
7,0
14,4
6,6
30,0
29,1
5 1
1990
-423
- 5 1
-29,1
-593
18,2
37,6
-1,8
-3,4
3,6
-0,1
-10,2
13,6
3,5
5 6
3,1
-0,9
1991
-70,5
-7,0
-255
-60,8
18,4
24,4
-152
-4,7
1992
I
1992
II
1991
01-08
1992
01-08
TRADE BALANCE (Bk) ECU)
-19,9
-1,3
-6,3
-13,5
4,6
53
-6,1
-«5
-16,3
- 1 5
-6,6
-13,5
5 2
6,2
- 3 3
-2,2
-53,7
- 5 1
-17,4
-40,1
11,3
13,1
-11,9
-3,6
IMPORTS
-41,3
-3,1
-16,6
-36,0
13,5
18,3
-11,5
- 5 9
1991
08
- 4 3
-0,5
-1,8
-4,8
1,8
2,3
-1,6
-0,3
%
change on the corresponding period of the previous year
6,8
7,0
-8,2
1,2
7,0
12,2
8 5
6,8
4,7
6 5
43
-14,5
2,1
10,8
6,4
20,4
-2,2
03
- 2 5
-2.2
1,1
-3,4
0,0
-14,2
8,0
4,3
-12,4
14,7
8,8
12,5
8,4
3,8
EXPORTS
-1,1
0,5
-2,3
-9,1
2,5
-0,4
1,2
-0,5
50
-3,0
-5,8
5 1
-0,4
7,8
7,3
11,6
% change on the corresponding period of the previous year
1992
08
-3,1
-0,1
- 1 , 5
-4,3
1,8
2 5
-1,2
-0,3
-10,0
-10,8
- 1 5 1
-11,5
0,7
-10,8
-8,4
-156
EXTRA-EC
-Food, etc (SITC 0+1)
- Crude materiale (SITC 2+4) (2)
-Fuel producta (SITC 3)
-Chemicale(SITC5)
- Machinery, traneport eq. (SITC 7)
- Other manufact. goode (SITC 6+3)
- Articles not classified (SITC 9)
100,0
7,4
2,2
2,5
12,0
40,8
30,3
4,8
1,6
-1.1
-7,6
17,3
1,1
6,1
-0,6
-13,8
(1) External Trade Statistics (Importe CIF, Exporte FOB). SITC Rev.3
(2) Petroleum not included.
* Eetimate.
03 6,7
1,8 10,8
5 2 11,0
-5,5 -4,4
4,8 12,0
1,7 7,0
-1,7 58
1,5 -4,5
β in application from 1988.
3,3
11,7
2,4
6,0
8,7
5,5
0,6
-24,3
-1,4
-2,5
3,0
0,1
1,8
-1.3
-3,5
2,3
3,3
10,8
4,2
-2,6
8,3
4,4
1.8
-18,0
2,1
-0,4
3,0
27,7
33
4,5
-0,6
-12,2
-6,0
4,0
-9,7
-13,9
0,5
-7,5
-5,4
-23,3
INDIVIDUAL MEMBER STATES' AND INTRACOMMUNITY TRADE:
Results for August 1992. With an extraCommunity surplus of ECU 1.3 billion
and an intraCommunity surplus of ECU 1.4 billion, Germany led the field
in August 1992.
Germany had the highest extraCommunity surplus
in August 1992 at ECU 1.3 billion, this being double
the figure for August 1991. Italy had an extra
Community surplus of ECU 0.5 billion in August
1992, compared with a figure which was in balance
in August 1991. Denmark and France had slight
extraCommunity surpluses (ECU 0.2 billion and
ECU 0.1 billion respectively), representing an impro
vement of ECU 0.5 billion over August 1991 in the
case of France. Ireland's extraCommunity trade was
in balance in August 1992. Greece and Portuaal had
slight deficits of tCU 0.2 billion and ECU 0.3 billion
respectively. The deficits of Spain (ECU 0.9 billion)
and the BLEU (ECU 0.8 billion) remained more or
less unchanged over August 1991. The extra
Community deficits of the [Netherlands and the Uni
ted Kingdom came to ECU 1.4 billion and ECU 1.7
billion respectively.
IntraCommunity trade decreased by 2.7% between
August 1991 and August 1992, while extraCommu
nity imports fell by 10%.
Germany's intraCommunity surplus was ECU 1.4
billion in August 1992, as against ECU 0.7 billion in
August 1991. The Netherlands had a surplus of
nearly ECU 1.0 billion, which was ECU 0.4 billion
down on August 1991. Italy's intraCommunity sur
plus was up Dy ECU 0.3 billion, to ECU 0.5 billion.
Ireland and Denmark had surpluses of ECU 0.3 bil
lion and ECU 0.1 billion respectively, while Greece
had an intraCommunity deficit of ECU 0.4 billion in
August 1992. The BLEU, Portugal, France and Spain
all had deficits of less than a billion ecus. The United
Kingdom's balance of trade deteriorated by nearly a
billion ecus to show the largest intraCommunity
deficit of ECU 1.7 billion.
GR.V MEMBER STATE'S EXTRA AND INTRA TRADE BALANCE
(BN ECU)
J H
■ ; . · ■ · ■¡ÍS¡
IHU
1 9 9 1 OB
IML. R
I
I
1992-OB
3
G R
TABLE V - EXTRA - AND INTRA - EC TRADE BALANCE (1)
1990
1991
1992
1992
II
1991
01-08
1992
01-08
1991
08
1992
08
TRADE BALANCE (Bio ECU)
EUR-12
-extra
-intra (2)
BLEU
-extra
-intra
DENMARK
-extra
-intra
GERMANY
-extra
-intra
GREECE
-extra
-intra
SPAM
-extra
-intra
FRANCE
-extra
-intra
IRELAND
-extra
-intra
ITALY
-extra
-intra
NETHERLANDS
-extra
-intra
PORTUGAL
-extra
-intra
UNITED
KINGDOM
-extra
-intra
^»23
-63
-6,3
0,1
1,6
0,8
23,0
24,0
-33
-^
-11,5
-9,2
-2,0
-143
-0,1
2,4
-50
-4,3
-18,5
18,0
-2,8
-4,1
-18,0
-14,0
-70,5
-14,7
-7,2
-0,6
1.2
1,4
6,2
2,6
-4,4
-6,0
-12,5
-9,3
-33
-103
-0,2
23
-6,2
-4,3
-20,5
17,1
-2,8
-53
-20,2
-2,2
-19,9
-2,8
-2,1
-0,8
0,3
0,6
0,6
2,6
-0,9
-1,4
-«,3
-2,7
-1,1
-1,1
0,2
0,9
-2,1
-2,9
-50
4,7
-0,6
-1,3
-58
-1,4
-16,3
-5,1
-1,6
0,3
0,2
0,6
1,2
1,1
-1,2
-2,0
-3,4
-23
0,4
-1,3
0,3
1.2
-1,1
-2,5
-4,6
3,5
-0,8
-1.6
-57
-1,6
-53,7
-9,6
-55
0,0
0,4
1,0
2,3
0,9
-2,3
-3.7
-8,8
-6,0
-4,2
-6,1
-0,3
1,7
-4,8
-2,5
-14,1
11,2
-13
-3,5
-14,5
-2,6
-41,3
-12,8
-4,8
-03
03
1,5
3,8
43
-2,6
-4,2
-8,5
-73
0,8
-4,8
0,6
2,7
-2,1
-45
-12,6
10,3
-1,8
-4,0
-14,8
-57
-43
-1,4
-0,8
-0,8
0,2
0,1
0,7
0,7
-0,3
-0,4
-03
-0,8
-0,4
-0,7
0,0
0,1
0,0
0,2
-1,6
1,3
-0,2
-0.3
-1,6
-0,8
-3,1
-1,8
-0,8
-0,6
0,2
0,1
1,3
1,4
-0,2
-0,4
-0,9
-0,9
0,1
-0,8
0,0
0,3
0,5
0,5
-1,4
0,9
-0,3
-0,7
-1.7
-1,7
(1) External Trade Statistics (Importe CIF, Exporte FOB).
(2) Intra trade balance not zero due to CIF/FOB recording and asymétrie recordino of bilateral Howe by individual Member States.
* EeSmate.
: Not available.
World trends preliminary figures for the second quarter of 1992:
There was a deterioration of ECU 3.2 bn in the Community's current account
balance In comparison with the same period of 1991, bringing the current deficit to
a total of ECU 15.2 bn. The US current account recorded a deficit of ECU 12.5 bn, a
deterioration of ECU 16 bn. The Japanese current account showed a suplus of
ECU 22.7 bn, a rise of ECU 7 bn.
On the basis of preliminary figures, in the second
quarter of 1992 the Community's current account
recorded an estimated deficit of ECU 15.2 bn, as
against a deficit of ECU 12 bn in the second quarter
of1991.
The deficit on invisible trade rose sharply from ECU
1.6 bn in the second guarter of 1991 to ECU 8.5 bn
in the same period of 1992. While the Community
deficit on invisibles was relatively low in the second
quarter of 1991 owing to British receipts in connec
tion with the Gulf War, the German deficit on invisi
bles rose by ECU 3.3 bn, of which ECU 1.1 bn was
attributable to travel and ECU 1.4 bn to miscella
neous services.
In contrast, the Community's visible trade balance,
in deficit to the tune of ECU 6.7 bn, showed an
improvement of ECU 3.7 bn in comparison with the
second quarter of 1991. In the period under review,
the various Member States experienced contrasting
trends: the German visible trade surplus rose by
ECU 3.5 bn; the French visible trade balance went
into surplus with an increase of ECU 2.5 bn; the
Danish and Dutch surpluses rose by ECU 0.4 bn and
0.5 bn respectively, while the UK deficit worsened by
ECU 1.6 bn and the Greek deficit by ECU 0.7 bn.
In the United States, the current account showed a
deficit of ECU 12.5 bn in the second guarter of 1992
(US$ 15.9 bn), as against a surplus of ECU 3.5 bn in
the same period of 1991 (US$ 4.2 bn). The visible
trade deficit totalled ECU 16.3 bn (US$ 20.8 bn), as
against ECU 11 bn (US$ 13.1 bn) in the second
quarter of 1991, while invisibles showed a surplus of
ECU 3.8 bn (US$ 4.9 bn), as against ECU 14.6 bn
(US$ 17.7 bn). The deterioration on invisibles is
largely due to transfers, which generated a signifi
cant surplus in 1991 owing to payments in connec
tion with the Gulf War. In comparison with the 1990
figures, the US balance on invisibles showed an
improvement in 1992 owing to a larger surplus on
services.
In the second quarter of 1992, the United States
recorded a significant net capital inflow of ECU 27
bn (US$ 34.4 Dn). However, the high level of errors
andomissions (ECU 15.7 bn) casts some doubt on
the reliability of these figures.
In the second quarter of 1992, the Japanese current
account surplus totalled ECU 22.7 bn (US$ 28.8 bn,
YEN 3 752 bnl in comparison with ECU 15.7 bn in
1991 (US$ 18.7 bn, YEN 2 585 bn). The visible trade
balance rose by ECU 5.1 bn to around ECU 25 bn
(US$ 31.5 bn, YEN 4106 bn), a level at which it has
peaked in the last three quarters. The deficit on
invisibles fell by ECU 1.8 bn and came close to
balance. This was entirely due to investment income,
which generated a record surplus of ECU 7.5 bn. In
the second quarter of 1992, the Japanese balance
of payments recorded a net capital outflow of ECU
23.4 bn (US$ 29.8 bn, YEN 3 882 bn).
Balance of payments of the EC, USA and JAPAN ¡developments on main balances
(billion ecu)
■ % ¡current balance
: capital balance
•^K— : reserves
EUR 12
USA
JAPAN
'Estimates
[image:23.595.51.563.26.772.2]