BCN
IC
HPBRS
COMMISSIOTII OF THE EUROPEAN COMMUTIITIES O OIRECTORATE-GEI{ERAL FOR ECOTTOMIC AND FIIUANCIAT AFFAIBS
Number 85 August 1991
Are
we at the beginning of a new long term expansioninduced by technological change?
"Economic Papers" are written by the Staff of the Directorate' General for Economic and Financial Affairs, or by experts working in assoc iation with them. The "Papers" are intended to
increase awareness of the technical work being done by the staff and to seek comments and suggesfions for f urther analyses'
They may not be quoted without authorisation. Views expressed represent exclusivety the positions of the author and do not necessa rily correspond with those of the Commission of the European Communities. Comments and enquiries should be addressed to:
The Directorate-General for Economic and Financial Affairs, Commission of the European Communities,
Number85 August 1991
Are we at the beginning of a new
long term expansion
induced
bytechnological change?
Angelo Reati*
Internal Paper
* Principal Administrator at the Directorate-General for Economic and Financial Affairs.
The author wishes to thank P. Buigues, A. Dramais, I. Gouverneur, M. Macioti, M. Mou, R. Mouink, M. Ricottilli and P. Skott for conunenting on the fli'St version of the paper. He also thanks R. Petrella for a very useful discussion at the beginning of this work. He is grateful to D. Blades, M. Hainaut, R. Nilsson and G. Salou of OECD for providing some data and to D. Gordon for the linguistic revision.
Summary
List of Tables
List of Figures
CONTENTS
INTRODUCTION 1
PART I : The lessons from the past : empirical evidence and theories 3
I. The long waves : a real phenomenon
1
31.
2.
3.
Chronology of long waves
The empirical evidence : rejections The empirical evidence : confirmations
3
4 7
ll. The explanation by the technological revolution 8
1. Technological revolution and technological paradigms 8 2. The characteristics of technological revolutions 9 3. The propensity to innovate during the phases of the long wavc9
4. Innovations overcome depression 10
5.
Putting things together : Mandel's synthesis 116. The empirical evidence on the waves of innovations 12
m.
A complementary approach : the role of institutions1. Techno-economic versus technological paradigm 2. The theory of regulation
3. The "Social Structure of Accumulation"
IV. Some other features of long waves
1. The dynamics of the rate of profit 2. The business cycle
17
17
18
19
20
20
I. Introduction 24 2. The innovation in computer and information technologies 25
3. The cluster of radical innovations of the eighties 26
4. Empirical evidence 27
5.
The obstacles to the diffusion of the technological revolution30n.
The recovery in profitability 32a) Methodological aspects
I.
The rate of profit of fixed capital and its components 322. The influence of the business cycle 33
b) Evidence
3. The general increase of profitability since 1982 35 4. The influence of capacity utilization in manufacturing 40
5.
The determinants of the rate of profit in manufacturing 406. The profitability in the sectors at the core of the technological
revolution 44
m.
The behaviour of the business cycles 481. Introduction 48
2. The length of the present prosperity phase. Comparison with
those of the long upswing 48
3. Evidence on the varying pattern of the business cycle 54
IV. Conclusions
I.
2.
3.
4.
5.
References
The long wave : an interesting and plausible approach The present situation : the main features of long waves A summary of the mechanism
Other positive factors Problems and uncertainties.
57
57
51
58
59
59
LIST OF TABLES
Page
Table 1 The long waves chronology 5
Table 2 The propensity to innovate during the phases of
the long wave
10
Table 3 Invention and innovation cycles
14
Table 4 Indications of the spreading of the technological
revolution
29
Table
5
The evolution of the rate of profit 36Table 6 The rate of profit and its components in manufacturing
industry
41
Table 7 The evolution of profitability in the branches at the core
of the technological revolution
47
Table 8 Business cycles chronology
50
Table 9 Average length of the phases of the business cycles during
Page
Figure 1 Dlustration of perspectivistic distortion 6
Figure 2 Frequency of basic innovations 16
Figure 3 The rate of profit in the long wave 22
Figure 4 The rate of profit of fixed capital : Germany 37
Figure
5
The rate of profit of fixed capital : France 37Figure 6 The rate of profit of fixed capital : Italy 38
Figure 7 The rate of profit of fixed capital : UK 38
Figure 8 The rate of profit of fixed capital : USA 39
Figure 9 The rate of profit of fixed capital : Japan 39
Figure 10 The influence of capacity utilization on profitability
in manufacturing : Germany 42
Figure 11 The influence of capacity utilization on profitability
in manufacturing : France 42
Figure 12 The influence of capacity utilization on profitability
in manufacturing : Italy 43
Figure 13 The influence of capacity utilization on profitability
in manufacturing : UK 43
Figure 14 The rate of profit and its components in manufacturing :
Germany
45
Figure 15 The rate of profit and its components in manufacturing :
France 45
Figure 16 The rate of profit and its components in manufacturing :
Italy 46
Figure 17 The rate of profit and its components in .manufacturing :
(2)
SUMMARY
Referring, as a general background, to the long waves theory, the paper shows that Western economies now seem to be in the recovery phase of the long stagnation which started in 1974 and that, probably, a new long wave will begin in this decade.
The main factor justifying this hypothesis is the technological revolution in computer and information technologies initiated in the Seventies, which reproduces the long waves mechanism.
Two other elements corroborate the above assessment on the long term prospects :
i) the recovery in profitability at the beginning of the eighties, an evolution that usually characterizes the recovery phase of the long stagnation;
INTRODUCTION
Since 1982 the business cycle in the Community has been expansionary.
From 1974 to 1982, the EUR-12 GDP and industrial production average
growth rate at constant prices was 1. 9% and 0. 8% per year, while from 1982
to 1990 the growth of GDP and of industrial production was 2.7% per year.
Similarly, gross investment, which declined at the average rate of 0.2% per
year from 1974 to 1982, increased by 4.0% per year from 1982 to 1990.
Recent years have also contributed to a slight reduction in the unemployment
rate (9% in 1989 as against 10-11 % in the second half of the Eighties) and to
a small increase in employment (1.4% per year from 1986 to 1989).
The question thus raises whether this expansion is purely short term or
whether it is the second phase of the long term stagnation (the recovery) which
started in 1974. Were the answer positive, a new long term expansion could
start in the present decade. The diagnosis of how the present situation will
evolve has profound implications for economic policy. If the present recovery
is not just a short term phenomenon, the conventional approach of demand and
supply management is no longer relevant, and the main focus of Community
and national actions will instead be on technological change, industrial policy
and the institutional and social changes required to implement the new regime
of accumulation.
The analysis will be conducted within the theoretical framework of long
waves (Van Duijn 1983). Although still controversial, the recent empirical
work on the existence of long waves in production and innovations have made
this approach sound enough to be taken as a background for the present
investigation.
In part I of this paper I shall present a brief summary of the long wave
theory, focussing on the effects of technological change. Part II will present
2
-in the n-ineties. They are: the technological revolution -in computer and
information technology, the recovery in profitability and the different
PART I
THE LESSONS FROM THE PAST :
EMPIRICAL EVIDENCE AND THEORIES
The results of researches on long waves in output<l) can be
summarized as follows :
a) the long term evolution of the industrialized capitalist economies has
followed a quasi-cyclical pattern (wave) of 50-60 years;
b) one of the fundamental causes of the long upswing is a "technological
revolution", which presents these characteristics:
- radical innovations do not appear at random but show a precise time
pattern, correlated with the economic long waves;
- innovations cluster;
- the radical innovations which materialize first are process and
product innovations in existing industries; they are followed by
product innovations giving rise to entirely new industries;
c) to be successful, technological revolutions require profound institutional
changes;
d) the rate of profit plays an important role in the long wave mechanism;
e) the business cycle behaves differently according to the phases of the
long wave.
I. The long waves : a real phenomenon ?
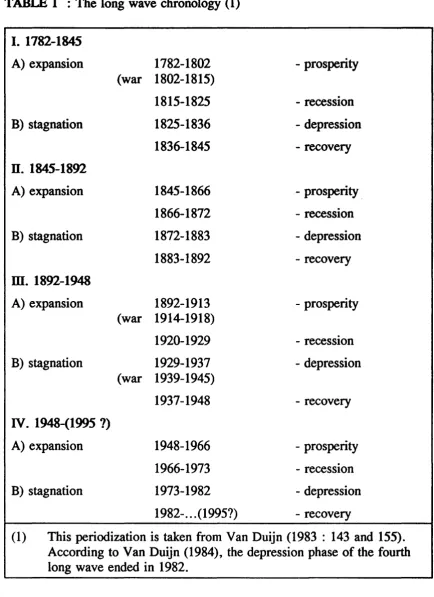
1. The statistical data of developed countries show a quite regular recurrence
of 25-30 year periods of sustained growth followed by periods of stagnation
of the same duration. Since the industrial revolution, these fluctuations have
produced four long wages (table 1) (see Van Duijn, 1983 : 143 and 155; 1984.
4
-Each long wave develops in four phases:
prosperity, in which growth is high;
recession, in which growth decelerates;
depression, in which growth is near zero or even negative;
recovery, in which the growth rate is modest.
According to Van Duijn (1983), prosperity and recession form the long
expansion while depression and recovery belong to the long stagnation.
2. However, the existence of long waves in "real" variables is contested,
particularly for the first long wave<2). For instance, taking data for the UK,
France, Germany and the U.S.A., Solomou (1987) and Van Ewijk (1982)
reject the hypothesis of a 50 year cycle in GOP or industrial production<3
>.
Note that empirical testing of long waves is a tricky question. Quite
often, scholars use spectral analysis (e.g. Van Ewijk, 1982), a method
specially devised to study cyclical movements. However, when applied to
long waves, this method presents serious drawbacks because: a) the statistical
series are not sufficiently long, since they cover a maximum of four waves;
b) they do not meet the demands of a stationary series and the elimination of
the trend can affect the identification of peaks<4
>;
c) this method implies aregularity of cycles that does not actually happen and that, moreover, is not
indispensable in order to confirm the occurrence of long waves. For these
reasons, Van Duijn concludes that "spectral analysis cannot prove or disprove
TABLE 1 : The long wave chronology (1)
I. 1782-1845
A) expansion
B) stagnation
II. 1845-1892
A) expansion
B) stagnation
m.
1892-1948A) expansion
B) stagnation
IV. 1948-(1995 ?)
A) expansion
B) stagnation
(war (war (war 1782-1802 1802-1815) 1815-1825 1825-1836 1836-1845 1845-1866 1866-1872 1872-1883 1883-1892 1892-1913 1914-1918) 1920-1929 1929-1937 1939-1945) 1937-1948 1948-1966 1966-1973 1973-1982
1982-0 0 0 (1995?)
- prosperity
-recession
- depression
-recovery
- prosperity .
-recession - depression -recovery - prosperity -recession - depression -recovery - prosperity -recession - depression -recovery
(1) This periodization is taken from Van Duijn (1983 : 143 and 155).
According to Van Duijn (1984), the depression phase of the fourth long wave ended in 1982.
This is just an example of the more general problem that the statistical
method adopted is not neutral with respect to the results we obtain. I am
[image:13.577.60.494.92.689.2]6
-distortion" (Reijnders 1990). As Slutsky demonstrated, the smoothing
procedure can, in fact, generate cycles of different length which are not
embedded in the original series. The "perspectivistic distortion" depends on
the time span of the statistical investigation (the "window"): a large "window"
will emphasize the long cycles while a narrow "window" does the opposite.
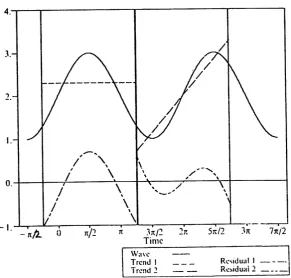
This is illustrated in figure 1. Starting from a strictly periodic time series
(with a period of
2-n-),
a linear trend is fitted in order to derive the cycle. Itappears that the apparent duration of this cycle is dependent on the length of
the interval (the "window") and of its location relative to the series. Thus,
with a "window" having a length of
21t
we obtain the cycle of the left -handside of fig. 1; with a shorter "window", in which the length concides with one
of the points of inflection of the original data, the resulting cycle is depicted
[image:14.575.89.381.462.740.2]in the right -hand side of figure 1.
FIGURE 1: mustration of perspectivistic distortion
(Reijnders 1990, p. 137)
4 . - - - . . - - - , - - - . , - - - ,
J.
2.
-I. - n/2.. 0 n/2 1t Jn/"2
Time
Wave
Trend I
Tr~nd:!
2r.:
Rc,iduall
-(3)
However, W. Stier has recently proposed a new filtering technique that
should avoid these two ambushes and, as we will now see, this allows for
more positive results on the existence of long waves.
3. Using a new methodology, Bieshaar and Kleinknecht (1984), Gerster
(1988), Metz (1992) and Thompson (1990) provided evidence in favour of the
long waves hypothesis. Using a technique similar to the "spline" regression
(cf. Poirier 1976), Bieshaar and Kleinknecht studied 11 series of GDP and
industrial production in seven core countries as well as for the world aggregate
to establish whether they follow the periodization of table 1 above. The
results confirm the existence of long waves after 1890, except for the UK.
Metz and Gerster made further methodological progress by adopting
Stier's filtering technique to detrend data. Metz (1992) took the same series
as Bieshaar and Kleinknecht, but he substituted the data for the two world
wars (considered as a statistical disturbance) by linear interpolation. He
obtained clear and conclusive evidence not only for the existence of the third
and fourth long waves, but also for the first and the second. However, the
first two long waves seem to have a different periodization than that shown in
table 1: the first wave ends in 1820 (instead of 1845) and the second in 1885
(a date near to 1892, as reported in table 1), with a peak in 1860.
Investigating a larger sample (130 price and production series for 16
countries), Gerster reached results that are similar to those of Metz. However,
unlike this author, in the majority of cases Gerster found cycles of 30-40
years, shorter than long waves. According to Metz, these discrepancies are
explained bu the different treatment of world wars (Gerster does not eliminate
these disturbing influences) and different definitions of possible cyclicity.
The idea behind the evidence provided by Thompson (1990) is that long
waves materialize first in a small number of leading sectors (those created by
the technological revolution; see paragraph 2 below), in a leading economy
8
-production of ten leading sectors from 1760 to 1985, Thompson compares the
long waves of the leading sectors growth rates to the conventional
Schumpeterian periodisation (as revised by Kuznets and Van Duijn). He
obtains two main results. First of all, there is a good match between the
Schumpeterian long waves and the waves of the leading sectors in the leading
economies (Thompson 1990 : 222). Second, there is also close
correspondence between the long wave in British-American leading sectors
production and British-American industrial production (id. : 223). This bears
out the assumption that leading sectors are one of the principal engines of
economic growth.
Even if the final word has not yet been pronounced, it is reasonable to
conclude that "today more skepticism is needed to disbelieve in long waves
than faith to believe in them" (Screpanti 1984 : 519).
ll. Explanation in terms of technological revolutions
1. The Schumpeterian explanation of long waves as a result of a
technological revolution seems the most interesting (Schumpeter 1977). This
theory has recently been taken up by a number of scholars (Mensch 1979, Van
Duijn 1983, Kleinknecht 1987, Freeman and the SPRU group, Mandel1980,
who incorporates it into a broader synthesis) and has also found empirical
support.
Economic history shows, in fact, that each long wave is rooted in a
radical breakthrough in technology which has pervasive effects throughout the
economy. The new "technological paradigm"(S) resulting from this
technological revolution makes all existing plant and equipment obsolete,
requiring massive investment to replace them. This initial impetus to
economic activity and its multiplier effect provide the basis for the upswing in
output.
revolution); the second one by steam power and the railway; the third long
wave resulted from electrical and heavy engineering and the fourth from the
Fordist mass production. It will be seen later that the fifth long wave will
probably result from computer and information technologies.
2. The technological revolution presents the following characteristics<6
>:
a) it brings with it many clusters of radical and incremental innovations in
related fields<7
>.
This bunch of innovations- which directly or indirectly aregenerated by the first technological revolution and help to implement it
-further sustain economic activity by the investment it requires;
b) it relies on the availability of a particular input (or set of inputs) which
is the key factor of the new technological paradigm. It is supplied at low and
falling relative cost in almost unlimited quantities over long periods and has
a potential for use in many products and processes throughout the economic
system. These particular inputs were, respectively: cotton and pig iron in the
first long wave; coal and transport in the second; steel in the third and oil in
the fourth.
There is no unanimity among scholars on the way in which the
technological revolution imposes itself. For some (Van Duijn, Kleinknecht,
Mandel) it is through discontinuous waves of innovation; for Freeman (1982)
the new technological paradigm emerges gradually within the old, showing its
decisive advantages during the stagnation phase of the previous long wave.
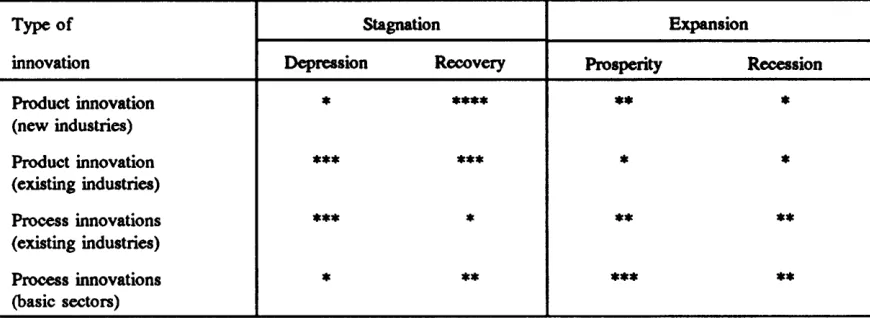
3. Van Duijn (1983) shows that, during the depression phase of the long
wave, the major innovations tend to appear in the existing industries and they
concern the process as well as the product. During the recovery, the number
of major process innovations in existing industries falls radically, while the
flow of product innovations continues. However, the dominant feature of this
phase is the appearance of radical product innovations which create new
1 0
-accordance with the schema of Table 2.
TABLE 2 : The propensity to innovate during the phases of the long wave
(Van Duijn 1983 : 137)
Type of Stagnation Expansion
innovation Depression Recovery Prosperity Recession
Product innovation * **** ** *
(new industries)
Product innovation *** *** * *
(existing industries)
Process innovations *** * ** **
(existing industries)
Process innovations * ** *** **
(basic sectors)
The more stars the greater the propensity to innovate.
4. At first sight, it appears paradoxical that the wave of radical innovations
starts during the depression, just when the rate of profit is at its lowest level
and the outlook for demand is gloomy. Mensch (1979) gives a reply noting
that when depression reaches its deepest point and enterprises have a very poor
(or even negative) profit- ability, they are faced with a choice: either they
innovate, bringing the rate of profit to a normal level or they disappear<8
>.
Innovations overcome depression.
Kleinknecht (1987) completes the argument with the observation that,
during the expansion, two contradictory factors come into play. On the one
hand, favourable prospects could encourage innovation." On the other, as long
as the established lines of production are running well, firms have no incentive
to bring out radically new products and find it more profitable to concentrate
innovation and R&D efforts on gradual improvements within those lines. In
this situation, the aversion to radical change is reinforced by the fact that new
technologies often represent an uncomfortable substitution giving rise to
[image:18.576.76.511.203.362.2]when the first wave of radical innovations is fully implemented, there is no
other one to take over.
How an economy moves out of this period depends on the intensity of
risks and incentives: a prolonged depression with market saturation and
overcapacities for established products may force firms to find new ways of
creating a new technological paradigm.
5.
For Mandel (1976;1980) also, the technological revolution isfundamental in explaining the long waves, although he places this factor in a
broader synthesis which is worth mentioning.
The rate of profit is the gravitational centre of Mandel's analysis: a
long waves theory is. necessarily a theory of the accumulation of capital, and
the relationship between the latter and the rate of profit is very close (Mandel
1980 : 9). The massive implementation of radical innovations is in fact
possible on two conditions: 1) an exceptional long term increase in the actual and expected average rate of profit; 2) a long term expansion of demand.
The first condition depends on some exogenous factors and this results
in the non-automatic characters of long waves. They are:
a sudden and large decrease in the "organic composition of capital" <9)
by a massive penetration of capital in sectors or regions where this
composition is low, or by a decrease of prices for fixed capital and raw
materials;
an exceptional increase in the rate of surplus value(lO), resulting, for
instance, from a radical defeat of the working class or from an increase in
work intensity;
a sharp reduction in the rate of turnover of circulating capital (Mandel
1976, t. I : 224-225).
The long term expansion of demand results from the rapid pace of
capital accumulation induced by the increase in profitability as well as by an
1 2
-profit's growth in that it does not exceed productivity gains.
However, the factors which have determined the long expansion tend
to tum into the opposite. The generalisation of the technological revolution
has many detrimental effects on profits, since the organic composition of
capital increases, technological rents vanish and productivity growth levels
off. This decrease in profitability is accentuated still more by an increase in
prices of raw materials, the absorption of actual and potential excess labour
supply as well as stronger worker resistance to new labour processes. In these
circumstances, wage increases necessarily lead to a fall in profitability; at the
same time social conflicts and competition between enterprises become more
acute01). The falling rate of profit breaks the pace of capital
accumulation. Unlike expansion- that, as already noted, essentially depends
on exogenous factors -the transition to stagnation is thus endogenous.
Referring to the third and fourth long waves, Mandel (1980 : 32-33)
also shows that international economic relations are characterized by the
presence of a hegemonic country and a stable monetary system during the long
expansion while, during the stagnation, there is monetary instability and an
erosion of the dominant power.
6. Mensch (1979) and Van Duijn (1983) were among the first to make a
systematic empirical test of the Schumpeterian theory of long waves produced
by radical technological changes. Mensch's analysis was deepened by
Marchetti (1980; 1988). All obtained evidence favourable to the long wave
approach. Their results were nevertheless challenged by Solomou (1986);
recently, Kleinknecht (1990) provided new evidence which neutralizes
Solomou' s objections
a) Mensch studied a sample of 127 basic innovations from 1740 to 1960
(Mensch 1979 : 124-129)(12); grouping them by decades one can see clear
peaks in the frequency of innovations during the depression periods.
(1981) on the grounds that he unjustifiably omitted a number of basic
innovations and inventions and that there is a high degree of ambiguity on the
dating of some invention and innovations. However, the revised estimate
made by Clark et al. did not invalidate the finding that innovations bunch but
rather the fact that this becomes apparent during the depression (see also
point c below)
b) Mensch's sample was further analysed by Marchetti (1980), who
obtained some other interesting results. The first one is just an alternative way
of presenting Mensch's findings: Marchetti shows, in fact, that in each long
wave, the number of basic innovations follow a logistic curve. The second
result concerns the inventions which precede the innovations of the sample.
It is usually thought that inventions do not follow a particular time pattern.
On the contrary, Marchetti discovers that inventions are also organized in
clusters which can be analysed logistically. The only difference with respect to innovations is that the slope of the two logistics is not the same.
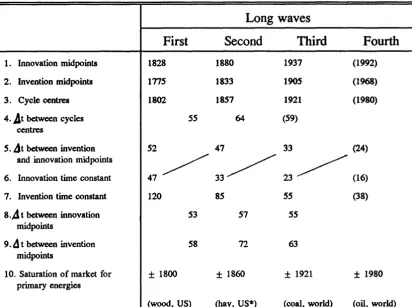
Marchetti deepens his analysis by calculating, for each long wave, the
innovation and invention midpoints, i.e. the dates when 50% of innovations
or inventions were in existence, as well as the innovation and invention "time
constant", defined as the number of years taken for innovations (inventions)
to increase from 10% to 90% of their maximum level. His results are
-
14-Table 3 : Invention and innovation cycles
(Marchetti 1980 : 272)
Long waves
First Second Third
1. Innovation midpoints
2. Invention midpoints
3. Cycle centres
4. j t between cycles centres
5. ~t between invention
1828
1775
1802
55
52
1880 1937
1833 1905
1857 1921
64 (59)
47 33
Fourth
(1992)
(1968)
(1980)
(24)
47~ 33~ 23~(16)
and innovation midpoints
6. Innovation time constant
7. Invention time constant
s.A
t between innovation midpoints9. d t between invention midpoints
10. Saturation of market for primary energies
120
53
58
± 1800
(wood, US)
85 55 (38)
57 55
72 63
± 1860 ± 1921 ± 1980
(hay, US*) (coal, world) (oil, world)
Innovation (invention) midpoints = dates when 50% of total innovations (inventions) of the long wave were in existence
Cycle centre = year at halfway between the invention and the innovation midpoints of the long wave Innovation (invention) time constant = years required for innovations (inventions) to pass from 10% to
90% of their maximum level;& = number of years Figures in brackets are projections
* primary source of energy for draught animals (pre-steam mechanical power)
First, the distance between the midpoints of the cycles corresponds
closely to the conventional duration of long waves (4th row of Table 3).
Second, there is a sharp acceleration in both innovation and inventions. It
appears in fact from Table 3 that the average time lag between inventions and
innovations diminishes sharply (5th row of Table 3) and that innovation takes
less time to bunch (6th row)(l3). Curiously, the innovation time constant
of one wave coincides almost perfectly with the time lag between invention
[image:22.580.84.497.151.458.2](4)
Furthermore, the introduction of new primary energy sources seems in tune
with the innovation waves, with the saturation of the market for primary
energy coinciding with the midpoint of the cycles (1Oth and 3rd row of Table
3).
c) Van Duijn rectified some of Mensch's conclusions by analysing a larger
sample of innovations, encompassing 160 major innovations introduced during
the 19th and 20th centuries (Van Duijn 1983 : 174-179). It appears that, in
the first and second long waves, innovations were more abundant during the
recovery phase (the decades 1836-1845 and 1883-1892) while, in the third long
wave (1892-1948), the cluster of innovations appeared during the depression
of the thirties. In the present long wave innovations seem to be concentrated
in the first part of the prosperity phase (1948-1957). These results,
statistically significant04), induce Van Duijn to reject the existence of a
depression triggering effect (id. : 181).
d) Solomou (1986) challenges Mensch's conclusions more radically. In
fact, relying on Mensch and Van Duijn' s data and applying similar statistical
tests, he infers that there are no regular clusters of innovations during the
depression phases. In his v.iew, radical innovations appear at random:
"structural changes in the twentieth century have been confused with long
waves" (Solomou 1986: 111)<15
>.
e) More recently, Kleinknecht (1987 and 1990) provided new empirical
evidence which conclusively rejects the core of Solomou' s criticism. In fact,
analysing a larger sample of "radical innovations"06) from the beginning
of the nineteenth century to 1968, Kleinknecht reached the conclusion that
Solomou's criticism is plausible only for the early period of capitalism (i.e.
until the first half of the nineteenth century). From 1860 until now the
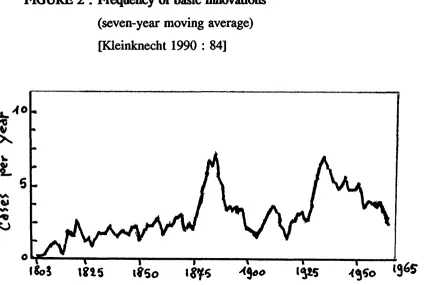
1 6
-depression phase and at the beginning of the expansion. Thus, the period 1881
to 1901 was characterized by a strong performance in terms of radical
innovations and the same happened for the period 1927 to 1962 (see figure
2,
which is slightly simplified with respect to Kleinknecht's original one).FIGURE 2 : Frequency of basic innovations
(seven-year moving average)
[Kleinknecht 1990 : 84]
1it5
tl5o
The scheme is the following (Kleinknecht 1990 : 83), where
"+ + +"
means upswing and "---" downswings<17).
economic wave : 1873 --- 1893 +++ 1913 --- 1939 +++ 1974 --- •••
irvlOvation wave
12 years lead 1861 --- 1881 +++ 1901 --- 1927 +++ 1962 --- •••
[image:24.578.75.501.232.517.2]ill. A complementary approach: the role of institutions
1. It is widely accepted that the technological revolution that will
eventually generate the long upswing cannot be implemented without profound
social, organizational and institutional changes. For instance, Freeman and
Perez emphasize that at the roots of each long wave there is a new
techno-economic paradigm, something wider than the mere technological paradigm.
They observe that "the onset of prolonged recessionary trends indicate the
increasing degree of mismatch between the techno-economic sub-system and
the old socio-institutional framework. It shows the need for a full-scale
reaccommodation of social behaviour and institutions to suit the requirements
and the potential of a shift which has already taken place to a considerable
extent in some areas of the techno-economic sphere. This reaccommodation
occurs as a result of a process of political search, experimentation and
adaptation, but when it has been achieved, by a variety of social and political
changes at the national and international level, the resulting good • match •
facilitates the upswing phase of the long wave. A climate of confidence for
a surge of new investment is created through an appropriate combination of
regulatory mechanisms which foster the full deployment of the new paradigm".
(Freeman and Perez .1988 : 59)(18).
The crucial role of institutions (broadly defined) was systematically
incorporated in a model of long term development of capitalist economies with
the French theory of "regulation" (see Boyer 1986, De Vroey, 1984-85 and
Jessop 1990 for a survey) and its equivalent in the U.S.A, the "Social
Structure of Accumulation" (Bowles, Gordon and Weisskopf 1984; 1986).
While the latter was devised to enrich the conventional explanation of long
waves, the former developed independently and in a competing way from the
long waves approach. However, long waves and regulation seem
1 8
-2. The regulation theory (Aglietta 1976; Boyer and Mistral 1983; Lipietz
1979) studies long term structural change from a systemic viewpoint,
considering the mechanisms which help to reproduce the basic social
relationships of a sytem of historically determined institutional forms<19).
Institutions thus include not only the forms of state intervention and monetary
and credit relationships but also the wage-labour nexus, forms of competition
and the mode of accession to the international system. The interdependence
of the productive organization and the consumption norm (or mode of
consumption) is also emphasized.
The starting point for the regulation theory is similar to that of the long
waves theory : a radical technical change (the assembly-line at the beginning
of this century; automation and "Fordist" mass production in the fourth long
wave) which, however, is not viable without a corresponding change in
consumption. Mass production must go hand in hand with mass consumption,
and the latter must grow steadily. It is then crucially important to have a wage
bargaining procedure which allows a parallel and foreseeable growth of real
wage and productivity. Social consensus is also essential. Social security (the
"indirect wage") makes it much easier to attain this consensus and the scope
increases for State intervention to facilitate capital accumulation. The long
expansion is thus made possible by an "efficient" mode of regulation<20
>.
According to the regulation theory, post -1945 growth was associated
with a regime of intensive accumulation ("Fordism ") with mass consumption;
from the second half of the 19th century until the first world war, capitalism
was characterized by extensive accumulation and, during the 1920s and 1930s,
there was intensive accumulation without mass consumption ("Taylorism").
With the extensive accumulation regime the consumer goods sector is
rather underdeveloped, wage goods being largely provided by the family with
the result that the demand directed to the market is limited. By contrast, the
intensive accumulation regime with mass consumption is based on the parallel
demand for consumer goods are transformed: wage goods are produced using
mass production techniques and the volume and composition of demand adapt
accordingly. Wage goods are now entirely bought on the market.
A "structural crisis" like that of the Seventies and Eighties occurs when
the functioning of regulation conflicts with existing institutional forms, which
then have to be abandoned or bypassed. The contradictions which have undermined the mode of regulation during the last two decades were, first, the
slowdown in productivity growth which eroded the basis of mass consumption
and, second, public finance deficits which called into question the welfare
state, a fundamental piece of social consensus. The institutions for collective
bargaining were no longer effective, inflation became a "toxic drug",
profitability deteriorated, the established hierarchy among nations was upset,
etc. Economic crises manifest themselves as crises of regulation.
Long stagnation will end when the system succeeds in adopting a new
accumulation regime, entirely different from the previous one, and in finding
an appropriate mode of regulation. As in the case of long waves, the outcome
is always uncertain, since transition to a new mode of regulation cannot be
guaranteed in advance.
3. For the "Social Structure of Accumulation" theorists, long upswings
depend on a periodically reconstructed set of institutions (the "Social Structure
of Accumulation") which provides the economic, social and political stability
required for favourable profit expectations and therefore for rapid capital
accumulation. Radical changes in the institutional framework are thus the
necessary conditions for a technological revolution and the ensuing long
upswing.
The erosion of these institutions sets the stage for economic crises:
business cycles are unable to restore the high growth trend of the previous
phase.
2 0
-empirical evidence for their theory considering the postwar U.S. economy. For
this purpose, they devised some statistical proxies of the institutional features
which prevailed in that period, such as: "the capital-labour accord", the "pax
americana" and "the capital-citizen accord". Adding these variables to the
variables reflecting technology and capacity utilization they obtained a more
adequate econometric account of productivity, profitability and investment
behaviour.
IV. Some other features of long waves
Two other elements of long waves are important in order to understand
the present situation: the evolution of profitability and the behaviour of the
business cycle.
1. With regard to the rate of profit, the fundamental question is to know
whether the level and evolution of profitability are a cause or an effect of the
long waves in production<21). Whereas, for the upper turning point of the
wave, we can easily admit that the decline in profitability is one of the main
causes of the transition to stagnation, things are less clear for the upswing.
There are three conflicting interpretations. According to Mandel
(1980), for a new phase of long term growth to start, an exceptional and stable
increase in profitability must first take place. Mensch also considers that the
rate of profit is the cause of the technological revolution and the upswing, but
for differents reasons. Firms introduce radical innovations not because the
rate of profit is high but because it is extremely low and depression is at its
deepest point. The other Schumpeterians (e.g. Van Duijn) believe that the
evolution of profitability is the effect of the long wave movement : the
technological revolution comes first;
it
induces expansion and, with expansion,It is not possible, from the available evidence on the long term dynamic
of the rate of profit (Shaikh 1989; Dumenil, Glick, Rangel, 1987; Poletayev
1992), to settle the question conclusively. However, for the purpose of this
paper, it is not necessary to establish exactly the direction taken by causality.
It is merely enough to know the broad evolution of profitability during the
phases of the long wave movement, particularly during the recovery.
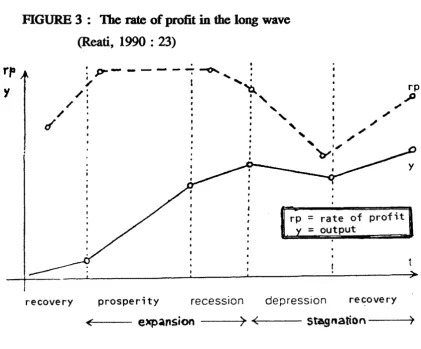
The above mentioned studies show what follows (Fig. 3) :
a) long stagnation is characterized by three separate movements in the rate of
profit:
firstly, a very strong decline during the depression, pushing profitability
to its lowest level;
towards the end of the depression, profitability starts to recover, under
the "curative" effect of the business cycle. The weakest enterprises go
out of business, those who survive restructure and, in this way, the
profitability of the sector improves;
this upward trend continues and accelerates during the recovery. As
noted above, it is not yet clear whether this is the result of the
technological revolution or rather the outcome of some exogenous
factor;
b) during the long expansion profitability develops in stages :
during the prosperity profitability usually stays at high and even using
levels;
during the recession the rate of profit starts to fall and this produces the
turning point in the production trend : thus the effects of one of the
factors underpinning the expansion are exhausted. There are many
causes of this decline in profitability : social conflicts and excessive
wage increases, an overaccumulation of capital in relation to profit
opportunities, a decline in productivity growth, tight labour markets
rp
'I
2 2
-FIGURE 3 : The rate of profit in the long wave
(Reati, 1990 : 23)
.
',.,..---~
.,_
.
'
~
l'~
rp/ t
I'
~/ I . ,
/
'
~d
' ,
;~
recovery prosperity recession
'
~'
~· ·~I
rp
=
rate of profity
=
outputdepression re~overy
y
~<--- expansion --~>
-4:-<---
stagnation ---'1)2. The long wave movement moulds the shape of the business cycle. In
fact, during the long expansion the prosperity phase of the business cycle tends
to be long and/or more accentuated and the recession short and/or less
intensive<23). During the long upswing, the short term recession rarely
leads to a drop in the level of production; instead, there is merely a
deceleration of growth<24
>.
During the long stagnation, the business cycleis characterized by short (and/or mild) periods of prosperity and long and deep
recessions, often giving rise to a fall in the level of activity.
These characteristics of the business cycle in conjunction with long
waves were noted early: Kondratieff had pointed them out as far as 1926
(Kondratieff 1935 : 111) and L.H. Dupriez in 1947 (Dupriez 1966 vol. II :
[image:30.580.71.493.74.423.2](5)
demand for money and credit: "le mouvement long apparait (ainsi) comme
conditionnant le mouvement cyclique; par son action sur Ia demande monetaire
et sur le credit, Ia hausse fondamentale eloigne le moment oil le processus
cumulatif de hausse se resout en crise, rapproche le moment ou le reajustement
de Ia depression est suffisant pour donner cours
a
un nouvel essor; Ia baissefondamentale ecourte Ia hausse en creant rapidement les conditions de repli et
prolonge Ia stagnation" (Dupriez 1966 : 255)<26
>.
Along the same line,Gordon, Weisskopf and Bowles (1983 : 152 and foil.) speak of "reproductive"
and "non-reproductive" business cycles. The former endogenously restore
conditions for rapid accumulation without requiring fundamental changes in the
structure of the accumulation process. In the non-reproductive cycle, on the
contrary, a downturn does not correct itself endogenously and therefore it
requires basic changes in the institutions that regulate the accumulation process
and establish the conditions for profitability. Long swing expansions are
characterized by reproductive cycles, long swing crises by non-reproductive
cycles (id.: 152-153). The fact that a reproductive cycle becomes
nonreproductive signals an erosion of the effectiveness of the institutions of the
2 4
-PARTll
UNDERSTANDING THE PRESENT SITUATION
The main aspect that throws light on the nature of the present recovery
is the technological revolution in computer and information technologies which
started in the seventies. The evidence that appears will be supplemented by
two other elements giving indirect a support to the conclusion that we are now
in the final phase of the long stagnation. They are : the recovery in
profitability and the different behaviour of the business cycte<27).
I. The technological revolution of the Seventies
1. In a recent contribution Marchetti (1988) presents an impressive series
of graphs concerning a wide spectrum of activities and sectors : all show a
logistic curve path, which is in strong accordance with the long wave
periodicity. These waves indicate that, in most cases, the initial impulse of the
present long wave will reach saturation around 1995. If, in a particular
country or activity, the process started later, saturation always arrives towards
the end of the general cycle: latecomers have shorter time constraints
(Marchetti, 1988 :. 3). Marchetti maintains that "we are now witnessing the
1984-2002 innovation wave to be centred in 1993" and that "our ...
[stagnation] should end in 1995" (id. : 2).
Although Marchetti's exercise deserves careful consideration, I think
that we must avoid mechanically extrapolating past tendencies. If we can
safely say that 1995 will be the year of saturation for the impulse of the 1940s,
we need some good reason to infer that a fifth long wave will start around that
year. The question, then, is whether there are signs of a new technological
revolution which coul<l produce the economic upswing in the 1990s<28
>.
innovation(s) will take the form of a technological revolution, since it is only
in retrospect with a certain time-lag that one can decide which are the major
or minor innovations. Nonetheless, we are now witnessing some strong
similarities with the long wave mechanism.
The innovations in the field of computer and information technology
which developed in the 1970s in connection with the large scale application of
micro-electronics present the characteristics of a technological revolution.
They are, in fact, innovations that radically change production methods in an
increasing number of industries and services; this change will be even more
fundamental when the CIM (computer integrated manufacturing) and CAD
(computer assisted design) techniques are further improved and generalized.
Increasing computerization and use of information technologies helps
both to create new industries and to rejuvenate old ones<29). This
innovation can not only push automation to its extreme limits but also:
reduces the scope for technical economies of scale, since it lowers the
minimum optimum scale of plant;
allows for greater flexibility, since the same equipment could produce
a range of differentiated products;
provides higher quality by adding "intelligence" to products
permits a decentralization of production;
extends the "limits to growth" by helping to overcome the obstacles
imposed by scarcity of natural resources
has a strong potential impact on labour organization and labour relations
within the firm. In some instances, direct labour is almost completely
eliminated; in some others, the workers can profitably accomplish a whole
range of operations, giving them a large view and control over the production
process. In any case, the qualifications required are entirely different<30).
The emerging techno-economic paradigm thus makes it possible to
overcome the limitations of the previous one at the productive as well as at the
2 6
-inflexibility of dedicated assembly-line plant and to the obstacles met by mass
production with its intensive use of energy and materials. The organizational
limitations come from the hierarchical departmentalization of large
corporations, which can now be overcome by integrating design, management,
production and marketing into one system <31).
As was the case for the previous long waves, the present technological
revolution possesses its specific key factor (the "chips") available in almost
unlimited quantities at a falling relative price.
Finally, it is easy to see that the computer and information technology
revolution fits in with Van Duijn's scheme (table 1) in the sense that it is a
process innovation appearing during the depression in an existing industry.
3. Computer and information technology was accompanied, in the eighties,
by a cluster of radical innovations<32
>.
They started with the introduction of new materials (optical fibres) and products (laser), developed independentlyof the computer innovation, and we are now witnessing an interesting and
promising combination with the computer (telematics, bio-informatics, sensors
and switches). The convergence of information and computer technologies
adds another significant example (OECD 1989 : 152). Also, the establishment
of networks between information technology-based equipment leeds to a wide
creation of knowledge and know-how in the economy which encourages the
cumulative adoption of many small innovations (id.: 15).
Biotechnology is at least as revolutionary as the computer and
micro-processors. Its potential impact in agriculture is enormous, as genetically
transformed plants could solve the famine problem of the Third World. In
industry, the scope for biotechnology is more restricted, even though
production methods in a wide range of sectors, such as pharmaceuticals,
chemicals, food and drink, will change drastically and it could also be possible
to apply biotechnology to mineral extraction<33
>.
However, it is quitewhich would pull the economy out of the present long stagnation because it is
not yet perfected. For industry and services of the industrialized countries,
most of the far-reaching innovations derived from biotechnology will probably
be implemented at the beginning of the next century, when the
microelectronics paradigm has already become established and produced its
economic effects.
4. Adequate empirical evidence on the present technological revolution
would provide data on the development of the main "carrier branches", on
induced growth sectors as well as on the infrastructures which facilitate the use
of new processes and products everywhere and create appropriate externalities.
This would cover:
as main branches: computers, software, electronic capital goods;
as induced growth sectors: advanced machine tools, measuring,
precision and control instruments, industrial robotics and flexible
manufacturing systems, "avionics", <34) telecommunication equipment, data
banks, information services;
as infrastructures: digital telecommunications networks, satellites;
as other radical innovations: optical fibres, new ceramics, fine
chemicals.
However, the available data are far from being exhaustive: new
products and activities do not fit into the old statistical classifications and,
moreover, they are lumped together with other traditional items. The 3-digit
Eurostat data base VISA, covering industrial enterprises with 20 and more
employees, could provide useful information. Unfortunately, this data base is
not coherent with the national accounts, in which the industrial branches are
at 2-digit and, all things considered, I prefered to rely on the latter source.
The two branches of national accounts whose coverage is not too far from the
sectors at the core of the technological revolution are : office and
2 8
-and electrical goods (NACE R25 code 25). Taken together, they cover the
"main branches" and part of the induced growth sectors, since
telecommunications equipment is included in the electrical goods branch. As
a rough proxy of information services based on the new technologies I have
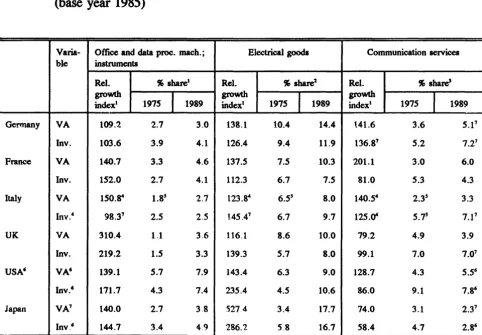
taken the "communication services" (NACE R25 code 67). Table 4 indicates
that the "new technological paradigm" is clearly under way. In fact, if the
growth of value added or investment in the "main branches" is compared with
that in manufacturing from 1975 to 1989, we see that, in all countries, the said
branches were much more dynamic than the average. In the UK the growth
of the office and data-processing machines was particularly strong. In a few
cases (UK and Japan) the communication services grew less than the average.
The medium term outlook is even more favourable. According to BIPE
et al. (1991), for the 1989-95 period the average annual growth rate of output
at constant prices in EUR-12 will be : 8.6% for semiconductors; 6.4% for
data processing equipment; 15.0% for software services; 8.2% for
tecommunications equipment and 6.5 for telecommunication services, whereas,
for GOP and total manufacturing, forecast growth is 2.8% per year.
Concerning the advanced machine tools~ we should note that in 1978
they represented, in the EC, less than 10% of the sector's production value
whereas by 1988, this share amounted to 40% and it is expected that in the
TABLE 4 : Indications of the spreading of the technological
revolution, 1975-1989@ata at constant prices]
(base year 1985)
Varia- Office and data proc. mach.; Electrical goods ble instruments
Rei. % share1 Rei. % share2
growth
I
growthI
index1 1975 1989 index• 1975 1989
Germany VA 109.'2 2.7 3.0 138.1 10.4 14.4
lnv. 103.6 3.9 4.1 126.4 9.4 11.9
France VA 140.7 3.3 4.6 137.5 7.5 10.3
Inv. 152.0 2.7 4.1 112.3 6.7 7.5
Italy VA 150.~ 1.8' 2.7 123.84
6.55 8.0
Inv.4
98.37
2.5 2.5 145.47
6.7 9.7
UK VA 310.4 1.1 3.6 116.1 8.6 10.0
Inv. 219.2 1.5 3.3 139.3 5.7 8.0
USA' VA' 139.1 5.7 7.9 143.4 6.3 9.0
Inv.' 171.7 4.3 7.4 235.4 4.5 10.6
Japan VA' 140.0 2.7 3.8 S27.4 3.4 17.7
Inv.' 144.7 3.4 4.9 286.2 5.8 16.7 . .
Source: EUROSTAT, National accounts ESA (sectoral data base)
Communication services
Rel. " share'
growth
t
index• 1975 1989
141.6 3.6 5.17
136.87 5.2 7.27
201.1 3.0 6.0
81.0 5.3 4.3
140.54
2.35 3.3
125.<t 5.75 7.17
79.2 4.9 3.9
99.1 7.0 7.07
128.7 4.3 5.5'
86.0 9.1 7.8'
74.0 3.1 2.37
58.4 4.7 2.8'
1 Obtained by dividing the index for the individual branch with respect to total manufacturing (for the two industrial branches) or to market services (for the communication services branch)
2 With respect to manufacturing 3 With respect to market services 4 Base year 1980
[image:37.575.43.526.131.466.2]3 0
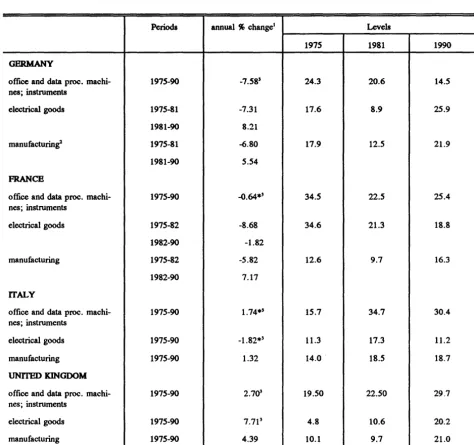
-According to sectoral experts (Hom, Klodt and Saunders, in Sharp 1985 ed. :
55), in industrialized countries advanced machine tools have now passed the
first stage of the logistic life-cycle function and have entered into the
exponential growth phase.
It is interesting to note that the reference to long waves and to the
technological revolution enables us to explain what until now was just
considered as fact : the dichotomy, in the economic evolution of the last
seventeen years, between a small group of Industrial branches for which
demand remained buoyant despite sluggish economic growth, and the others
(Buigues and Goybet 1989). At a 2-digit level of classification these
strong-demand sectors are: office and data processing equipment; electrical and
electronic equipment and supplies; chemicals and pharmaceuticals. The first
two correspond to the main "carrier branches" of the present technological
revolution while the third branch, whose performance essentially reflect the
growth of fine chemicals, is probably linked with the cluster of radical
innovations of the 1980s.
5. We have seen in table 3 that, historically, there was an appreciable
shortening of the time lag between invention and innovation : mechanically
extrapolating past trends 1992 should coincide with the implementation of 50%
of total innovations that will produce the fifth long wave (table 3, row 1).
Things are not going faster because there are several obstacles to the diffusion
of the computer and information technology innovations (OECD 1989 :
170-176). The first, and perhaps the most important one, is institutional.
Managers are not yet prepared to make radical changes in the firm's
organization and production processes in order to adopt the new technologies.
Even when it is decided that the firm should change, it is often difficult to find
"blue or white collar" workers with the appropriate skills to operate the new
equipment.
(6)
not yet as perfected as the producers maintain. The CIM (Computer integrated
manufacturing) technologies, for instance, are still in their early research phase
and we will probably have to wait for about a decade for the emergence of the
supplying industries and the effective demand (Arcangeli 1990).
Thirdly, the new technologies are still too expensive. Even though the
computer revolution started in the 1970s, for many applications it is still too
young for dramatic cuts in the price of new equipment to be possible. For the
time being, the expansion of demand is not strong enough to allow enterprises
to recover the cost of the new investment in a short period of time.
Finally, an essential requirement for the international diffusion of the
information technologies, is the provision of a wideband telecommunications
infrastructure; this condition, which calls for massive investment, has not yet
3 2
-n.
The recovery in profitabilityTwo main questions will be addressed. The first concerns the general
evolution of this indicator : if it accorded with the long wave theory
predictions, this would be another factor supporting the hypothesis that our
economies are in the second phase of the long stagnation. The second question refers to the nature of the recovery which will take place : is it just the result
of the business cycle or is it also an incipient effect of the technological
revolution ?
a) Methodological aspects
1. The most appropriate indicator of profitability is the rate of profit of
capital advanced, i.e. net fixed capital plus the stock of circulating capital.
This measure of profitability is superior to the rate of profit of fixed capital
not only because it provides a more realistic level of profitability but also
because it takes into consideration the influence, on the rate of profit, of
changes in the relative scale of circulating capital<35
>.
At the statisticallevel, the stock of raw materials, finished products and works in progress
forms a close approximation to the stock of circulating capital. Unfortunately
these data are not always easily available and, in any case, they are not
included in the EUROST AT national accounts, which is the source utilized
here. For this reason, the rate of profit (rp) was calculated with respect to the
where: S
-PYA
PK (1)
net profits, current prices
=
VA - W=
net operating surplus<36)K
=
net capital stock at mid-year replacement pricesVA~
PDT
=
VAV::::L
=
QT
KV
PVA and PK
=
net value added, current prices
productivity of labour = VA V /L
net value added at constant prices
total employment
indicator of mechanization = KV /L - net capital stock at constant prices
implicit prices of value added and fixed capital
(2)
(3)
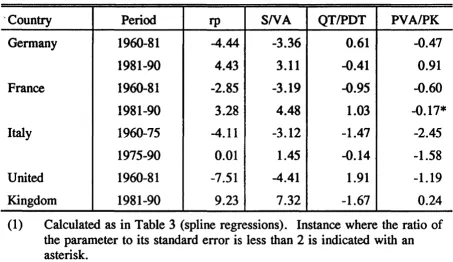
We see that the evolution of profitability depends upon three factors :
the profit share SN A
an indicator of the efficiency of capital accumulation. The ratio
QT /PDT (capital/ output ratio) compares, in fact, the investment to increase
mechanisation (QT, i.e. capital per worker) with its results in terms of labour
productivity. An increase in this ratio exerts a downward pressure on
profitability as too much capital is required to obtain a certain increase in
productivity
the relative prices of value added with respect to the prices of fixed
capital. The evolution of PV A/PK is first of all explained by different
performances of labour productivity in the sector in question as compared with
the sector producing the capital goods for it.
2. For the present investigation it is interesting to ascertain whether the
3 4
-whether it depends on other factors, in particular the technological revolution.
Short-term fluctuations of activity influence profitability in two ways: by the
varying degree of capacity utilization and by the restructuring induced by the
declining phase of the business cycle.
The first effect depends on the so-called "overhead labour": certain
types of labour (administrative, supervisory, maintenance) are employed in
proportion to the capacity of the enterprise, while others (production workers)
are used in accordance with the actual output. When production temporarily
declines, labour-hours of production workers are proportionally reduced; for
the other types of labour, an analogous cut is not easily made, and this raises
the unit cost of production and reduces profits.
The other influence on profitability comes from the "curative" effect of
the business cycle. During the recession, some enterprises go out of business,
the remaining restructure themselves and, in this way, increase their rate of
profit.
To appreciate the importance of the "overhead labour" effect, one can
rectify the rate of profit by dividing it by the rate of capacity utilization and
then compare the evolution of the rate of profit with the evolution of the
corrected ratio. By doing so, we compare the profitability resulting from
potential (full-capacity) labour productivity (PDT*) with actual performance.
In fact, defining the rate of capacity utilization (cu) as: cu = VAVN AV{fJ,.)
where VA V* is potential output at constant prices<37
>,
the rectified rateof profit (rp*) is :
rp* = rp = _§__ PDT* PYA
cu VA QT PK
(5)
where PDT*= VAV*/L
Potential output (VA V*) can be derived from the published figures on
VAV* = VAV/cu (6)
With regard to the second effect of the business cycle, one should be
aware that, unfortunately, it cannot be statistically separated from other
influences, e.g. the repercussion of the technological revolution. The causes
of the recovery of profitability can thus be judged only on a more qualitative
base.
b) Evidence
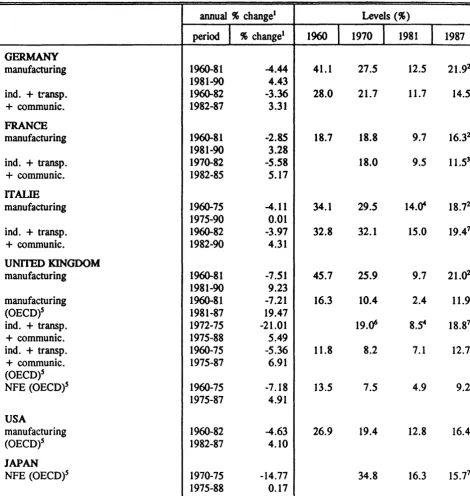
3. As appears in Tables
5
and figures 4 to 8, during the long stagnationprofitability followed, in all countries, an evolution similar to that predicted
by the long waves theory. In fact, in most cases, the fall in profitability ended
in 1981, i.e. towards the end of the depression phase and, from 1982, there
was an important recovery. In Italy (manufacturing) (fig. 6) and UK (industry
plus transport and communications) (fig. 7), the increase in profitability
appeared as early as 1976; the USA economy also experienced a recovery in
profitability from the beginning of the 1980s (fig. 8). Japan departs from this
general trend because, from 1976 to 1988, profitability was flat (table 5 and