White Rose Research Online URL for this paper:
http://eprints.whiterose.ac.uk/114120/
Version: Accepted Version
Article:
Gulenko, A., Forto Chungong, L., Gao, J. et al. (4 more authors) (2017) Atomic structure of
Mg-based metallic glasses from molecular dynamics and neutron diffraction. Physical
Chemistry Chemical Physics , 19 (12). pp. 8504-8515. ISSN 1463-9084
https://doi.org/10.1039/c6cp03261c
[email protected]
https://eprints.whiterose.ac.uk/
Reuse
Unless indicated otherwise, fulltext items are protected by copyright with all rights reserved. The copyright
exception in section 29 of the Copyright, Designs and Patents Act 1988 allows the making of a single copy
solely for the purpose of non-commercial research or private study within the limits of fair dealing. The
publisher or other rights-holder may allow further reproduction and re-use of this version - refer to the White
Rose Research Online record for this item. Where records identify the publisher as the copyright holder,
users can verify any specific terms of use on the publisher’s website.
Takedown
If you consider content in White Rose Research Online to be in breach of UK law, please notify us by
This is an Accepted Manuscript, which has been through the
Royal Society of Chemistry peer review process and has been
accepted for publication.
Accepted Manuscripts are published online shortly after
acceptance, before technical editing, formatting and proof reading.
Using this free service, authors can make their results available
to the community, in citable form, before we publish the edited
article. We will replace this Accepted Manuscript with the edited
and formatted Advance Article as soon as it is available.
You can find more information about Accepted Manuscripts in the
author guidelines
.
Please note that technical editing may introduce minor changes
to the text and/or graphics, which may alter content. The journal’s
standard
Terms & Conditions
and the ethical guidelines, outlined
in our
author and reviewer resource centre
, still apply. In no
event shall the Royal Society of Chemistry be held responsible
for any errors or omissions in this Accepted Manuscript or any
consequences arising from the use of any information it contains.
Accepted Manuscript
rsc.li/pccp
PCCP
Physical Chemistry Chemical Physics
www.rsc.org/pccp
ISSN 1463-9076
PERSPECTIVE
Darya Radziuk and Helmuth Möhwald Ultrasonically treated liquid interfaces for progress in cleaning and separation processes
Volume 18 Number 1 7 January 2016 Pages 1–636
PCCP
Atomic structure of Mg-based metallic glasses from
molecular dynamics and neutron diffraction
†
Anastasia Gulenkoa, Louis Forto Chungb, Junheng Gaoc, Iain Toddc, Alex C. Hannond,
Richard A. Martinb∗, Jamieson K. Christiea,e∗
We use a combination of classical molecular dynamics simulation and neutron diffraction to iden-tify the atomic structure of five different Mg-Zn-Ca bulk metallic glasses, covering a range of compositions with substantially different behaviour when implantedin vitro. There is very good
agreement between the structures obtained from computer simulation and those found experi-mentally. Bond lengths and the total correlation function do not change significantly with compo-sitions. The zinc and calcium bonding shows differences between composition: the distribution of Zn-Ca bond lengths becomes narrower with increasing Zn content, and the preference for Zn and Ca to avoid bonding to themselves or each other becomes less strong, and, for Zn-Ca, transforms into a positive preference to bond to each other. This transition occurs at about the same Zn con-tent at which the behaviour on implantation changes, hinting at a possible structural connection. A very broad distribution of Voronoi polyhedra are also found, and this distribution broadens with increasing Zn content. The efficient cluster packing model, which is often used to describe the structure of bulk metallic glasses, was found not to describe these systems well.
1
Introduction
Since their discovery over 50 years ago1, bulk metallic glasses
(BMG) have been extensively studied2. They are of
signifi-cant fundamental and technological interest due to their excep-tional physical, chemical and mechanical properties. Their amor-phous structure means that they are not limited to specific stoi-chiometries, resulting in a wide range of possible glass composi-tions. This also implies that their macroscopic properties could be continuously variable, hence tunable, within a certain range by changes in the glass composition. One field in which this is potentially very useful is biomedicine3–5.
In this work, we investigate Mg-Zn-Ca glasses which are promising candidates for use as medical implants. They consist of elements found within the human body and the glasses them-selves are known to be biocompatible6,7. Their density and
elas-tic modulus are comparable to that of human bone8, which
min-imises stress mismatch for orthopaedic applications. In addition,
aDepartment of Chemistry, University College London, 20 Gordon Street, London,
WC1H 0AJ, UK
bSchool of Engineering & Applied Science and Aston Research Centre for Healthy
Age-ing, Aston University, Birmingham, B4 7ET, UK Email: [email protected]
cFaculty of Engineering, University of Sheffield, Sir Frederick Mappin Building, Mappin
Street, Sheffield, S1 3JD, UK
dISIS Facility, Rutherford Appleton Laboratory, Chilton, Didcot, OX11 0QX, UK
eDepartment of Materials, Loughborough University, Loughborough, LE11 3TU, UK.
E-mail: [email protected]
Mg-Zn-Ca glasses have a very good glass-forming ability (GFA); the addition of calcium substantially enhances the GFA over that of Mg-Zn binary glass compositions9.
When crystalline magnesium and its alloys are implanted in the body, unwanted and harmful hydrogen gas pockets are gener-ated by the corrosion reaction, which limits the use of these alloys for biomedical implantation. It was recently shown3that
Mg-Zn-Ca glasses rich in zinc (>28 at. % Zn) form a passivating
sur-face layer which prevents the release of hydrogen, implying that these glasses “hold much promise for improving next-generation biodegradable implants”10.
In order to optimise these glasses for use as biomedical im-plants, or indeed for any other application, we need to under-stand how the macroscopic properties of interest depend on the atomic structure of the glass and its composition. Due to the po-tential large impact of these glasses, this has attracted substantial attention, but the structural studies of Mg-Zn-Ca metallic glasses are far from complete. Several recent works showed that the short-range order (SRO) in these glasses is formed to some extent with icosahedral and icosahedral-like structural units8,11–14, but
it is clear that distinguishing the subtle changes in SRO with glass composition is difficult. Based onab initio molecular dynamics
(MD) it was also proposed that a percolated network formed with Zn-centered structural units in Zn-rich Mg-Zn-Ca glasses (i.e. the medium-range order (MRO)) can promote a homogeneous corro-sion behavior on the alloy surface13.
Physical
Chemistry
Chemical
Physics
Accepted
Manuscript
Much of this previous work relies onab initioMD8,11,13,14.Ab
initioMD has the great advantage that is free froma priori
estab-lished assumptions about interatomic interactions, but the associ-ated very high computational expense means that it is restricted to small models, typically a few hundred atoms. This prohibits the possibility of analysing the structure at larger length scales. There has also been very little attempt to complement these computa-tional investigations with experimental study of the glass struc-ture, despite the potential for substantial new insight into the glass properties through a combined modelling and experiment approach.
In this work, we present for the first time, an investigation of the structure of Mg60+xZn35−xCa5, (x=0,7,12,14,20at. %) bulk
metallic glasses by both classical molecular dynamics and neu-tron diffraction. This allows us to characterise in detail the lo-cal structure, including total and partial coordination numbers, coordination polyhedra distribution and the extent of any pref-erential bonding. We are able to reveal some subtle structural changes which could explain the compositional dependence of the biodegradable properties of these compositions of bulk metal-lic glass. The use of the large models accessible through classical MD also allows us to investigate the medium-range order (MRO) in these glasses.
2
Methods
2.1 Experimental
Neutron diffraction expriments were performed for two compo-sitions: Mg60Zn35Ca5and Mg72Zn23Ca5. Bulk metallic Mg-Zn-Ca
glasses were prepared using high-purity elements: magnesium (99.8%), zinc (99.99%) and calcium (99.5%), all purchased at Sigma Aldrich, UK. The metals were weighed to give the desired stoichiometry and mixed thoroughly in a glove box to avoid air before being placed in a boron nitride crucible. Ingots of Mg-Zn-Ca alloys were fabricated using an inductively heated funrace which was initially evacuted to8×10−5torr and backfilled with
flowing argon. The metals were melted and then held at temper-ature to homogenise before cooling. Rapidly quenched ribbons were produced by remelting the ingots in quartz crucibles, and ejecting with an overpressure of 40 kPa through a nozzle of the quartz crucibles onto a copper wheel rotating with a surface ve-locity of 25 m s−1.
Neutron diffraction spectra of the resultant glasses were col-lected using the GEM diffractometer15 at the ISIS spallation
neutron source at the Rutherford Appleton Laboratory, UK. The glasses were broken into small pieces and placed inside an 8.3 mm diameter vanadium foil container. Spectra were collected for each of the samples inside the container, the empty container, a vanadium rod of 8.34 mm diameter, and the empty GEM instru-ment in order to perform the appropriate corrections. Data re-duction and corrections were performed using the GUDRUN pro-gram15. The corrections involve the removal of background and
container scattering, normalization, correction for absorption, in-elastic and multiple scattering effects, and subtraction of the self-scattering term15.
Following these corrections, the resultant coherent scattering
intensity,i(Q)is defined by
i(Q) =
∑
i∑
j
cicjb¯ib¯jpi j(Q)−1, (1)
whereciis the atomic concentration,biis the coherent scattering
length of the chemical speciesi, andpi j(Q)is the partial structure
factor for speciesiandj. The Fourier transform ofi(Q)generates the total correlation function,T(r), given by
T(r) =T0(r) +2
π
Z∞
0
Qi(Q)M(Q)sin(Qr)dQ, (2)
where M(Q) is a Lorch window function16 that takes into
ac-count the finite maximum experimentally attainable value of Q andT0(r)is the average density term, given by
T0(r) =4πrρ0
∑
i
cib¯i
!2
, (3)
whereris the distance from an arbitrary atom at the origin and
ρ0is the bulk number density.
The total correlation functionT(r) is related to the total pair
distribution functionG(r)by
T(r) =4πrρ(G(r)−1), (4)
where the total pair distribution function is a function of the par-tial pair distribution functions (PDFs):
G(r) = n
∑
i=1
n
∑
j=1
cib¯icjb¯j(gi j(r)−1), (5)
where the partial PDFsgi j(r)are defined as
gi j(r) =
1 4πr2c
iρ0
dni j(r)
dr , (6) wheredni j are the number of elements of type jbetween
dis-tancesrandr+drfrom an element of typei.
2.2 Simulation
For the classical MD simulations, we used a recently developed many-body, tight-binding (TB) potential12,17of the form
Ei=−
(
∑
j
ξ2exp
−2q
ri j
r0 −
1
)1/2
+
∑
jAexp
−p
ri j
r0 −
1
,
(7) whereξis an effective hopping integral,ri j is the distance
be-tween the atomsiandj, andr0is the expected first neighbour
dis-tance. Simpler pair potentials cannot adequately reproduce some basic features of metallic systems17,18. The essential band
char-acter of the metallic bonding, which comes from the electrostatic interaction of the electron cloud of delocalized electrons and pos-itively charged metal ions, should be taken into account. The TB method is a relatively simple scheme for relating the atomic and electronic structure in metallic systems without resorting to expensive first-principles calculations. It describes the ion-ion in-teraction as made up of an effective band term (the first term in
Physical
Chemistry
Chemical
Physics
Accepted
Manuscript
equation 7) plus a short-range repulsive pair potential (the sec-ond term in equation 7 in a Born-Mayer form)17. The parameters
of the TB potential for Mg-Zn-Ca system are given in ref.12.
Classical MD simulations were performed using the DLPOLY Classic code19. All glass models were prepared using the
melt-and-quench method: firstly, the starting configuration was equili-brated at high temperature, well above the melting temperature of the glass, and then continuously cooled down to room tempera-ture. The starting configurations for each model were obtained by randomly placing 2000 atoms of the appropriate composition into a cubic periodic simulation box. The size of the box was defined so as to obtain a correct glass density and was about 34.5 Å de-pending on glass composition. The densities of Mg60Zn35Ca5and
Mg72Zn23Ca5 were obtained experimentally in this work (3.24
and 2.63 g cm−3respectively, see Sec. 3.1), those of Mg
67Zn28Ca5
and Mg74Zn21Ca5were taken from the literature8,13, and the
den-sity of Mg80Zn35Ca5, which was not available experimentally, was
estimated at 2.42 g cm−3. However, in order to simulate the
glass models under realistic conditions, we used the NPT (con-stant number of particles, pressure and temperature) ensemble allowing the box size to change throughout the simulation. This approach could be more computationally expensive than NVT (constant number of particles, volume and temperature) MD but it helps to avoid high pressures during high-temperature anneal-ing and it was successfully used to obtain glass models consistent with experimental data for other glass compositions20. Hence,
the final glass densities are slightly different from the initial den-sities, which will be discussed in more detail in Sec. 3. To ensure that these models were large enough, we also constructed 10,000-atom models of two compositions; there were no statistically sig-nificant differences in the structure between the two sizes.
Each model was firstly equilibrated at 1500 K for 300 ps and then continuously cooled down to room temperature in 100 K steps being equilibrated for 100 ps at each temperature. Finally, each model was run for 300 ps at 300 K. The MD timestep was 1.0 fs, and the pressure set to zero. The cooling rate of these glasses is 0.7 K ps−1, which is considerably slower than that used inab
initioMD simulations of similar BMG8,13,14. Although this is still
orders of magnitude larger than cooling rates achieved experi-mentally, simulations using cooling rates of this order have been successful in generating glass structures in agreement with exper-iment20–24. Whilst the structures generated using this
methodol-ogy are in agreement with experimental values, some properties of the glass, such as glass transition temperature, are more dif-ficult to reproduce using simulation methods. We have not at-tempted to compute the glass transition temperature of our mod-els, but instead we computed structures and diffusion constants to check that the simulations were liquid at high temperature and solid at low temperature, and hence that the final run had equi-librated into an appropriate disordered solid state. The configu-ration at the final timestep was used for further analysis and only the pair-distribution function data were averaged over the final room-temperature run.
0 2 4 6 8 10 12
0.0 0.5 1.0 1.5 2.0 2.5
T
(
r
)
r, A
calculated
experim antal Mg
72
Zn
23
Ca
5
0 2 4 6 8 10 12
0.0 0.5 1.0 1.5 2.0 2.5
T
(
r
)
r, A
calculated
experim ental Mg
60
Zn
35
Ca
5
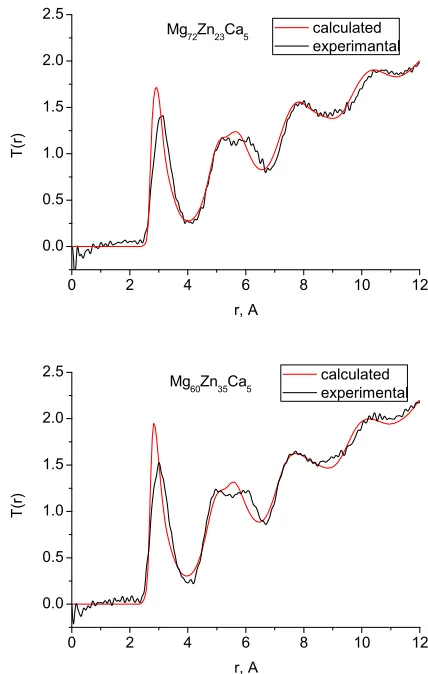
Fig. 1(Colour online) Total correlation functionsT(r)obtained with MD simulations (red) and compared with the neutron diffraction data (black) for a) Mg72Zn23Ca5and b) Mg60Zn35Ca5.
3
Results
3.1 Density
Table 1 gives the densities for the final configurations of all glass structures. The densities are given in g cm−3 and atoms Å−3
and compared with available experimental data. There is a good agreement in calculated and experimental values that demon-strates the reliability of the interatomic potential, NPT ensemble, and melt-and-quench procedure used to obtain our glass mod-els. The largest discrepancies are observed for the Mg67Zn28Ca5
and Mg74Zn21Ca5compositions, however, it is worth noting that
the experimental densities13for these compositions were
extrap-olated from data reported elsewhere8.
3.2 Pair-distribution functions
Figure 1 shows the experimental and calculated total correlation functions T(r) for both compositions which we measured with
diffraction: Mg72Zn23Ca5 and Mg60Zn35Ca5. In general, there is
very good agreement between the simulated and experimental T(r)implying that our simulated structures are consistent with
those observed experimentally. The peaks of the calculatedT(r)
for Mg72Zn23Ca5 occur at very slightly smaller values ofr than
Physical
Chemistry
Chemical
Physics
Accepted
Manuscript
[image:5.612.325.539.64.401.2]ρcalc(at. Å−3) ρ
calc(g cm−3) ρexp(g cm−3) 100%(ρcalc/ρexp−1)
Mg80Zn15Ca5 0.0459 2.38 2.32 (est.) N/A
Mg74Zn21Ca5 0.0469 2.62 2.48113 5.78
Mg72Zn23Ca5 0.0472 2.71 2.63 3.02
Mg67Zn28Ca5 0.0480 2.92 2.81113 3.85
[image:6.612.116.496.161.319.2]Mg60Zn35Ca5 0.0491 3.22 3.24 -0.76
Table 1The simulated and experimentally observed densities of the Mg-Zn-Ca glasses. The experimental densities for the Mg67Zn28Ca5and Mg74Zn21Ca5compositions are extrapolated from the data reported in Ref.8.
ri j, Å
Mg-Mg Mg-Zn Mg-Ca Zn-Zn Zn-Ca Ca-Ca Mg80Zn15Ca5 3.025 2.825 3.425 2.725 3.175 3.725
Mg74Zn21Ca5 3.025 2.825 3.425 2.675 3.175 3.775
Mg72Zn23Ca5 3.025 2.825 3.425 2.675 3.175 3.775
Mg67Zn28Ca5 3.025 2.825 3.425 2.675 3.175 3.775
Mg60Zn35Ca5 3.025 2.825 3.425 2.675 3.175 3.725
(ri j)aver 3.025 2.825 3.425 2.685 3.175 3.755
rm 3.20 2.94 3.57 2.68 3.31 3.94
100%(raver/rm−1) -5.47 -3.91 -4.06 0.19 -4.08 -4.70
rc 2.82 2.63 3.17 2.44 2.98 3.52
100%(raver/rc−1) 7.27 7.41 8.04 10.04 6.54 6.68
Crystalline 3.05−3.18 3.04 3.62 2.53−4.15 3.14−4.17 3.61−4.32
Table 2The interatomic bond distances (ri j, Å), that correspond to the position of the maximum intensity of the first peak in the respective partial PDFs of all compositions. The calculated distances are accurate to 0.025 Å. The metallic,rm, and covalent,rc, bond distances25,26, bond distance values averaged for the five compositions,(ri j)aver, and their deviations fromrmandrcare also given.
0 2 4 6 8 10 12
0 1 2 3 4
G(
r
)
r, A
Mg
80
Zn
15
Ca
5
Mg
74
Zn
21
Ca
5
Mg
72
Zn
23
Ca
5
Mg
67
Zn
28
Ca
5
Mg
60
Zn
35
Ca
5
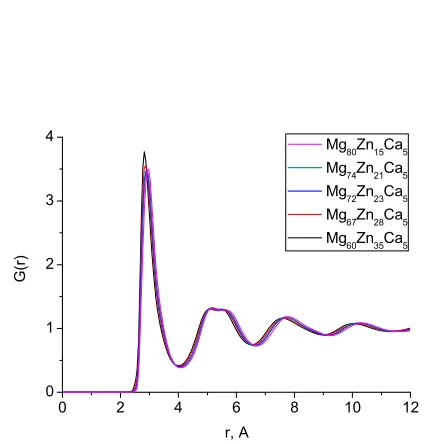
Fig. 2Total distribution functions obtained with MD simulations for all Mg-Zn-Ca alloys.
those seen experimentally, due to the slight (∼3%)
overestima-tion of the calculated atomic density with respect to experiment (Table 1).
For both compositions, the intensity of the simulated first peak inT(r)is larger than for experiment, and the broad peak at 4 – 7 Å
is narrower. This higher first peak is often a feature of simulated correlated functions compared to the broadened data extracted from experimental data. The double nature of the second peak is well-reproduced, which is important as it is a well-known feature of the pair-correlation function of several metallic glasses2,27,28.
The oscillations seen in the experimental T(r) at larger length
scales, 7 – 12 Å, are also present in the simulatedT(r).
The first peak inT(r)corresponds to interatomic distances in
the first coordination shell. It is relatively broad (2.5 – 4.0 Å) for both compositions and has contributions from overlapping cor-relations from all the six atom-atom pairs (see Table 2); due to this complexity we have made no attempt to extract partial coor-dination numbers from the experimental spectrum. Neither the experimental or simulatedT(r)differ significantly when the Zn
concentration is increased from 23 to 35 at. % Zn. In Figure 2 we show the total distribution functionsG(r)for all of our simulated
compositions, and see that there is no significant difference across this range of compositions, nor is there substantial variation in the bond lengths, which are given in Table 2, and discussed fur-ther below. As discussed in the introduction, these compositions exhibit very different behaviour in terms of their biocompatibil-ity, so to understand this, we must study their structures in more detail.
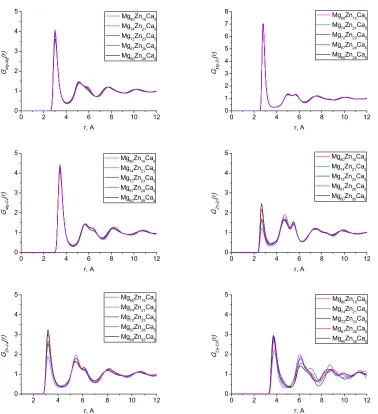
Figure 3 shows the calculated partial PDFs for all compositions.
Physical
Chemistry
Chemical
Physics
Accepted
Manuscript
[image:6.612.57.269.410.632.2]0 2 4 6 8 10 12 0 1 2 3 4 5 Mg 80 Zn 15 Ca 5 Mg 74 Zn 21 Ca 5 Mg 72 Zn 23 Ca 5 Mg 67 Zn 28 Ca 5 Mg 60 Zn 35 Ca 5 G M g -M g ( r ) r, A
0 2 4 6 8 10 12 0 1 2 3 4 5 6 7 8 Mg 80 Zn 15 Ca 5 Mg 74 Zn 21 Ca 5 Mg 72 Zn 23 Ca 5 Mg 67 Zn 28 Ca 5 Mg 60 Zn 35 Ca 5 G M g -Z n ( r ) r, A
0 2 4 6 8 10 12 0 1 2 3 4 5 Mg 80 Zn 15 Ca 5 Mg 74 Zn 21 Ca 5 Mg 72 Zn 23 Ca 5 Mg 67 Zn 28 Ca 5 Mg 60 Zn 35 Ca 5 G M g -C a ( r ) r, A
0 2 4 6 8 10 12 0 1 2 3 4 5 Mg 80 Zn 15 Ca 5 Mg 74 Zn 21 Ca 5 Mg 72 Zn 23 Ca 5 Mg 67 Zn 28 Ca 5 Mg 60 Zn 35 Ca 5 G Z n -Z n ( r ) r, A
2 4 6 8 10 12 0 1 2 3 4 5 Mg 80 Zn 15 Ca 5 Mg 74 Zn 21 Ca 5 Mg 72 Zn 23 Ca 5 Mg 67 Zn 28 Ca 5 Mg 60 Zn 35 Ca 5 G Z n -C a ( r ) r, A
0 2 4 6 8 10 12 0 1 2 3 4 5 Mg 80 Zn 15 Ca 5 Mg 74 Zn 21 Ca 5 Mg 72 Zn 23 Ca 5 Mg 67 Zn 28 Ca 5 Mg 60 Zn 35 Ca 5 G C a -C a ( r ) r, A
Fig. 3(Colour online) Partial radial distribution functions for all simulated Mg-Zn-Ca compositions.
Physical
Chemistry
Chemical
Physics
Accepted
Manuscript
[image:7.612.116.494.175.589.2]GMg−Mg(r),GMg−Zn(r)andGMg−Ca(r)partial PDFs do not change
significantly with changing composition, indicating that the Mg environment does not depend on composition. As Zn content in-creases, the first peak ofGZn−Zn(r)andGZn−Ca(r)sharpens and becomes more intense; similar features were found inab initio
MD simulations of these and related Mg-Zn-Ca glass composi-tions13,14. TheG
Ca−Ca(r)partial PDF has considerable variations
in peak shape at larger distances (6 – 12 Å). This effect has never been considered before as the amount of Ca atoms in models gen-erated withab initioMD is very low, so that the Ca-Ca partial PDF
is liable to strong statistical noise. To check that these variations were not due to remnants of the initial configuration, we com-puted the Ca diffusion constant at 1500 K, and found it to be about 2×10⁻⁸m2s−1, implying an average Ca atomic
displace-ment of∼60Å during the 300 ps run at 1500 K. This is the same
order of magnitude as the size of the model, meaning that any memory of the starting configuration will have been destroyed even by the end of the 1500 K part of the trajectory. Statistical noise due to the low Ca content of these models seems the most likely explanation.
Table 2 gives the interatomic bond distances estimated from the first maxima of the simulated partial PDFs. The interatomic bond distances for all pairs of atoms stay virtually constant across this range of composition. This is contrary to other studies8,13,14,29
where, for example, the Zn-Zn interatomic bond distance changes significantly, by up to 0.1 Å. The average interatomic distances,
(ri j)aver, are generally slightly shorter for the Mg-rich
composi-tions we consider in this system than for the Ca-rich composicomposi-tions considered in other work29, which implies a more dense and
ef-ficient packing, as we discuss below in section 3.3.
The values of our calculated interatomic bond distances lie in between covalent,rc, and metallic,rm, bond distances (Table 2).
Only the Zn-Zn nearest-neighbour distance is outside this range as it is slightly larger than the correspondingrm. Characteristic
bond lengths for several crystalline binary compounds29,30 are
also given in Table 2. The bond distances for Mg-Mg, Mg-Zn and Mg-Ca are considerably shorter than those in crystals and those for Zn-Zn, Zn-Ca and Ca-Ca are close to the minimum dis-tance values for crystals indicating that the absence of the long-range order constraints allows shortening of interatomic distances between the nearest-neighbour atoms in the amorphous struc-ture29.
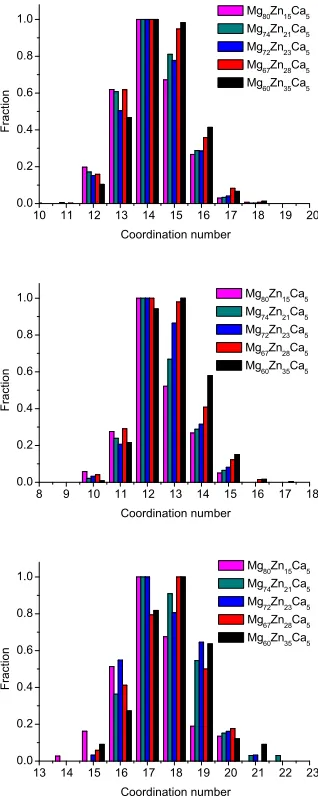
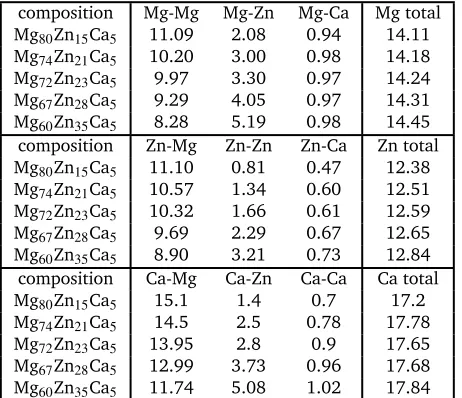
3.3 Coordination numbers
The distributions of the total simulated coordination numbers (CN) for all compositions are given in Fig. 4, and the partial CNs for all pairs are given in Table 3. The coordination number of the atom is defined with Voronoi polyhedra analysis, which will be described further in Sec. 3.5. The average CN for all species very slightly increases with increasing Zn content: from 14.11 to 14.45 (an increase of 2.4 %) for Mg, from 12.38 to 12.84 (an in-crease of 3.7 %) for Zn, and from 17.2 to 17.84 (an inin-crease of 3.5 %) for Ca. The largest proportional effect is for Zn atoms. We see from Table 3 that as Mg content decreases and Zn content in-creases, the number of Mg atoms in the first coordination shell of
10 11 12 13 14 15 16 17 18 19 20 0.0
0.2 0.4 0.6 0.8 1.0
Mg 80
Zn 15
Ca 5 Mg
74 Zn
21 Ca
5 Mg
72 Zn
23 Ca
5 Mg
67 Zn
28 Ca
5 Mg
60 Zn
35 Ca
5
F
r
a
c
t
io
n
Coordination num ber
8 9 10 11 12 13 14 15 16 17 18 0.0
0.2 0.4 0.6 0.8 1.0
Mg 80
Zn 15
Ca 5 Mg
74 Zn
21 Ca
5 Mg
72 Zn
23 Ca
5 Mg
67 Zn
28 Ca
5 Mg
60 Zn
35 Ca
5
F
r
a
c
t
io
n
Coordination num ber
13 14 15 16 17 18 19 20 21 22 23 0.0
0.2 0.4 0.6 0.8 1.0
Mg 80
Zn 15
Ca 5 Mg
74 Zn
21 Ca
5 Mg
72 Zn
23 Ca
5 Mg
67 Zn
28 Ca
5 Mg
60 Zn
35 Ca
5
F
r
a
c
t
io
n
Coordination num ber
Fig. 4(Colour online) Distributions of Mg-centered, Zn-centered, and
Ca-centered clusters by their total coordination number for all simulated compositions.
Physical
Chemistry
Chemical
Physics
Accepted
Manuscript
[image:8.612.359.518.178.576.2]composition Mg-Mg Mg-Zn Mg-Ca Mg total Mg80Zn15Ca5 11.09 2.08 0.94 14.11
Mg74Zn21Ca5 10.20 3.00 0.98 14.18
Mg72Zn23Ca5 9.97 3.30 0.97 14.24
Mg67Zn28Ca5 9.29 4.05 0.97 14.31
Mg60Zn35Ca5 8.28 5.19 0.98 14.45
composition Zn-Mg Zn-Zn Zn-Ca Zn total Mg80Zn15Ca5 11.10 0.81 0.47 12.38
Mg74Zn21Ca5 10.57 1.34 0.60 12.51
Mg72Zn23Ca5 10.32 1.66 0.61 12.59
Mg67Zn28Ca5 9.69 2.29 0.67 12.65
Mg60Zn35Ca5 8.90 3.21 0.73 12.84
composition Ca-Mg Ca-Zn Ca-Ca Ca total Mg80Zn15Ca5 15.1 1.4 0.7 17.2
Mg74Zn21Ca5 14.5 2.5 0.78 17.78
Mg72Zn23Ca5 13.95 2.8 0.9 17.65
Mg67Zn28Ca5 12.99 3.73 0.96 17.68
[image:9.612.56.287.50.249.2]Mg60Zn35Ca5 11.74 5.08 1.02 17.84
Table 3Partial and total coordination numbers of Mg, Zn and Ca atoms in modeled Mg-Zn-Ca glass structures.
all species decreases, to be replaced by an increase in the number of Zn atoms, e.g., CNMg−Znincreases from 2.08 to 5.19, CNZn−Zn
from 0.81 to 3.21, and CNCa−Zn from 1.4 to 5.08. Although the
content of Ca atoms does not change for this range of composi-tions, CNZn-Caand CNCa-Capartial CNs both increase significantly,
while CNMg-Caremains unchanged. This result can indicate some
preferences in Zn-Ca and Ca-Ca bonding and will be discussed in Sec. 3.4 in more detail.
The exact partial CNs available from the simulated data allow us to calculate the local atomic packing efficiency using the ap-proach of Miracle31,32. For all of the simulated structures, the
packing efficiency for Mg atoms is about 100 %, for Zn atoms about 113 %, and for Ca atoms about 105 % (we note that a ±10 % accuracy is anticipated in the calculation of the
lo-cal packing efficiency32), implying that the atoms in the glass
are packed extremely efficiently. This implies that all available space in the first coordination shell of all species is fully occu-pied contrary to Ca60MgxZn40−xglasses29where the packing
ef-ficiency does not reach its maximum value for the largest Ca atoms. The packing efficiency correlates with glass forming ability (GFA)33,34. The maximum packing efficiency found for our
simu-lated glasses agrees with the experimentally known good GFA of these glasses9.
3.4 Local chemical order
To characterise the local chemical order, one can define a chem-ical short-range order (CSRO) parameter αi(jk), which for a
ternary glass takes the form35
αi(jk)=1−(CNi j+CNik)/ (cj+ck)CNifori6=j6=k, (8)
where CNi jis the partial CN of species jaround speciesi,ciis the
atomic fraction of the speciesi, and CNiis the total CN of species
i. The equivalent form for a binary glass is36
αi j=1−CNi j/(cjCNi). (9)
Negative values ofαi j imply a preference for that bonding, and
positive values an avoidance. The binary and ternary CSRO pa-rameters are related by
αii= (1−1/ci)αi(jk), (10)
and soαii<0indicates an increased concentration of like atoms
in the first coordination shell of atomi.
The CSRO parametersαi j andαi(jk)are given in Tables 4 and
5. αMgMgandαMgZnare close to zero indicating the absence of
CSRO in the distribution of Mg and Zn atoms around Mg atoms, whereas the strongly negative values of αMgCa indicate an
in-creased local concentration of Ca atoms in the first coordination shell of Mg.
For Zn and Ca atoms the local environment is far from neu-tral: negative αZnMg values and positiveαZnZn values indicate
an enrichment in Mg atoms and a deficit of Zn atoms in Zn-centered clusters. This deficit decreases with increasing Zn con-tent but even for the Mg60Zn35Ca5composition, it remains
signif-icant (αZnZn=0.29). A similar situation is observed for the local
environment of Ca: a slight enrichment in Mg atoms and a deficit of Zn atoms, which reduces with increasing Zn content.
Remarkable changes are observed forαZnCa andαCaCa. With
increasing Zn content, these parameters change from 0.25 and 0.19 for Mg80Zn15Ca5to -0.13 and -0.14 for Mg60Zn35Ca5, i.e., a
strong deficit in Ca around Zn and Ca transforms to a slight en-richment as Zn content increases. Remarkably,αZnCaandαCaCa
values cross from positive to negative at Zn content of 23 - 28 at. %, i.e., near the threshold value where Mg-Zn-Ca glasses forms the amorphous Zn- and oxygen-rich layer which prevents the harmful release of hydrogen on immersion into the body3.
Across the same range of compositions,αMgZnandαMgCaremain
unchanged. This allows us to speculate that Zn-Ca and Ca-Ca bonding play an important role in structural changes which oc-cur with changing Zn content and affect the biocompatibility of Mg-Zn-Ca glass.
Theαi(jk)values in Table 5 demonstrate the absence of
signifi-cant clustering in Mg-Zn-Ca amorphous alloys. All values are zero or slightly negative, indicating no CSRO around Ca and slightly increased order around Mg and Zn respectively.
3.5 Voronoi polyhedra distribution
Voronoi analysis can be used to further characterise the order of BMG providing important information on atoms first coordina-tion shell37. The Voronoi polyhedron for a given atom is
de-fined as the region of space which is closer to that atom than to any other. Each polyhedron can be described by itssignature,
(v3,v4,v5,v6, . . .), where vmis the number of faces on the
poly-hedron containingmedges. For example, the icosahedral motif, which is important in BMGs, has twelve pentagonal (m=5) faces
and therefore has a Voronoi signature of (0, 0, 12, 0).
One can define the coordination number of an atom directly from its Voronoi polyhedron as CN=∑mvm, by defining
nearest-neighbour atoms as two atoms which have common faces in their Voronoi polyhedra38. This gives a different definition of the CN to
that often used, where two atoms are nearest neighbours if they
Physical
Chemistry
Chemical
Physics
Accepted
Manuscript
αi j Mg-Mg Mg-Zn Mg-Ca Zn-Mg Zn-Zn Zn-Ca Ca-Mg Ca-Zn Ca-Ca
Mg80Zn15Ca5 0.02 0.02 -0.34 -0.12 0.56 0.25 -0.10 0.46 0.19
Mg74Zn21Ca5 0.03 -0.01 -0.38 -0.14 0.49 0.05 -0.10 0.33 0.12
Mg72Zn23Ca5 0.03 -0.01 -0.36 -0.14 0.43 0.03 -0.10 0.31 -0.02
Mg67Zn28Ca5 0.03 -0.01 -0.35 -0.14 0.35 -0.05 -0.10 0.25 -0.09
[image:10.612.107.504.51.119.2]Mg60Zn35Ca5 0.05 -0.03 -0.35 -0.16 0.29 -0.13 -0.10 0.19 -0.14
Table 4Chemical short range parameters,αi j, for Mg-, Zn-, and Ca-centered clusters in the Mg-Zn-Ca amorphous systems.
αi(jk),i= Mg Zn Ca
Mg80Zn15Ca5 -0.07 -0.10 -0.01
Mg74Zn21Ca5 -0.08 -0.13 -0.01
Mg72Zn23Ca5 -0.07 -0.13 0.00
Mg67Zn28Ca5 -0.06 -0.14 0.00
Mg60Zn35Ca5 -0.07 -0.15 0.01
Table 5Chemical short-range order parameters,αi(jk), for Mg-, Zn-, and Ca-centered clusters in the Mg-Zn-Ca amorphous systems.
are closer than a given cutoff. The coordination number defined in this way is very sensitive to the choice of the cutoff value if the bond length distribution is broad20as it often is for metallic
glasses. Moreover, comparison with other results becomes more difficult if a different cutoff value was used.
In this work, the Voro++39 code was used to perform the
Voronoi analysis. An example of a simulation box with calculated Voronoi polyhedra is given in Fig. 5.
The distributions of different types of Mg-, Zn-, and Ca-centered coordination Voronoi polyhedra are given in Fig. 6. Note that for Mg- and Zn-centered clusters only polyhedra with≥2%
population in all compositions are given, whereas for Ca-centered clusters polyhedra with>2%population in at least one
composi-tion are given.
It is clear that the distributions for all elements are very broad and it is difficult to distinguish a dominant type of coordination polyhedra. However, for Mg-centered clusters, (0, 2, 8, 4) and (0, 1, 10, 2) polyhedra make up 6-9 % and 5-8 % respectively of the total population. For Zn-centered clusters, the (0, 2, 8, 2) and (0, 0, 12, 0) polyhedra dominate with 9-17 % and 8-14 % respectively of the total population. For Ca-centered clusters, it is not possible to define a dominant type of coordination polyhedra for all compositions.
Although the distribution of coordination polyhedra is very broad, it is possible to highlight some trends which occur with changes in composition. In Zn-poor compositions (Mg80Zn15Ca5
and Mg74Zn21Ca5) the distribution of polyhedra is narrower: the
fraction of Zn-centered (0, 2, 8, 2) and (0, 0, 12, 0) polyhedra is highest (17% and 14%) and for Ca-centered clusters the fraction of two types of polyhedra ((0, 2, 8, 6) and (0, 8, 8, 7)) reaches 8%. By contrast, for the Zn-rich composition Mg60Zn35Ca5, the
maximum value of fraction for any polyhedron type does not ex-ceed 9% and 4% for Zn- and Ca-centered clusters respectively. For Mg-centred polyhedra, no clear tendencies could be found.
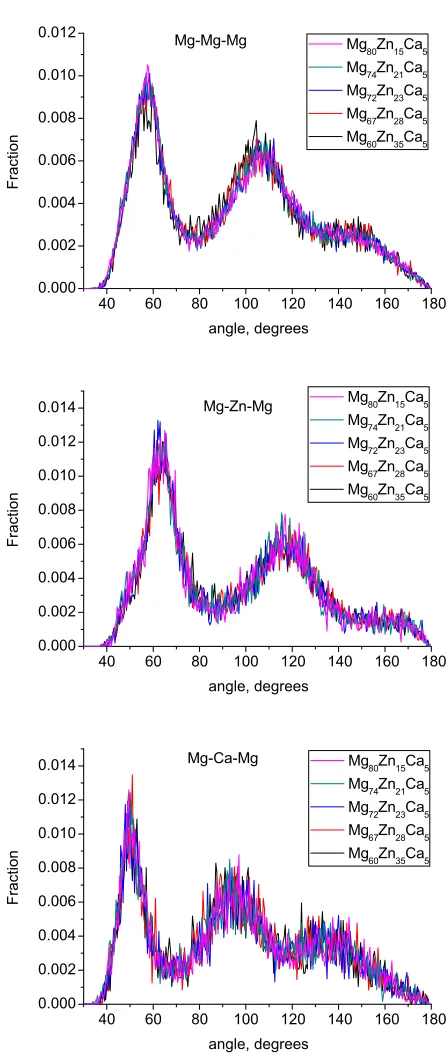
3.6 Bond-angle distribution
The bond-angle distributions (BAD) for Mg-X-Mg (X = Mg, Zn, Ca) are given in Fig. 7. There are no significant changes in these BADs with composition. The Mg-Mg-Mg and Mg-Zn-Mg BADs have two broad peaks at≈57◦ and106◦ and ≈63◦ and 117◦respectively. The ideal icosahedral bond angles are≈63.5◦
and116.5◦, indicating that Zn-centered clusters are more likely
to form icosahedral and related motifs than Mg-centered clusters. This confirms the results of Voronoi tesselation analysis discussed above. The Mg-Ca-Mg BAD has peaks at≈50◦and95◦, which
cor-responds to the higher Ca atom CN (17.2−17.84) and a larger
fraction of polyhedron faces with six edges.
3.7 Medium-range order
Structural studies of BMGs over the past decades have shown that many glasses exhibit not just short-range order (SRO) but also order at larger length scales, so-called medium-range order (MRO)29,35,40–44. Generally, MRO in glasses is shown by a
pre-peak in the neutron or X-ray scattering structure factor2. There
is no unique explanation of the origin of this feature. Some sug-gest that icosahedral clusters are the source of MRO45,46,
how-ever, such a pre-peak was also observed from neutron scattering data on a Zr-Ni liquid47which is reported not to have dominant
icosahedral short-range order. It has been suggested44 that “a
pre-peak is a manifestation of chemical and topological ordering originating from the most common polyhedral cluster in each sys-tem, icosahedral or otherwise”.
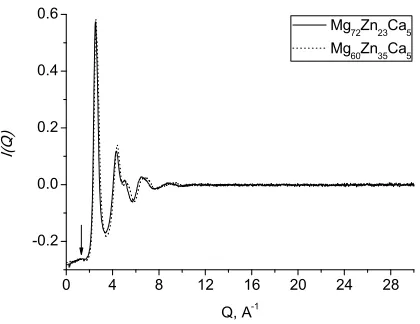
The extent of MRO in Mg-Zn-Ca glasses is likely to be rather small. Fig. 8 shows the experimental total neutron scatter-ing structure factors for Mg60Zn35Ca5and Mg72Zn23Ca5 metallic
glasses. For our samples, a pre-peak at about 1.2 Å−1 is barely
resolved.
The efficient cluster packing (ECP) model has been recently de-veloped for the structural description of metallic glasses40 and
applied to the structure of Ca-Mg-Cu glasses35, where it was
shown that the MRO can be explained as a face-centered-cubic (FCC)-like local ordering of Cu-centered clusters. In our glasses, the Zn-centered clusters could play this role of the MRO form-ers. Icosahedral (0, 0, 12, 0) and icosahedral-like ((0, 2, 8, 2), (0, 1, 10, 2) and (0, 2, 8, 1)) clusters make up about 33% of the Voronoi polyhedra for Mg72Zn23Ca5, for example, and can be
considered as SRO forming structural units, consistent with pre-vious results11,13. Hence, we assume that Zn-centered clusters
form the FCC motif and try to explain the Zn-Zn partial PDF pro-file, gZnZn(r) (Fig. 3), with the ECP model35,40. In particular,
we are interested in the broad double peak inG(r)at≈4−6Å.
For conciseness, the analysis is only shown for the Mg72Zn23Ca5
Physical
Chemistry
Chemical
Physics
Accepted
Manuscript
[image:10.612.84.251.163.234.2]Fig. 5A snapshot of the final configuration for Mg80Zn15Ca5glass with calculated Voronoi polyhedra. Mg, Zn and Ca atoms are represented with the spheres coloured with respect to different coordination numbers.
Physical
Chemistry
Chemical
Physics
Accepted
Manuscript
[image:11.612.85.531.116.633.2]< 0 , 2 , 8 , 4 > < 0 , 1 , 1 0 , 2 > < 0 , 3 , 6 , 5 > < 0 , 2 , 8 , 5 > < 0 , 0 , 1 2 , 0 > < 0 , 1 , 1 0 , 3 > < 0 , 3 , 6 , 4 > < 0 , 3 , 6 , 6 > < 1 , 1 , 8 , 3 , 1 > < 0 , 1 , 1 0 , 4 > < 1 , 0 , 9 , 3 > < 1 , 3 , 4 , 5 , 1 > < 0 , 4 , 4 , 6 > 0.00 0.02 0.04 0.06 0.08 0.10 Mg 80 Zn 15 Ca 5 Mg 74 Zn 21 Ca 5 Mg 72 Zn 23 Ca 5 Mg 67 Zn 28 Ca 5 Mg 60 Zn 35 Ca 5 F r a ct i o n
Voronoi polyherda signature
< 0 , 2 , 8 , 2 > < 0 , 3 , 6 , 4 > < 0 , 0 , 1 2 , 0 > < 0 , 2 , 8 , 1 > < 1 , 2 , 6 , 3 , 1 > < 1 , 2 , 5 , 4 > < 1 , 2 , 6 , 2 , 1 > < 0 , 3 , 6 , 3 > < 0 , 1 , 1 0 , 2 > 0.00 0.02 0.04 0.06 0.08 0.10 0.12 0.14 0.16 0.18 0.20 Mg 80 Zn 15 Ca 5 Mg 74 Zn 21 Ca 5 Mg 72 Zn 23 Ca 5 Mg 67 Zn 28 Ca 5 Mg 60 Zn 35 Ca 5 F r a ct i o n
Voronoi polyherda signature
Mg 80 Zn 15 Ca 5 Mg 74 Zn 21 Ca 5 Mg 72 Zn 23 Ca 5 Mg 67 Zn 28 Ca 5 Mg 60 Zn 35 Ca 5 < 0 , 1 , 1 0 , 6 > < 0 , 2 , 8 , 6 > < 0 , 1 , 1 0 , 5 > < 1 , 1 , 8 , 6 , 1 > < 0 , 1 , 1 0 , 7 > < 0 , 3 , 7 , 8 , 1 > < 0 , 2 , 8 , 9 > < 0 , 0 , 1 2 , 5 > < 0 , 3 , 7 , 7 , 1 > < 0 , 2 , 8 , 8 > < 0 , 3 , 6 , 8 > < 0 , 2 , 8 , 7 > < 0 , 2 , 9 , 5 , 1 > < 0 , 3 , 6 , 9 > < 0 , 2 , 9 , 6 , 1 > 0.00 0.01 0.02 0.03 0.04 0.05 0.06 0.07 0.08 0.09 0.10 F r a ct i o n
Voronoi polyherda signature
Fig. 6(Colour online) Distribution of different types of Mg-, Zn-, and Ca-centered coordination polyhedra in all simulated compositions.
40 60 80 100 120 140 160 180
0.000 0.002 0.004 0.006 0.008 0.010 0.012 F r a c t io n angle, degrees Mg 80 Zn 15 Ca 5 Mg 74 Zn 21 Ca 5 Mg 72 Zn 23 Ca 5 Mg 67 Zn 28 Ca 5 Mg 60 Zn 35 Ca 5 Mg-Mg-Mg
40 60 80 100 120 140 160 180
0.000 0.002 0.004 0.006 0.008 0.010 0.012 0.014 Mg 80 Zn 15 Ca 5 Mg 74 Zn 21 Ca 5 Mg 72 Zn 23 Ca 5 Mg 67 Zn 28 Ca 5 Mg 60 Zn 35 Ca 5 Mg-Zn-Mg F r a c t io n angle, degrees
40 60 80 100 120 140 160 180
0.000 0.002 0.004 0.006 0.008 0.010 0.012 0.014 F r a c t io n angle, degrees Mg-Ca-Mg Mg 80 Zn 15 Ca 5 Mg 74 Zn 21 Ca 5 Mg 72 Zn 23 Ca 5 Mg 67 Zn 28 Ca 5 Mg 60 Zn 35 Ca 5
Fig. 7(Colour online) a) Mg-Mg-Mg; b) Mg-Zn-Mg; c) Mg-Ca-Mg
bond-angle distributions in the simulated compositions.
Physical
Chemistry
Chemical
Physics
Accepted
Manuscript
[image:12.612.58.277.87.644.2] [image:12.612.319.543.114.644.2]0 4 8 12 16 20 24 28 -0.2
0.0 0.2 0.4 0.6
I
(
Q)
Q, A
-1
Mg
72
Zn
23
Ca
5
Mg
60
Zn
35
Ca
5
Fig. 8Experimental total neutron scattering structure factors for Mg60Zn35Ca5(dotted line) and Mg72Zn23Ca5(solid line) metallic glasses. The arrow indicates a barely resolved pre-peak at≈1.2Å−1.
composition.
Within the ECP model35,40, the FCC lattice has four α sites
occupied with Zn-centered clusters and four octahedral (β) and
eight tetrahedral (γ) interstitial sites which could be also occu-pied by alloying elements. The average number of atoms in each Zn-centered cluster is 13.6 (CNZn+1) and so we can estimate the
number of atoms forming the FCC “super-cell” as between 54.3 (no interstitial sites occupied) and 66.3 (all interstitial sites oc-cupied). By using the calculated density, this implies a supercell volume of 1150.5 to 1404.5 Å3, and hence a lattice parameter
between 10.5 Å and 11.2 Å. The distance between neighbouring Zn-centred clusters, rc, is the lattice parameter divided by
√ 2,
hence betweeen 7.4 Å and 7.9 Å. The third peak of the simulated Zn-Zn partial PDF,gZnZn(r)(Fig. 3), is at 7.525 Å and, hence, is
consistent with thisrcvalue.
By using this calculated value, the super-cell parameter is re-fined to 10.6 Å, which corresponds to 22% of interstitial sites in a super-cell being occupied. For this value ofac, we expect
to find the peak corresponding to the octahedral site at 5.3 Å (=ac/2) and the peaks corresponding to the tetrahedral sites at
4.6 Å (=√3ac/4) and 8.7 Å (= √
11ac/4). The positions for the
second and the third peaks ingZnZn(r)are at about 4.73 Å and
5.48 Å respectively. Hence, the second peak could possibly be as-signed to the distance between the Zn atom in the center of the cluster and a Zn atom in the nearest tetrahedral position. How-ever, the third peak is further from the predicted distance between
α andβ (octahedral) sites. The magnesium atom could occupy the octahedral interstitial sites, however, the Mg-Zn partial PDF, gMgZn(r)(Fig. 3), demonstrates that there are no peaks corre-sponding to the predicted distances. This implies that Mg-Zn-Ca metallic glasses do not possess a MRO which could be described well with the ECP model.
It is usual to assume that the largest solute in a multicompo-nent glass would be the primary structure-forming solute48. In
our system, the largest solute atom is Ca and its concentration is too small. However, for the Ca-Mg-Cu glasses, it was
sug-gested that elements with the strongest chemical interaction with solvent atoms form the structure-forming clusters35. The order
of interaction energy in Mg-Zn-Ca system can be estimated with heats of mixing49, which suggest that the Ca-Zn interaction (-22
kJ/mol) is much stronger than the Ca-Mg and Mg-Zn interactions (-6 kJ/mol and -4 kJ/mol, respectively). In such a way, in our sys-tems, the dominant solute Zn atoms have the weakest interaction with the solvent Mg atoms. This could possibly be a reason why our systems do not exhibit the explicit medium-range ordering seen in Ca-Mg-Zn29and Ca-Mg-Cu35 glasses, where the solute
atoms interact more strongly with solvent atoms than with other solute atoms.
The formation of chain-like fragments in the modeled glass structure can be considered as a certain degree of a MRO. Indeed, our calculations demonstrate that the Zn-Zn connectivity strongly increases with increasing Zn content. In agreement withab ini-tioMD simulations13, the number of Zn atoms connected to two
other Zn atoms dramatically increases for zinc-rich compositions (Mg67Zn28Ca5 and Mg60Zn35Ca5), and the number is of course
largest for the compositions richest in zinc. In such a way, our calculations confirm the proposed idea13that “Zn-centered
clus-ter(s) could eventually form a percolated network” and that this can determine the physical and chemical properties of the bulk materials.
4
Conclusions
In this work, we have presented a combined simulation-experiment study of the atomic structure of Mg-based bulk metallic glasses intended for biomedical applications. A good agreement in calculated and experimental densities and in pair-correlation functions for two compositions (Mg60Zn35Ca5 and
Mg72Zn23Ca5) let us conclude that our models of glass structure
are realistic, and so we studied five different compositions of po-tential biomedical relevance. There is no significant change in the total pair-correlation functions or in the bond lengths for the range of compositions studied. There were only small increases in the total coordination numbers with increasing zinc content. The bond lengths for all pairs of atoms are smaller or close to mini-mum bond distances found in crystalline compounds, indicating a dense and efficient packing of atoms within an amorphous sys-tem and the bond distance shortening caused by the absence of the long-range order. This is confirmed by calculated packing efficiencies of about 100%, which also corresponds to these com-positions’ known good glass-forming ability.
The greatest variation in the bonding with composition was in the zinc and calcium bonding, which we have characterised by calculating the local chemical short-range order parameter us-ing the partial coordination numbers extracted from our struc-tural models. At low zinc content, zinc and calcium prefer to avoid each other and themselves in their first coordination shell. As zinc content increases, this avoidance becomes less prevalent and in the highest-zinc-content glasses, zinc and calcium prefer to bond to calcium. This is also visible in the sharpening of the first peaks in the Zn-Ca and Ca-Ca partial pair-correlation functions, and the increase in the Zn-Ca and Ca-Ca coordination numbers. The crossover between avoidance and preference occurs at zinc
Physical
Chemistry
Chemical
Physics
Accepted
Manuscript
[image:13.612.55.265.64.226.2]contents of23−28%, close to the threshold value of 28 % where
Mg-Zn-Ca glasses change their bio-compatible properties. This implies that the suggestion that the corrosive elements (Mg, Ca) are removed in the body to leave the passive zinc is too simplis-tic, and that there is substantial preferential bonding in these sys-tems, which will strongly affect the passivation.
The distribution of Voronoi polyhedra is very broad for all sim-ulated glasses and there is no single unambiguously dominant structural unit. Icosahedral and icosahedral-like coordination polyhedra are always present. In Zn-poor glasses, these (0, 2, 8, 2) and (0, 0, 12, 0) coordination polyhedra make up 14-17 % of the population of polyhedra and their content decreases with increasing Zn content. This indicates a sort of degradation of the short-range ordering in Zn-rich Mg-Zn-Ca glasses.
In the last section of this paper, we have applied the efficient cluster packing model in order to investigate the medium-range order in these glasses. We conclude that this model cannot de-scribe the MRO in our amorphous systems. This is also con-firmed by our experimental total neutron scattering structure fac-tor which does not have the explicit pre-peak which usually in-dicates the presence of MRO. The only evidence of the MRO for Mg-Zn-Ca glasses is the increasing amount of chains formed with Zn-centered clusters in Zn-rich Mg-Zn-Ca metallic glasses. Our result confirms an earlier suggestion13that Zn-centered clusters
could form a percolated network and that this can determine the physical and chemical properties of the bulk materials.
5
Acknowlegements
The authors would like to thank the ISIS Pulsed Neutron and Muon Source for the allocation of beam-time (RB1510188). The work of A. G. and J. K. C. was funded by the UK’s EPSRC (EP/L024195). Via our membership of the UK’s HEC Materials Chemistry Consortium, which is funded by EPSRC (EP/L000202), this work used the ARCHER UK National Supercomputing Ser-vice (http://www.archer.ac.uk). The authors also acknowledge the use of the UCL Legion High Performance Computing Facility (Legion@UCL), and associated support services, in the comple-tion of this work.
References
1 W. Klement, R. H. Willens and P. Duwez,Nature, 1960,187,
869–70.
2 Y. Q. Cheng and E. Ma, Progress in Materials Science, 2011,
56, 379 – 473.
3 B. Zberg, P. J. Uggowitzer and J. F. Löffler,Nature Materials,
2009,8, 887–891.
4 H. Li and Y. Zheng,Acta Biomater., 2016,28, 1–20.
5 P. Meagher, E. O´Cearbhaill, J. Byrne and D. Browne, Adv.
Mater., 2016,28, 5755–62.
6 X. Gu, Y. Zheng, S. Zhong, T. Xi, J. Wang and W. Wang,
Bio-materials, 2010,31, 1093–103.
7 Y. B. Wang, X. H. Xie, H. F. Li, X. L. Wang, M. Z. Zhao, E. W. Zhang, Y. J. Bai, Y. F. Zheng and L. Qin,Acta Biomaterialia,
2011,7, 3196–208.
8 R. Mahjoub, K. J. Laws, J. P. Scicluna, J. E. Daniels and
M. Ferry, Computational Materials Science, 2015, 96, 246–
255.
9 X. Gu, G. J. Shiflet, F. Q. Guo and S. J. Poon,Journal of
mate-rials research, 2005,20, 1935–1938.
10 Q. He, Y.-Q. Cheng, E. Ma and J. Xu,Acta Materialia, 2011,
59, 202–15.
11 Y. F. Zhao, D. Y. Lin, X. H. Chen, Z. K. Liu and X. D. Hui,Acta
Materialia, 2014,67, 266–277.
12 S.-P. Ju, H.-H. Huang and J. C.-C. Huang, Journal of
Non-Crystalline Solids, 2014,388, 23–31.
13 S. N. Li, J. B. Liu, J. H. Li, J. Wang and B. X. Liu,The Journal
of Physical Chemistry B, 2015,119, 3608–3618.
14 J. K. Christie,Physical Chemistry Chemical Physics, 2015,17,
12894–98.
15 A. C. Hannon,Nuclear Instruments and Methods in Physics Re-search Section A: Accelerators, Spectrometers, Detectors and
As-sociated Equipment, 2005,551, 88–107.
16 E. Lorch, Journal of Physics C: Solid State Physics, 1969, 2,
229.
17 F. Cleri and V. Rosato,Physical Review B, 1993,48, 22.
18 T. Egami,JOM, 2010,62, 70–75.
19 I. T. Todorov, W. Smith, K. Trachenko and M. T. Dove,Journal
of Materials Chemistry, 2006,16, 1911–1918.
20 A. Gulenko, O. Masson, A. Berghout, D. Hamani and P. Thomas, Physical Chemistry Chemical Physics, 2014, 16,
14150–14160.
21 K. Vollmayr, W. Kob and K. Binder,Physical Review B, 1996,
54, 15808.
22 J. K. Christie and A. Tilocca,The Journal of Physical Chemistry B, 2012,116, 12614–12620.
23 A. Tilocca and A. N. Cormack,Langmuir, 2009,26, 545–551.
24 J. K. Christie and A. Tilocca,Chemistry of Materials, 2010,22,
3725–34.
25 N. N. Greenwood and A. Earnshaw,Chemistry of the elements,
Butterworth Heinemann, 1997.
26 B. Cordero, V. Gómez, A. E. Platero-Prats, M. Revés, J. Echev-erría, E. Cremades, F. Barragán and S. Alvarez,Dalton
Trans-actions, 2008, 2832–2838.
27 H. Y. Hsieh, T. Egami, Y. He, S. J. Poon and G. J. Shiflet,
Journal of Non-Crystalline Solids, 1991,135, 248–254.
28 Y. H. Liu, T. Fujita, D. P. B. Aji, M. Matsuura and M. W. Chen,
Nature Communications, 2014,5, year.
29 O. N. Senkov, D. B. Miracle, E. R. Barney, A. C. Hannon, Y. Q. Cheng and E. Ma,Physical Review B, 2010,82, 104206.
30 J. L. C. Daams, J. H. N. van Vucht and P. Villars,Atlas of Crystal
Structure Types Of Intermetallic Phases, American society for
metals, 1992.
31 D. B. Miracle, W. S. Sanders and O. N. Senkov,Philosophical
Magazine, 2003,83, 2409–2428.
32 D. B. Miracle,Journal of Non-Crystalline Solids, 2004,342, 89
– 96.
33 A. L. Greer,Nature, 1993,366, 303–304.
34 M. Chen,NPG Asia Materials, 2011,3, 82–90.
Physical
Chemistry
Chemical
Physics
Accepted
Manuscript
35 O. N. Senkov, Y. Q. Cheng, D. B. Miracle, E. R. Barney, A. C. Hannon and C. F. Woodward,Journal of Applied Physics, 2012,
111, 123515.
36 B. Warren,X-ray Diffraction. Dover, Dover Publications, 1990.
37 G. Voronoi,Journal für die reine und angewandte Mathematik,
1909,136, 67–182.
38 R. Zallen,The Physics of Amorphous Solids, Wiley Online
Li-brary, 1983.
39 C. Rycroft,Lawrence Berkeley National Laboratory, 2009.
40 D. B. Miracle,Acta materialia, 2006,54, 4317–4336.
41 P. Lamparter and S. Steeb, Journal of non-crystalline solids,
1988,106, 137–146.
42 H. Y. Hsieh, B. H. Toby, T. Egami, Y. He, S. J. Poon and G. J. Shiflet,Journal of Materials Research, 1990,5, 2807–2812.
43 T. C. Hufnagel and S. Brennan,Physical Review B, 2003,67,
014203.
44 N. A. Mauro, V. Wessels, J. C. Bendert, S. Klein, A. K. Gan-gopadhyay, M. J. Kramer, S. G. Hao, G. E. Rustan, A. Kreyssig, A. I. Goldmanet al.,Physical Review B, 2011,83, 184109.
45 J. Saida, M. Matsushita and A. Inoue,Applied Physics Letters,
2001,79, 412–414.
46 M. H. Lee, R. T. Ott, M. F. Besser, M. J. Kramer and D. J. Sordelet,Scripta materialia, 2006,55, 505–508.
47 D. Holland-Moritz, S. Stüber, H. Hartmann, T. Unruh, T. Hansen and A. Meyer,Physical Review B, 2009,79, 064204.
48 D. B. Miracle, D. V. Louzguine-Luzgin, L. V. Louzguina-Luzgina and A. Inoue,International Materials Reviews, 2010,
55, 218–256.
49 A. Takeuchi and A. Inoue,Materials Transactions, 2005,46,
2817–2829.