Fingerprint Classification
Techniques
by
Chainarong Klimanee, B.E.
Submitted in fulfilment of the requirements for the degree of
..
11
Statement of Originality
This thesis contains no material, which has been accepted for the award of any other degree or diploma in any tertiary institution. To the best of my knowledge and belief, the thesis contains no material previously published or written by another person, except when due reference is made in the text.
Statement of Authority of Access
This thesis may be made available for loan and limited copying in accordance with the Copyright Act 1968
Abstract
Today
,
mos
t
b
iome
t
r
ics
resea
rch
g
roups
a
re
tack
l
ing
the
cha
l
leng
ing
p
rob
lem
o
f
an
au
toma
t
ic
f
inge
rp
r
in
t
iden
t
i
f
ica
t
ion
sys
tem
(AFIS
)
us
ing
la
rge
da
tabases
.
S
ince
AFIS
ded
ica
tes
mos
t
o
f
i
ts
p
rocess
ing
t
ime
to
sea
rch
ing
fo
r
the
bes
t
-ma
tched
f
inge
rp
r
in
t
,
sea
rch
ing
ove
r
the
en
t
i
re
f
inge
rp
r
in
t
da
tabase
is
ra
the
r
ine
f
f
ic
ien
t
.
I
t
is
p
roposed
tha
t
the
da
tabase
be
d
iv
ided
in
to
sub
-da
tabases
,
each
con
ta
in
ing
on
ly
f
inge
rp
r
in
ts
o
f
the
same
pa
t
tern
or
c
lass
.
F
ingerpr
in
t
c
lass
i
f
ica
t
ion
is
then
an
impor
tan
t
f
irs
t
s
tep
in
d
i
rec
t
ing
the
sea
rch
on
ly
to
the
app
rop
r
ia
te
sub
-da
tabase
,
thus
reduc
ing
the
ex
ten
t
o
f
sea
rch
ing
o
f
the
la
rge
da
tabase
.
The
ma
in
ob
jec
t
ive
o
f
th
is
thes
is
is
to
p
ropose
a
c
lass
i
f
ica
t
ion
techn
ique
to
re
l
iab
ly
c
lass
i
fy
a
f
inge
rp
r
in
t
in
to
one
o
f
s
ix
we
l
l
-known
c
lasses
:
plain arch,tented arch, right loop,leftloop, whorland
twinloop.The
f
inge
rp
r
in
t
c
lass
i
f
ica
t
ion
techn
ique
p
roposed
in
th
is
thes
is
has
ach
ieved
good
resu
l
ts
ow
ing
to
the
improvemen
t
in
a
number
o
f
p
rocess
ing
s
teps
the
au
tho
r
has
p
roposed
fo
r
the
enhancemento
f
f
inge
rp
r
in
ts
,
the
de
te
rm
ina
t
ion
o
f
singular pointsand
the
i
r
assoc
ia
ted
principal axes,and
the
ru
le
-based
c
lass
i
f
ica
t
ion
a
lgo
r
i
thm
.
The
accuracy
o
f
the
loca
t
ion
o
f
s
ingu
lar
po
in
ts
on
a
f
ingerpr
in
t
is
impor
tan
t
for
m
inu
t
iae
ma
tch
ing
a
l
ignmen
t
and
is
a
lso
essen
t
ia
l
fo
r
the
Poincareindexto
co
r
rec
t
ly
de
te
rm
ine
the
type
o
f
s
ingu
la
r
po
in
ts
.
In
th
is
thes
is
,
we
p
resen
t
a
nove
l
ye
t
s
imp
le
and
accu
ra
te
techn
ique
fo
r
the
au
toma
t
ic
de
te
rm
ina
t
ion
o
f
s
ingu
la
r
po
in
ts
.
The
techn
ique
o
f
fe
rs
a
doub
le
-
reso
lu
t
ion
es
t
ima
t
ion
o
f
the
r
idge
o
r
ien
ta
t
ion
on
a
4x4
p
ixe
ls
quincunxg
r
id
and
quan
t
ises
r
idge
o
r
ien
ta
t
ions
in
to
s
ix
codes
ca
l
led
ridgeflow codes. Singular regionsare
de
fmed
as
where
a
l
l
s
ix
codes
ex
is
t
.
A
s
ingu
lar
po
in
t
w
i
th
in
a
s
ingu
lar
reg
ion
can
then
be
qu
ick
ly
de
term
ined
by
loca
t
ing
the
po
in
t
where
the
var
iance
o
f
loca
l
r
idge
or
ien
ta
t
ion
is
a
t
i
ts
max
imum
.
The
Po
incare
ind
ices
o
f
these
s
ingu
lar
po
in
ts
a
re
used
to
de
te
rm
ine
the
i
r
type
:
ordinary, delta, coreo
r
double-core.The
d
is
t
r
ibu
t
ion
and
type
o
f
the
s
ingu
la
r
po
in
ts
,
toge
the
r
w
i
th
the
i
r
assoc
ia
ted
p
r
inc
ipa
l
axes
,
are
then
used
to
c
lass
i
fy
a
f
ingerpr
in
t
in
to
one
o
f
s
ix
we
l
l
-known
c
lasses
or
pa
t
te
rns
.
Acknowledgments
Firstly, I would like to express my deepest gratitude to my supervisor, Professor Thong Nguyen, for his valuable guidance, encouragement, support and consultation during my research. I greatly appreciate his enthusiasm in developing my research skills and advising on my thesis work.
vi
Tab
le
of
Contents
Abstract iii
Acknowledgments
Table of Contents vi
List of Figures ix
List of Tables xiv
Chapter One: Introduction 1 1.1 History of Fingerprints [1] 1 1.2 Use of Biometrics [2,29] 2 1.3 Advantages and Disadvantages of Fingerprint Identification/Verification 8 1.4 Need for Fingerprint Classification 8 1.5 Scope ofthe Thesis andthe Main Contributionstothe Field 10 1.5.1 Scope ofthe Thesis and Brief Description ofthe Main Processing Steps 10 1.5.2 List of Published Papers 12 1.6 Structure ofthe Thesis 12
Chapter Two: Pre-processing Techniques 14
2.1 Introduction 14
2.2 Contrast stretching [7] 14 2.3 Contrast enhancement using sigmoid function 15 2.4 Normalisation [8,21,27] 17
2.5 Conclusion 17
Chapter Three: Parameter Estimation Techniques 19
3.1 Introduction 19
3.2 Local Ridge Orientation Estimation 19 3.3 Local Ridge Frequency Estimation 21 3.4 Frequency Range Estimation 25
v
i
i
Chapter Four: Directional Gabor Filter and Enhancement Techniques 26
4
.1
In
t
roduc
t
ion
26
4
.2
Gabo
r
T
rans
fo
rm
28
4
.3
De
f
in
i
t
ion
o
f
Va
r
iab
les
and
Func
t
ions
29
4
.4
Un
i
ts
29
4
.5
One
-D
imens
iona
l
Gabo
r
F
i
l
te
r
in
Spa
t
ia
l
Doma
in
30
4
.6
Two
-D
imens
iona
l
Gabo
r
F
i
l
te
r
in
Spa
t
ia
l
Doma
in
31
4
.7
D
i
rec
t
iona
l
Gabo
r
F
i
l
te
r
in
Spa
t
ia
l
Doma
in
32
4
.8
Es
t
ima
t
ion
o
f
Gabo
r
F
i
l
te
r
's
Pa
rame
te
rs
fo
r
F
inge
rp
r
in
ts
33
4
.9
F
i
l
te
r
ing
F
inge
rp
r
in
ts
us
ing
D
i
rec
t
iona
l
Gabo
r
F
i
l
te
r
in
Spa
t
ia
l
Doma
in
33
4
.10
Two
-D
imens
iona
l
D
i
rec
t
iona
l
Gabo
r
F
i
l
te
r
in
Spa
t
ia
l
-F
requency
Doma
in
35
4
.11
F
i
l
te
r
ing
o
f
F
inge
rp
r
in
ts
us
ing
Gabo
r
F
i
l
te
r
in
Spa
t
ia
l
-F
requency
Doma
in
36
4
.12
D
i
rec
t
ion
and
F
requency
Se
lec
t
ive
Gabo
r
F
i
l
te
r
A
r
ray
38
4
.13
The
P
roposed
2
-D
F
i
l
te
r
ing
A
lgo
r
i
thm
39
4
.14
Conc
lus
ion
41
Chapter Five: Segmentation of Fingerprint Image 42
5
.1
In
t
roduc
t
ion
42
5
.2
Segmen
ta
t
ion
42
5
.3
Conc
lus
ion
44
Chapter Six: Performance Assessment of Fingerprint Enhancement 45
6
.1
In
t
roduc
t
ion
45
6
.2
Mo
rpho
log
ica
l
P
rocess
ing
o
f
B
ina
ry
Image
45
6
.2
.1
Bas
ic
Mo
rpho
log
ica
l
Ope
ra
t
ions
46
6
.2
.2
H
i
t
-and
-M
iss
T
rans
fo
rma
t
ion
47
6
.2
.3
Th
inn
ing
48
7
.1
In
t
roduc
t
ion
57
7
.2
Rev
iew
o
f
Fea
tu
re
Ex
t
rac
t
ion
Techn
iques
59
7
.2
.1
G
loba
l
Fea
tu
res
59
7
.2
.2
Loca
l
Fea
tu
res
61
7
.3
Qu
incunx
G
rad
ien
t
F
ie
ld
Es
t
ima
t
ion
61
7
.4
De
te
rm
ina
t
ion
o
f
S
ingu
la
r
Reg
ions
Us
ing
R
idge
F
low
Codes
63
7
.5
Loca
t
ing
S
ingu
la
r
Po
in
ts
on
a
F
inge
rp
r
in
t
65
7
.5
.1
S
ingu
la
r
Po
in
t
as
the
Cen
t
ro
id
o
f
a
S
ingu
la
r
Reg
ion
65
7
.5
.2
S
ingu
la
r
Po
in
t
as
Po
in
t
o
f
Max
imum
O
r
ien
ta
t
ion
Va
r
iance
67
7
.6
De
te
rm
ina
t
ion
o
f
Type
o
f
S
ingu
la
r
Po
in
ts
Us
ing
Po
inca
re
Index
70
7
.6
.1
Types
o
f
S
ingu
la
r
Po
in
ts
70
7
.6
.2
Po
inca
re
Index
71
7
.7
Ro
ta
t
ion
and
Sca
le
Inva
r
iance
o
f
S
ingu
la
r
Po
in
t
De
te
rm
ina
t
ion
Techn
ique
73
7
.8
De
te
rm
ina
t
ion
o
f
P
r
inc
ipa
l
Axes
Assoc
ia
ted
w
i
th
a
S
ingu
la
r
Po
in
t
75
7
.9
Conc
lus
ion
and
D
iscuss
ion
78
Chapter Eight: Fingerprint Classification 79
8
.1
In
t
roduc
t
ion
79
8
.2
Cu
r
ren
t
F
inge
rp
r
in
t
C
lass
i
f
ica
t
ion
Techn
iques
79
8
.2
.1
S
ingu
la
r
Po
in
t
App
roach
1
79
8
.2
.2
S
ingu
la
r
Po
in
t
App
roach
2
81
8
.2
.3
S
t
ruc
tu
ra
l
App
roach
83
8
.3
C
lass
i
f
ica
t
ion
us
ing
S
ingu
la
r
Po
in
ts
and
the
i
r
P
r
inc
ipa
l
Axes
84
8
.3
.1
De
te
rm
ina
t
ion
o
f
P
r
inc
ipa
l
Axes
84
8
.3
.2
Ru
les
fo
r
C
lass
i
f
ica
t
ion
85
8
.3
.3
Case
o
f
'Fa
t
'
Loops
86
8
.4
Expe
r
imen
ta
l
Resu
l
ts
and
Conc
lus
ions
88
Chapter Nine: Conclusion and Future Investigation 90
Appendix A: Examp_les of Experimental Results 92
L
ist
of
F
igures
Figure 1.1: An example of DNA characteristic [2] 3 Figure 1.2: An example of a face [2]. 4 Figure 1.3: An example of a finger with cuts [2] 5 Figure 1.4: An example of hand and finger geometry [2] 5 Figure 1.5: An example of aniris [2]. 6 Figure 1.6: An example of a signature [2] 7 Figure 1.7: An example of a voice [2]. 7 Figure 1.8: Example of a plain arch being first classifiedthenidentified by searching
the sub database of plain arch only. 9 Figure 1.9: Overview ofthe fmgerprint classificationtechnique proposedinthisthesis 9 Figure 2.1: (a) Originalimage, (b) Image after contrast stretching, (c) Histogram of the originalimagein (a), and (d) Histogram ofthe enhancedimagein (b). 15 Figure 2.2: Sigmoid shape with mean equalto 128 (thinline) and position of maximum sigmoid shapeinthe histogram 16 Figure 2.3: (a) Image after contrast enhancement and (b) Histogram oftheimagein
(a). 16
Figure 2.4: (a) Originalimage, and (b) Normalisedimage 17 Figure 2.5: Contrast-improved fingerprintimage usingthethree pre-processing
techniques. 18
Figure 3.1: Ridge orientation field superimposed on fmgerprintimage. 20 Figure 3.2: Oriented window superimposed on fingerprintimageinthe direction of
thelocal ridge orientation. 22 Figure 3.3: X-signature profile oflocal ridge-valley structure 23 Figure 3.4: (a) X-signature before applyinglow-pass filter. (b) X-signature after
Figure 4.2: Two-dimensional Gabor filterin spatial domain modulatedin x-direction 31 Figure 4.3: Responsein 4 directions: (a), (b) 45°, (c) 900 and (d) 135° 32 Figure 4.4: (.) Ridge positions 33 Figure 4.5: Results of filtering with 2-D directional Gabor filter: (a) originalimage, (b)filtered at 00,(c) at 45°, (d) at 90°, and (e) at 135° 34 Figure 4.6: 2-D Gabor filterinthe spatial-frequency domainin 0° direction. 36 Figure 4.7: Processing stepsin Gabor filteringinthe spatial frequency domain. 37 Figure 4.8: (a) Originalimage, (b)image spectrum before shifting, (c)image
spectrum after spectrum shifting and (d) filteredimage with enhanced vertical
ridges. 38
Figure 4.9: Results of a fingerprint filtered by a 2-D directional Gabor filtertunedto different directions: (a) 0°,(b) 45°, (c) 90° and (d) 135° 39 Figure 4.10: Linearinterpolation of filter bank's output. 39 Figure 4.11: Stepsinvolvedinthe proposed fingerprintimage enhancement algorithm.
40 Figure 4.12: (a) Enhancedimage with u0 fixedto 1/8 [3] and (b) Enhancedimage
from our algorithm [4]. 41 Figure 5.1: Binary mask. 43 Figure 5.2: (a) Originalimage and (b) Masked enhancedimage as foreground (in
ridge region) and background (in white). 43 Figure 6.1: Sets A, B and W with defining sets B1 and B2. 48 Figure 6.2: Result of hit-and-misstransformation 48 Figure 6.3: Set of rotated structuring elements 49 Figure 6.4: Set Athinned by successive application of structuring elementsin Figure
6.3 49
Figure 6.5: Rotated structuring elements used for furtherthinning. 50 Figure 6.6: (a) Thinnedimage, (b) Thinnedimageimproved by ourtechnique and (c)Thinnedimageimproved by m-connectivity [6]. 50 Figure 6.7: (a) Thinnedlines, and (b) Markedlocations ofline crossings detected usingthe above procedure. 51 Figure 6.8: (a) Thinnedlines with endings, and (b) Detectedline endings, marked
xi
Figure 6.9: Ridge bifurcation and ridge ending. 52 Figure 6.10: Line ending and crossing oflines 52 Figure 6.11: Minutiae: Ridge ending (circle) and ridge bifurcation (square). 52 Figure 6.12: Minutiae automatically detected fromimages (a)in Figure 4.12(a), and
(b)in Figure 4.12(b). 54 Figure 6.13: Stepsin assessingthe performance of a fingerprint enhancement
algorithm. 55
Figure 6.14: Examples ofinput fingerprint and results oftwo processing stages before minutiae extraction. 55 Figure 6.15: Extracted minutiae as ridge bifurcation ( ) and ridge ending (0) 56 Figure 7.1: Seven classes of fingerprint commonly foundin practice 58 Figure 7.2: Gabor filteredimagesin eight equally spaced direction [18]. 59 Figure 7.3: (a) Filteredimage using Gabor filter at 157.5°, (b) Tessellated blocks on
the filteredimage, and (c) Ridge feature map ofthe filteredimage [18]. 60 Figure 7.4: Estimated ridge orientation field superimposed onthe fingerprintimage.60 Figure 7.5: (a)-(h) Regions ofthe fingerprintin Figure 7.4 having eight orientation
intervals equally spaced at 22.5° 61 Figure 7.6: Gradient field on a 4x4 pixels quincunx grid 62 Figure 7.7: Estimated orientation using (a)the currenttechniques, and (b) our
technique. 63
Figure 7.8: (a) Quantisation mapping for ridge orientation, (b) Ridge orientation field of anisolated rightloop fingerprint, and (c)its ridge flow map. 64 Figure 7.9: (a) Tented Arch fmgerprint, (b)its ridge flow map, and (c)its singular
regions p=6 (in white) and flow region boundariesp=2 65 Figure 7.10: (a) Ridge flow map of a plain arch, (b) Singular regions p=3 (in white)
and flow region boundaries p=2, and (c) Singular points ofthe plain arch marked
b y c r o s s e s . 6 6
Figure 7.11: (a) Ridge flow map of atented arch, (b) Singular regions p=6 (in white) and flow region boundaries p=2, and (c) Singular point ofthetented arch marked
b y c r o s s e s . 6 6
Figure 7.12: (a) Ridge flow map of a whorl, (b) Singular regions p=6 (in white) and flow region boundaries p=2, and (c) Singular point ofthe whorl marked by
Figure 7.13: (a) Ridge flow map of aleftloop, (b) Singular regions p=6 (in white) and flow region boundaries p=2, and (c) Singular point oftheleftloop marked by
crosses 6 6
Figure 7.14: (a) Ridge flow map of a rightloop, (b) Singular regions p=6 (in white) and flow region boundaries p=2, and (c) Singular point ofthe rightloop marked b y c r o s s e s . 6 7 Figure 7.15: (a) Ridge flow map of atwinloop, (b) Singular regions p=6 (in white)
and flow region boundaries p=2, and (c) Singular point ofthetwinloop marked
by crosses. 67
Whorl 69
Figure 7.16: Marked singular points: (Left)located by centroidtechnique, and (Right) located by maximum variance of orientationtechnique 69 Figure 7.17: Definition of singular points and corresponding Poincareindices 70 Figure 7.18: (a) Rightloop with core and delta, and (b) Partial fingerprint of righ
t-looptype with missing delta. 70 Figure 7.19: Sensitivity of Poincareindex withthelocation ofthe summing contour. 72 Figure 7.20: Singular points detected by (a)-(c) centroid of singular regiontechnique under 00, 150 and 45° rotation, respectively, and (d)-(0 maximum variance of orientationtechnique under 0°, 15° and 45° rotation, respectively 74 Figure 7.21: Blocks of strengthp=3 (crosses) and p=4 (white dots)in an Arch class
fmgerprint,i.e. having no singular points 75 Figure 7.22: (a) A 9x9 block orientation mask with 3x3 block skip, (b) Orientation
mask superimposed ontothe rightloop fmgeiprint atthe core position, and (c) Masked region (in white) and surviving region (no fill) withinthe orientation
mask 77
Figure 7.23: Estimated principal axes of (a) atented arch, and (b) a rightloop 77 Figure 8.1: Block diagram showingthe stepsin fingerprint classificationtechniquein
[5]. 80
Figure 8.2: Distinguishing atented arch from aloop and a whorl fromtwinloops
[5,28]. 81
F
igu
re
8
.6
:
S
teps
fo
r
gene
ra
t
ing
p
ro
to
type
masks
[14
]
.
83
F
igure
8
.7
:
S
ingu
lar
po
in
ts
and
pr
inc
ipa
l
axes
(wh
i
te
l
ine
)
of
s
ix
c
lasses
of
f
inge
rp
r
in
ts
:
(a
)
and
(b
)
loops
,
(c
)
ten
ted
a
rch
,
(d
)
tw
in
loop
,
(e
)
who
r
l
and
(
f
)
p
la
in
a
rch
85
F
igu
re
8
.8
:
De
f
in
i
t
ion
o
f
the
re
la
t
ive
d
i
rec
t
ion
o
f
p
r
inc
ipa
l
axes
(a
)
r
igh
t
loop
,
(b
)
le
f
t
loop
,
(c
)
ten
ted
a
rch
,
(d
)
tw
in
loop
,
and
(e
)
who
r
l
.
86
F
igure
8
.9
:
Proposed
ru
le
-based
f
ingerpr
in
t
c
lass
i
f
ica
t
ion
a
lgor
i
thm
us
ing
s
ingu
lar
po
in
ts
and
the
i
r
p
r
inc
ipa
l
axes
87
F
igu
re
8
.10
:
Examp
le
o
f
a
le
f
t
loop
hav
ing
two
dom
inan
t
r
idge
o
r
ien
ta
t
ions
in
the
L
ist
of
Tab
les
Table 6.1: GI values of our enhancement algorithm when appliedto seven different
fingerprints. 55
Chapter One: Introduction
1.1 History of Fingerprints 111
Fingerprints were impressed on clay tablets for conducting business in ancient Babylon. Thumbprints were also discovered on clay seals in China many hundreds of years ago.
Marcello Malpighi, a professor of anatomy at the University of Bologna, mentioned the spirals and loops in fmgeiprints in one of his notes in 1686 but said nothing about using the patterns for classification or identification of individuals. Nine fingerprint patterns were published in a thesis in 1823 by Professor John Evangelis Purkinji, a professor of anatomy at the University of Breslau. However, he also said nothing about using the patterns for classification or identification of individuals. In July 1858, fingerprints were used for the first time on native contacts by Sir William Herschel, Chief Magistrate of the Hooghly district in Jungipoo, India. Herschel was the first person who was convinced that fingerprints were unique to individuals, as well as being permanent throughout an individual's life. In more recent history, Dr. Henry Faulds, a British Surgeon-Superintendent of Tsukiji Hospital in Tokyo, Japan, was interested in 'skin-furrows' made by finger marks on samples of 'prehistoric' pottery. Consequently, Faulds presented innovative methods for identification and classification of fmgerprints to the public, including to Charles Darwin in 1880. In the same year, the fingerprint and the use of printing ink for its acquisition was discussed as a means of personal identification in an article published in the Scientific Journal 'Nature'.
2
and Faulds already suspected, that fingerprints do not change throughout an individual's life, and that no two persons have exactly the same fingerprint. Even the fingerprints of identical twins are different By Galton's calculation, the probability of two individual fingerprints being the same was 1 in 64 billion. Galion used minutiae as the characteristics of fingerprint for identification. Nowadays, minutiae are still used and are often referred to as Galton's details. In 1892, the first criminal identification for proving the identity of a murderer was made by Juan Vucetich, an Argentinean police officer, using the bloody print left on a door post.
In England and Wales in 1901, Sir Edward Richard Henry began to use Galton's observation for fingerprint classification. The Henry Classification System is still in use today in all English speaking countries. In 1905, the U.S. Army began the use of fingerprints. During the next 25 years, U.S. law enforcement agencies were increasing the use of fingerprints for personal identification. One of the agency's officers, Edmond Locard, also proposed a specification for fingerprint identification. The number of minutiae points (Gahon's Details) proposed for matching between two fingerprints accepted as positive identification was 12. However, some countries had set their own standard for the number of matching points, but not in the U.S.
By 1946, the USA's FBI kept some 100 million fmgerprint cards in manually maintained files, and by 1971 the number had increased up to 200 million cards. Due to the introduction of the Automatic Fingerprint Identification System (AFIS), the files were separated into computerised criminal files and manually maintained civil files. Many of the manual files were duplicated for distributing to a neighbourhood of 25 to 30 million criminals and an unknown number of individuals in the civil files. Today, the FBI uses fingerprints as the primary method of identifying criminals. On the other hand, the technological advance of DNA testing has been developing to make identification more reliable but is not yet automatic. As a result, AFIS is still very popular in assisting the FBI in solving criminal cases.
1.2 Use of Biometrics 12,291
therefore depends on the application. A single biometric feature is usually insufficient for identifying a person. Therefore, a reliable biometric identification system is expected to incorporate many biometric characteristics that appropriately match the application. The most common biometric features are described in the following:
• DNA: DNA is abbreviated from Deoxyribo Nucleic Acid. The DNA is a one-dimensional feature of the ultimate unique code for one's individuality. Identical twins have the same DNA patterns. This fact is currently applied in the context of forensic applications for person identification [30]. The three recognised limitations of this biometric method are:
(i) contamination and sensitivity: The piece of DNA from an innocent subject can be easily stolen and abused for criminal purposes,
(ii) automatic real time recognition issues: DNA matching requires the expertise of DNA and the chemical methods are not set up for on-line non-invasive recognition, and
(iii) privacy issues: Information about DNA is sensitive to a person having certain diseases. An example of DNA is shown in Figure 1.1.
Figure 1.1: An example of DNA characteristic [2].
relationships, or (ii) the analytical model by which the face is represented as a weighted combination of a number of canonical elements. A face recognition system should automatically (i) determine that a face is present in the facial scanner, (ii) locate the face, if it has one, and (iii) recognise the face from any poses from a database. An example of a face is shown in Figure 1.2.
Figure 1.2: An example of a face [2].
5
Figure 1.3: An example of a finger with cuts [2].
• Hand and Finger Geometry: A human hand is characterised by its shape, size of
palm, and length and width of fmgers. These features are used in hand geometry
recognition systems [32]. Hand geometry-based verification systems have been
commercialised and installed in hundreds of locations around the world. The
advantage of the technique used for verifying hands is that it is simple, relatively
easy to use, and inexpensive. This simple technique does not require details on
the skin of the hand, and consequently the verification accuracy of the technique
does not appear to be affected by dryness and other physical damage to the skin.
The geometry of the hand is very distinctive because of its diverse variation.
Furthermore, hand geometry, e.g. size of palm or length and width of fmgers, may
change during the growth period of children. In addition, acquiring hand
geometry with rings on fingers, arthritis and an unnaturally posing hand, can
confuse hand geometry-based recognition systems. Hand scanners are usually
large because of the large size of hands. Some are smaller because they require
only a few fmgers (typically, index and middle) instead of an entire hand for
verifying. An example of hand and fmger geometry is shown in Figure 1.4.
• Iris: Theirisis an annular region ofthe eye segmented bythe pupil and sclera (i.e.the white ofthe eye) on either side. Inthe foetal development period,the visualtexture oftheirisis formed andthenis stabilised duringthe firsttwo years of childhood. The distinctive complexiristextureis used as a reliable biometric feature for personalidentification. The speed and accuracy of currentiris-based recognition systems [33]today are very promising, and pointto possible commerciallarge-scaleidentification systems. Iris and fingerprints are distinctive. Eventheirises ofidenticaltwins are different. However, motivation forthe use ofiristextureis extremely difficult becauseitis easy for a personto use an artificialiris, andiris-based recognition systems are expensive. An example of anirisis shownin Figure 1.5.
Figure 1.5: An example of aniris[2].
[image:20.554.59.480.60.464.2]Figure 1.6: An example of a signature [2].
• Voice:
Voice is a combination of physiological and behavioural biometrics. The
features of an individual's voice are used for synthesis of sound as shape and size
of the appendages (e.g. vocal tracts, mouth, nasal cavities, and lips). While
speech is invariant for a person of given physiological characteristics, part of the
• speech of a person changes in behavioural characteristics due to age, medical
conditions (such as the common cold), emotion, etc. In large-scale identification,
voice may not be appropriate and not very distinctive. A voice recognition system
[36,37] that is text-dependent is based on the utterance of a fixed predetermined
phrase. A voice recognition system that is text-independent recognises a speaker
regardless of what he/she says. The text-independent system is more difficult for
designing algorithms than text-dependent systems but gives more protection
*against fraud. Background noise is a sensitive factor in degrading efficiency of
voice recognition and this is a disadvantage for voice-based recognition. Many
sophisticated telephone systems incorporate speaker recognition facilities because
they are most appropriate and the most logical environments for phone-based
applications. The voice signal, however, is often so degraded by the telephone set
and by the communication channel that high accuracy for sophisticated
applications cannot be guaranteed. An example of a voice signal is shown in
Figure 1.7.
:As4i
The requirements of use of biometric techniques depend on the purpose of
application. Most operational environments cannot be manipulated by a single
biometric technique. Consequently, the biometric systems used are mostly designed
incorporating more than one technique in order to improve efficiency of the systems.
1.3 Advantages and Disadvantages of Fingerprint Identification/Verification
Advantages
In general, fmgerprints have unique physical or behavioural characteristics that cannot
be traded, shared, lost or stolen. Fingerprint recognition systems today can achieve
sufficient accuracy for both verification and identification purposes. They are also an
affordable and compact technology and are becoming more and more popular as a
consumer product.
Disadvantages
Not everyone has fmgerprints that can be recognised. The sensor is also not able to
capture acceptable quality fmgerprint images for people with very wet or very dry
skin. In addition, the sensor needs to be maintained properly in order to achieve
consistent performance.
1.4 Need for Fingerprint Classification
9
Fingerprint Classification
Template Database
Tented
Arch Left Right I Twin loop I L Output
Plain arch
Fingerprint IthIntification
Figure 1.8: Example of a plain arch being first classified then identified by searching the sub database of plain arch only.
(
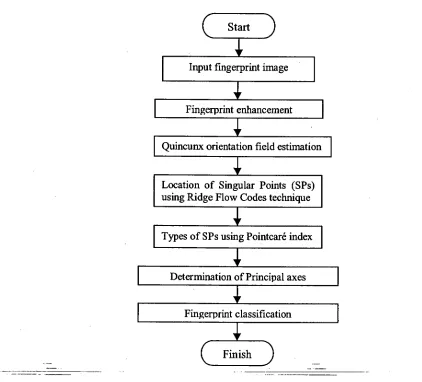
Start
)Input fingerprint image
Fingerprint enhancement
Quincunx orientation field estimation
Location of Singular Points (SPs) using Ridge Flow Codes technique
Types of SPs using Pointcare index
Determination of Principal axes
Fingerprint classification Yiv
( Finish )
[image:23.559.53.468.29.277.2] [image:23.559.43.465.336.718.2]1.5 Scope of the Thesis and the Main Contributions to the Field
1.5.1 Scope of the Thesis and Brief Description of the Main Processing Steps
The aim of the research work described in this thesis is to propose an accurate automatic fingerprint classification system. The system has the capability to classify a fingerprint into one of six classes: plain arch, tented arch, left loop, right loop, twin loop and whorl. A block diagram of an overview of the fingerprint classification system proposed in this thesis is shown in Figure 1.9. The technique assumes that the input fingerprint has not suffered from serious physical corruption or damage or missing parts. Techniques to handle these types of damaged fingerprints are beyond the scope of the thesis due to the time limit of a Masters thesis.
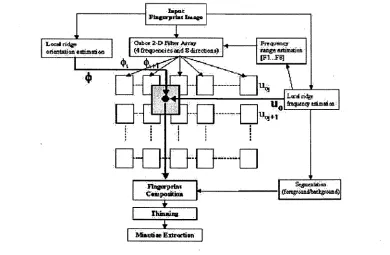
Fingerprint Enhancement: Fingerprint enhancement is applied for improving the clarity of the ridge structure of the input fingerprints. Apart from the standard pre-processing steps such as normalisation and histogram equalisation, filtering the input fingerprint with a Gabor filter has been very popular among researchers. Current techniques, e.g. [3,23,25] however, employ 2-D separable Gabor filter tuned to a fixed average ridge frequency. It is well known that on the same fingerprint the local ridge frequency can vary greatly. The new approach in this thesis [4] employs both orientation and frequency 2-D interpolation to obtain a filtered image with appropriate local parameters. Experimental results of our new approach have shown a significant improvement in clarity while retaining the original ridge structure.
11 Determination of Singular Points (SPs) using Ridge Flow Codes Technique: The location of an SP is determined using the newly proposed ridge flow codes technique. The codes are obtained by a simple quantisation of ridge, and the mapping of these codes over the fingerprint provides a compact and informative ridge flow pattern. The location of an SP is defined as the point of maximum orientation variance in a singular region, and therefore is the meeting point of as many flow codes as possible. SPs are classified into three types: ordinary, core and delta using the Poincare index. In current techniques [5,28], the Poincare index is used for concurrently determining both the location and type of an SP. Our new technique proposes to save time by first quickly locating the singular regions from the ridge flow map, then calculating the Pointcare index only to pixels in those regions to finally determine the location and type of SPs.
Determination of Principal Axes: This is one of the main contributions to the field from this thesis. The types and locations of SPs are insufficient for fingerprint classification purposes. Consequently, we introduce the new concept of principal axes associated with a singular point [6]. Principal axes, representing the dominant directions of ridge flow in the immediate vicinity of a core point, serve as valuable quantitative ridge flow features for creating rules for fingerprint classification.
1.5.2 List of Published Papers
C
.
K
l
imanee
and
D
.T
.
Nguyen
,
"On
the
Des
ign
o
f
2
-D
Gabo
r
F
i
l
te
r
ing
o
f
F
inge
rp
r
in
t
Images
,"
Proceed
ings IEEE International Consumer Communications and Networking Conference CCNC'04,Caesar
's
Pa
lace
,
Las
Vegas
,
Nevada
USA
,
6
-9
Janua
ry
2004
.
C
.
K
l
imanee
and
D
.T
.
Nguyen
,
"C
lass
i
f
ica
t
ion
o
f
F
inge
rp
r
in
ts
us
ing
S
ingu
la
r
Po
in
ts
and
Pr
inc
ipa
l
Axes
,"
Submittedto IEEE International Conferencein Image Processing ICIP'04,S
ingapo
re
,
24
-27
Oc
tobe
r
2004
.
C
.
K
l
imanee
,
A
.V
.
Tr
inh
,
and
D
.T
.
Nguyen
,
"Accura
te
De
term
ina
t
ion
o
f
S
ingu
lar
Po
in
ts
and
Pr
inc
ipa
l
Axes
on
a
F
ingerpr
in
t
,"
Subm
ittedto IEEE Region 10 International Conference TENCON2004,Ch
iang
Ma
i
,
Tha
i
land
,
21
-24
November
2004
.
1.6 Structure of the Thesis
The
s
t
ruc
tu
re
o
f
the
thes
is
is
b
r
ie
f
ly
ou
t
l
ined
as
fo
l
lows
:
Chap
te
r
2
desc
r
ibes
the
p
re
-p
rocess
ing
s
teps
such
as
h
is
tog
ram
s
t
re
tch
ing
,
h
is
tog
ram
equa
l
isa
t
ion
us
ing
a
s
igmo
id
func
t
ion
,
and
no
rma
l
isa
t
ion
.
These
techn
iques
a
re
used
for
remov
ing
no
ise
and
improv
ing
c
lar
i
ty
o
f
images
.
However
,
the
techn
iques
can
imp
rove
the
c
la
r
i
ty
o
f
the
r
idge
and
va
l
ley
s
t
ruc
tu
re
.
Chap
ter
3
descr
ibes
the
parame
ters
es
t
ima
t
ions
necessary
for
the
enhancemen
t
o
f
f
inge
rp
r
in
ts
us
ing
a
Gabo
r
f
i
l
te
r
.
Th
is
inc
ludes
the
es
t
ima
t
ion
o
f
the
o
r
ien
ta
t
ion
f
ie
ld
,
the
es
t
ima
t
ion
o
f
loca
l
r
idge
f
requency
,
and
the
es
t
ima
t
ion
o
f
f
requency
range
.
13
proposed to adaptively tune the filter to the correct local ridge orientation and
frequency of ridge in order to obtain a better output filtered image.
Chapter 5 describes the segmentation of the fingerprint into foreground and
background areas before the minutiae extraction process.
Chapter 6 studies the operations of the mathematical morphology necessary for
minutiae extraction such as opening, closing and hit-and-miss operation. These
operations are used for thinning binary images before minutiae detection is possible.
The accuracy of the minutiae extraction is used for assessing the performance of the
proposed enhancement technique using a
goodness index.Chapter 7 proposes a new Singular Point detection technique making use of the
efficiency of our high-resolution technique for orientation estimation. This chapter
describes the detection of SPs using ridge flow codes and the Pointcare index. The
sensitivity of the Pointcare index to the location of the summing contour is carefully
studied and presented. Furthermore, the new approach for determining principal axes
using the histogram technique with an orientation mask is also covered in this chapter.
Chapter 8 proposes a rule-based algorithm for classifying a fingerprint into one of six
well-known classes: plain arch, tented arch, right loop, left loop, whorl and twin loop.
The rules are derived from the characteristics of SPs and their associated principal
axes.
Finally, Chapter 9 concludes the thesis with a direction for future research and
improvement.
UNIVERSITY
L..
14-Chapter
Two:
Pre-process
ing
Techn
iques
2.1 Introduction
Th
is
chap
te
r
p
resen
ts
the
p
re
-p
rocess
ing
techn
iques
used
in
th
is
thes
is
fo
r
enhanc
ing
the
con
t
ras
t
o
f
f
inge
rp
r
in
t
images
,
bu
t
no
t
the
c
la
r
i
ty
o
f
the
r
idge
and
va
l
ley
s
t
ruc
tu
re
.
The
three
techn
iques
chosen
are
con
tras
t
s
tre
tch
ing
,
con
tras
t
enhancemen
t
us
ing
s
igmo
id
func
t
ion
,
and
the
no
rma
l
isa
t
ion
techn
ique
.
The
f
i
rs
t
ope
ra
t
ion
,
the
con
t
ras
t
s
tre
tch
ing
techn
ique
is
app
l
ied
to
norma
l
ise
the
in
tens
i
ty
of
the
image
from
the
or
ig
ina
l
range
to
the
fu
l
l
range
of
greysca
le
(0
-255
)
.
The
second
opera
t
ion
,
the
con
t
ras
t
enhancemen
t
us
ing
a
s
igmo
id
func
t
ion
,
is
used
to
enhance
the
con
t
ras
t
o
f
the
image
by
emphas
is
ing
dark
and
l
igh
t
reg
ions
in
the
h
is
togram
.
F
ina
l
ly
,
the
no
rma
l
isa
t
ion
techn
ique
is
app
l
ied
to
no
rma
l
ise
the
image
to
a
g
iven
des
i
red
mean
and
va
r
iance
.
Th
is
chap
ter
is
organ
ised
as
fo
l
lows
:
Sec
t
ion
2
exp
la
ins
the
con
tras
t
s
tre
tch
ing
techn
ique
.
Sec
t
ion
3
descr
ibes
the
con
tras
t
enhancemen
t
us
ing
s
igmo
id
func
t
ion
.
Sec
t
ion
4
exp
la
ins
the
no
rma
l
isa
t
ion
techn
ique
.
2.2 Contrast stretching 171
Th
is
techn
ique
is
used
to
imp
rove
an
image
by
s
t
re
tch
ing
the
range
o
f
in
tens
i
ty
va
lues
f
rom
the
o
r
ig
ina
l
range
to
a
new
range
.
I
t
is
a
s
imp
le
l
inea
r
mapp
ing
o
f
the
inpu
t
to
the
ou
tpu
t
.
For
examp
le
,
a
f
ingerpr
in
t
image
in
greysca
le
is
norma
l
ised
from
the
o
r
ig
ina
l
range
(
lowe
r
=
0
and
uppe
r
=
211
)
to
a
new
range
(e
.g
.
0
—25
.5
fo
r
a
s
tanda
rd
8
-b
i
t
g
reysca
le
p
ic
tu
re
)
by
(2
.1
)
d — cwhe
re
1
50 100 150 200 250 0 50 100 150 200 2501600 1400 1200 1000 030 GOO 400 200 0 0
1600 1400 1200 1030 000 600 400 200 0
15
b: Upperlimit ofthe new range c: Lowerlimit ofthe original range d: Upperlimit ofthe original range
An experimental resultis shownin Figure 2.1in whichthe histogram ofthe original imagein (c)is stretchedto givethe histogramin (d).
(a) (b)
(c) (d)
Figure 2.1:(a) Originalimage,(b) Image after contrast stretching,(c) Histogram ofthe originalimagein(a), and(d) Histogram ofthe enhancedimagein(b).
2.3 Contrast enhancement using sigmoid function
[image:29.554.58.502.22.601.2]Out = MeanI(1—cos(—Lnxit)) 255 where
Out: Pixel value ofthe enhanced outputimage Mean: Mean value of pixelsinthe originalimage
In: Pixel value ofthe originalinputimage
Figure 2.2: Sigmoid shape with mean equalto 128(thinline) and position of maximum sigmoid shapeinthe histogram.
The result shownin Figure 2.3, after applyingthe sigmoid-shaped mapping function tothe originalimage, gives an obvious contrastimprovement. The histogramin Figure 2.3 (b) has been enhancedinthe dark andlight regions comparedtothe histogram ofthe originalimage shownin Figure 2.1 (c).
16
(2.2)
(a)
1
1
1
1
0
1
1
50 100 150 200 600
Mid
250
(b)
...-.• je;;;---...,,..,....•..._.---......
-....-■,.7-5-../'.t-,1--..---...- .
'
,
•
I
"
I
,
_
1
:
k
i'
'
t •A1/4SV.:k\.VI '"*.'V. V .•1/
4
4,':'. itk t\i';;111
11
,
■
i-t
Z.•-%.V.Si, .%-k .4
■
'Z:,'`'S.1/4.' ■
17
2.4 Normalisation [8,21,27]
Mostinput fingerprintimages contain a varying greyscale acrossthe fingerprintthat can beimproved using a normalisationtechnique. Thistechnique canimprovethe clarity oftheimage butit cannot enhancethe details ofthe ridge and valley structures.
Let /(i,j) denotethe greylevel of a pixel at coordinates (i,j) intheimage; Mi and Vi denotethe mean and variance, respectively, calculated overthe entire originalimage; MdandVddenotethe desired mean and variance, respectively; and N(i,j) denotesthe normalised greylevel ofthe pixel at (i,j). The normalisation oftheimage's grey levelsisthen givenin Equation (2.3).
V
Mid) " Md +11 d
V (- (i — M ) 2 Md d I(
if /(i,j) > Mi
otherwise
(2.3)
Figure 2.4 shows a result of normalisation.
(a) (b)
Figure 2.4: (a) Originalimage, and(b) Normalisedimage
2.5 Conclusion
normalisation of the mean and variance of the image. The pre-processing gives a clear contrast improvement to the image as shown in Figure 2.5.
19
Chapter
Three:
Parameter
Est
imat
ion
Techn
iques
3.1 Introduction
Th
is
chap
te
r
p
resen
ts
the
techn
iques
fo
r
es
t
ima
t
ing
pa
rame
te
rs
o
f
the
enhancemen
t
techn
ique
in
Chap
ter
4
.
Gabor
f
i
l
ter
is
bo
th
frequency
-se
lec
t
ive
and
or
ien
ta
t
ion
-se
lec
t
ive
and
can
be
tuned
to
co
r
respond
ing
f
requency
and
o
r
ien
ta
t
ion
o
f
loca
l
r
idges
in
order
to
improve
c
lar
i
ty
of
r
idge
s
truc
ture
and
remove
undes
ired
no
ise
in
f
inge
rp
r
in
t
image
.
Consequen
t
ly
,
the
Gabo
r
f
i
l
te
r
is
used
fo
r
enhanc
ing
a
f
inge
rp
r
in
t
.
Therefore
,
those
parame
ters
es
t
ima
t
ions
w
i
l
l
be
men
t
ioned
w
i
th
the
techn
ique
invo
lved
as
f
requency
range
es
t
ima
t
ion
in
th
is
chap
te
r
.
Th
is
chap
ter
is
organ
ised
as
fo
l
lows
:
Par
ts
2
,
3
and
4
exp
la
in
the
loca
l
r
idge
o
r
ien
ta
t
ion
,
loca
l
r
idge
f
requency
and
f
requency
range
es
t
ima
t
ions
,
respec
t
ive
ly
.
3.2 Local Ridge Orientation Estimation
The
r
idge
o
r
ien
ta
t
ion
f
ie
ld
is
a
map
o
f
loca
l
b
lock
o
r
ien
ta
t
ions
.
A
b
lock
o
r
ien
ta
t
ion
is
def
ined
as
the
mos
t
dom
inan
t
of
r
idge
or
ien
ta
t
ions
a
t
a
l
l
the
p
ixe
ls
in
the
wxw
(usua
l
ly
8x8
or
l6x16
)
b
lock
.
Le
t
the
es
t
ima
ted
or
ien
ta
t
ion
f
ie
ld
be
0
(
i
,
j
)
where
(
i
,
j
)
a
re
the
coo
rd
ina
tes
o
f
the
cen
t
re
p
ixe
l
o
f
the
b
lock
,
and
the
re
is
an
imp
l
ied
amb
igu
i
ty
o
f
180°
in
the
r
idge
d
i
rec
t
ion
.
I
t
is
obv
ious
tha
t
the
dom
inan
t
r
idge
o
r
ien
ta
t
ion
o
f
a
b
lock
corresponds
approx
ima
te
ly
to
the
d
irec
t
ion
perpend
icu
lar
to
the
dom
inan
t
d
i
rec
t
ion
o
f
the
powe
r
spec
t
rum
o
f
the
same
b
lock
.
The
la
t
te
r
is
exac
t
ly
the
dom
inan
t
d
irec
t
ion
of
the
r
idge
grad
ien
t
0
.
In
th
is
chap
ter
we
use
the
leas
t
mean
square
a
lgor
i
thm
in
[9
]
to
es
t
ima
te
(P
(
i
,
j
)
then
9
(
i
,
j
)
=
90°-0(
i
,
j
)
.
The
resu
l
t
as
g
iven
in
[8
,20
,24
]
is
0(i,j) =
2
Vx(
i
,
j)(3
.1
)
in
wh
ich
the
ve
r
t
ica
l
and
ho
r
izon
ta
l
con
t
r
ibu
t
ions
a
re
respec
t
ive
ly
i+w/ 2 J +w/ 2and
i+w/ 2 j+w/ 2
I
(Gx2(x, y) —Gy2(x,y)} x=i-w/2 y=j-w/2(3.2b)
wherethe horizontal gradientG x (x, y) andthe vertical gradientG y(x, y) at each pixel
(x,y) may be calculated using a simple 3x3 Sobel edge mask or a more sophisticated gradient operator.
Duetothe presence of noise and distortion,the estimated orientation fieldis not smooth. In orderto carry outlowpass filtering (atthe blocklevel) onthe orientation field,the filtering hasto be performed onthe components Vx(1,j)and 11),(i,j)
separately. 2-D Lowpass filtering using a simple 5 block x 5 block kernel W(m,n)is usedto give smoothed j)andry(i,J). The final smoothedlocal ridge gradient becomes
j)= tan-I(Vy ,(i' ) (3.3)
(i,./)
Figure 3.1 showsthe ridge orientation field 0(i,j) of a scratched fingerprintthatis used as a standard sample fortheinternational fingerprint verification competition FVC2002 [10].
90°
p e
adient Ridge
Orientation
G
180°
Letthelocalridge gradient be A/(x, y) =
pe
t
'
=Gx
+
jG
y
whereGx
=
p
co
s
0
and Gy =p sin 0. Thenthe square of gradientis0,
02 p 2ej20= p2[cos20 +jsin 20]p 2
s
in
20
2p
2
sincos
p 2COS
20
p 2 (COS2—
sin20
)
i+w12 j+w12
x,2GxG
I
Y
V
Mean
squa
re
o
f
(M
)=
x=i-w12 y=j-w12,
let = [—Y
i+w/ 2 j+w/2
E
E
(Gx
Vx]
2_Gy2) x=i_w,2y=j-w/ 2
The most dominant gradient directionistherefore,
1
V
0
= —tan'2
Vx
or
0
= —1tan-I 2i+w12 j+w12
E2GxGy
x=i-w12 y=j-w12 i+w12 j+w12
E I
(G
x=i-w12 y=j-wl 2
21
To estimate the local ridge frequency we adopt the x-signature approach in [8]. Figure 3.3 illustrates the technique. For each 8x8 pixels block centred at (i,j), we define a rectangular lxw=32x8 pixels window, oriented at right-angles to the ridge direction 9(i,j) estimated from 4)(i,j) in (3.3) above. Next we compute the x-signature {X(0), X(1), ....X(31)}, i.e. the image intensity variation along the window orientation, where each X(k) is the average value along the ridge and valley direction within the rectangular window, i.e.
1 '
X (k) = -
1,
I d (4,V)W d=0 where the co-ordinates
u = 1+ (d — w 1 2) cos° (i , j) + (k — 1 1 2)sin0(i, j), v = j + (d — w 1 2)sin 0(1, j) — (k — 1 12)cos 0(i, j).
Figure 3.2: Oriented window superimposed on fingerprint image in the direction of the local ridge orientation.
As an example, consider the local ridge orientation of a block centred at coordinates (i=250, j=100). The block is highlighted by the black bar on the fingerprint image in Figure 3.2. The coordinates in the orientated window are calculated by (3.5).
If there are no minutiae and other singular points in the window, the x-signature forms a sinusoidal wave, and the local ridge frequency can be reliably estimated. For the FBI scanning standard of 500dpi, this frequency ranges from 3 to 25 pixels per pitch
(3.4)
-
23
between ridges. If the estimated inter-ridge pitch is outside this range, or if the x-signature does not form a well-defined sinusoidal wave, the estimated frequency of the block is rejected. If there are not too many of these bad blocks, their local frequencies can be interpolated from the frequencies of the neighbouring blocks.
Figure 3.3: X-signature profile of local ridge-valley structure.
Ridges and valleys along the local orientated window are shown in Figure 3.3(a). Equation (3.4) estimates the x-signature shown in Figure 3.3(b). Ridge frequency f
(u,v) can be estimated from the peak-to-peak pitch values of the sinusoidal wave of the x-signature. The processing steps of the estimation are as follows:
Step]: Estimate the local ridge orientation in the block centred at (i,j).
Step2: Define a rectangular window, oriented along the local ridge direction of the block centred at (i,j).
Step 3: Calculate the average intensity of ridge and valley in the rectangular window in order to obtain the x-signature. Figure 3.3(b) shows the x-signature of averaged intensity of ridge and valley in the rectangular window.
![Figure 1.5: An example of an iris [2].](https://thumb-us.123doks.com/thumbv2/123dok_us/8450914.336365/20.554.59.480.60.464/figure-an-example-of-an-iris.webp)