Comprehensibility of UML-based Formal Model – A Series
of Controlled Experiments
Rozilawati Razali
Dependable Systems and Software Engineering Group (DSSE) School of Electronics and Computer
Science (ECS)
University of Southampton, UK
[email protected]
Colin F. Snook
Dependable Systems and Software Engineering Group (DSSE) School of Electronics and Computer
Science (ECS)
University of Southampton, UK
[email protected]
Michael R. Poppleton
Dependable Systems and SoftwareEngineering Group (DSSE) School of Electronics and Computer
Science (ECS)
University of Southampton, UK
[email protected]
ABSTRACT
This paper summarises two controlled experiments conducted on a model that integrates the use of semi-formal notation, the Unified Modelling Language (UML) and a formal notation, B. The experiments assessed the comprehensibility of the model, namely UML-B. The first experiment compared the comprehensibility of a UML-B model and a B model. In the second experiment, the model was compared with an Event-B model, a new generation of B. The experiments assessed the ability of the model to present information and to promote problem domain understanding. The measurement focused on the efficiency in performing the comprehension tasks. The experiments employed a cross-over design and were conducted on third-year and masters students. The results suggest that the integration of semi-formal and formal notations expedites the subjects’ comprehension tasks with accuracy even with limited hours of training.
Categories and Subject Descriptors
D.2.1 [Software Engineering]: Requirements/Specifications – languages, methodologies, tools.
General Terms
Measurement, Experimentation, Human Factors, Languages
Keywords
Notation Comprehensibility, Semi-formal and Formal Notations, Empirical Assessment
1. INTRODUCTION
Semi-formal (graphical) notation such as Unified Modelling Language (UML) [1] is generally intuitive but lacks mechanisms for proving its accuracy. Formal notation such as B [2] is capable of such proof but it is not always easy to understand. By integrating semi-formal and formal notations, a more
comprehensible and accurate model can be produced. Such integration also means incorporating graphical and textual representations. Studies have shown that graphical and textual representations together are more effective in portraying information than textual alone [3]. Thus, it is legitimate to hypothesise that the integration of semi-formal and formal notation is better than using formal notation alone.
One approach called UML-B [4] combines the formal notation, B and the semi-formal notation, UML. The motivation behind this integration is that B has strong industrial supporting tools such as Atelier-B [5] and B-Toolkit [6] to verify the accuracy of the model, and UML has become the de facto standard for system development. In the following paragraphs, two controlled experiments conducted on UML-B are discussed. The main objective of both experiments was to explore whether or not the notation used in UML-B could improve model comprehensibility. The terms of comprehensibility however differ between the two. In the first experiment, the comprehensibility focused on the ability of model viewers to recognise the meaning of the presented information. In the second experiment, the notion of comprehensibility was extended to include problem domain understanding. The latter focused on the ability of model viewers to use the presented information in novel situations. Section 2 of the paper provides a brief description of UML-B. Section 3 and 4 discuss the first and second experiment respectively.
2. UML-B
There are two versions of UML-B. UML-B1 described in this
paper is a graphical formal modelling notation based on UML and Event-B. Event-B is a formal notation evolved from B. In the earlier version, UML-B was based on UML and B.
UML-B’s modelling environment includes a built-in translator U2B, which generates an Event-B model from a UML-B model. The Event-B model is analysed and verified by the built-in verification tools. Verification errors are fed back and displayed on the UML-B model. This process is done automatically whenever the UML-B model is saved [7]. In short, the graphical modelling environment of UML-B allows the development of a formal model through the use of visual objects at the abstraction
1This work is part of the EU funded research project: IST 511599 RODIN (Rigorous Open Development Environment for Complex Systems). Permission to make digital or hard copies of all or part of this work for
personal or classroom use is granted without fee provided that copies are not made or distributed for profit or commercial advantage and that copies bear this notice and the full citation on the first page. To copy otherwise, or republish, to post on servers or to redistribute to lists, requires prior specific permission and/or a fee.
level. The supporting tools ensure the model is verifiable and thus accurate.
UML-B provides a top-level Package diagram for showing the
structure and the relationships between components (corresponding to Event-B Machines and Contexts) in a project. Contexts are described in a Context diagram (similar to a class
diagram but having only constant data and associated constraints) and Machines are specified in a Class diagram. Hierarchical Statemachines can be attached to classes to describe their
behaviour. A notation, B (micro B) that borrows from the Event-B notation, is used for textual constraints and actions. B has an object-oriented style dot notation that is used to show ownership of entities (attributes, operations) by classes.
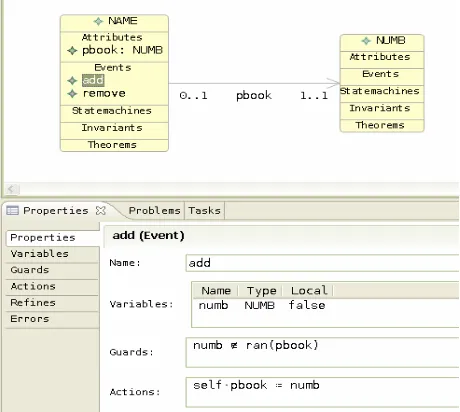
To give a flavour of UML-B, consider the specification of the telephone book in Figure 1. The classes, NAME and NUMB
represent people and telephone numbers respectively. The association role, pbook, represents the link from each name to its corresponding telephone number. Multiplicities on this association ensure that each name has exactly one number and each number is associated with, at most, one name. The properties view shows B conditions and actions for the add event. The
add event of class NAME adds a new name to the class. It non-deterministically selects a numb, which must be an instance of the class, NUMB, but not already used in a link of the association
[image:2.612.321.556.70.248.2]pbook (see B guard), and uses this as the link for the new instance (see B action). The remove event has no B action; its only action is the implicit removal of self from the class NAME. This specification is equivalent to the Event-B model shown in Figure 2, which is generated by U2B automatically.
Figure 1. UML-B specification of a phone book
Figure 2. Event-B specification of a phone book
3. FIRST EXPERIMENT
The experiment aimed to evaluate the notation used (state variable) in UML-B to explore whether it could improve model comprehensibility. The evaluation was based on the comparison made between a UML-B model and an equivalent B model (purely developed from scratch). The UML-B model was developed by using the earlier version of UML-B. The measurement used in the evaluation focused on the efficiency in performing the comprehension task, that is, accuracy over time. The following paragraph briefly explains the experiment. The detailed elaboration can be found in [8].
The experiment was a cross-over trial [9] and a paper-based exercise. At one session, one group of subjects was assigned a task on the UML-B model while the other was assigned the same task on an equivalent B model. The reverse was then carried out in the subsequent session. The measured comprehension criteria include the interpretation of the symbols used, the tracing of input and output, the mapping between models and problem domains, and the modification task on the models. The response variables were
Score (accuracy) and Time taken to answer the questions. The
Score and Time taken were used to determine the measure of efficiency; Rate of scoring (Score over Time taken). There were
two types of comprehension measurement and analysis; Overall comprehension task and Comprehension for modification task.
The results indicate with 95% confidence that a UML-B model could be up to 16% (Overall comprehension) and 50%
(Comprehension for modification task) easier to understand than the corresponding B model.
4. SECOND EXPERIMENT
(REPLICATION)
[image:2.612.60.290.414.620.2]presented information but also to extend the understanding of the presented information in novel situations such as problem solving. The rationale of this investigation is twofold. First, stakeholders communicate and reason about a problem domain to improve their understanding of it. Without deep understanding of the problem domain, the proposed solutions may not meet the requirements. Second, stakeholders are skilled human beings who use complex cognitive processing when perceive and understand things. When interpreting a model, it is believed that they do not simply “vacuum” the presented information into their mind. Rather, they actively process the information by selecting only the relevant information, organise the selected information into meaningful mental representations and integrate them with other knowledge. Interpreting a model can thus be seen as knowledge construction where stakeholders actively make sense of a problem domain rather than passively receive the information
4.1 Theoretical Background
The second experiment was based on the Cognitive Theory of Multimedia Learning (ML) [10]. In many aspects, understanding a problem domain and the characteristics of the UML-B model itself coincide with the concepts demonstrated by the theory. Multimedia in the theory refers to the presentation of material using both words and pictures. The premise is that people can better understand an explanation when it is presented in words and pictures than in words alone. The process of multimedia learning is viewed as building a coherent knowledge structure. The goal is to help people to understand and to be able to use what they learned.
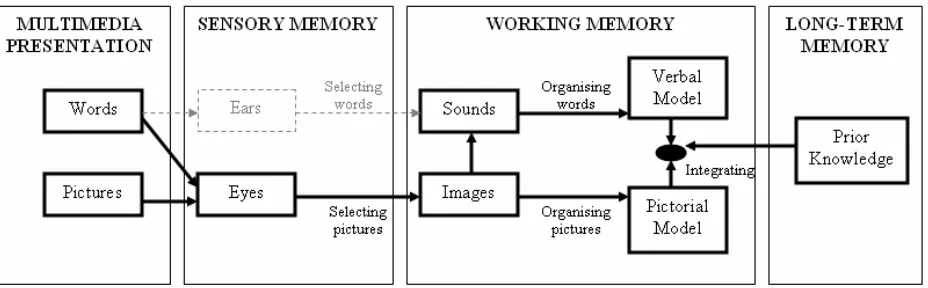
The ML integrates three other cognitive theories; Dual-coding Theory [11], Cognitive Load Theory [12] and Working Memory Model [13]. There are three primary assumptions. First, words and pictures are processed through separate and distinct information processing channels. Second, each processing channel is limited in its ability to process information. Third, processing information in channels is an active cognitive process designed to construct coherent mental representation [14]. The Figure 3 below illustrates this process.
4.2 Research Question and Hypotheses
The research question and hypotheses for the second experiment
were: Does a UML-B model promote or foster better understanding of problem domain than an Event-B model?
Null hypothesis: The UML-B model is no better than the Event-B
model in fostering problem domain understanding.
Alternative hypothesis: The UML-B model is better than the Event-B model in fostering problem domain understanding.
A one-sided alternative hypothesis was employed because UML-B can only be considered as worthwhile if its notation could overcome the inaccessibility of formal notation such as used in Event-B.
The ML enables a presumption that a UML-B model (words and pictures) should be more comprehensible than an Event-B model (words only). The Figure 4 provides an explanation for the presumption. It illustrates how the information presented by a UML-B model (words and pictures) flow into the eyes. The words and pictures then become images in the working memory. The images from pictures are organised into pictorial models, where the pictures change from the basis of images to the basis of meaning. Meanwhile, the images from the printed words are transformed as sounds in the working memory through
phonological loop [13]. The idea of phonological loop is that the
working memory processing for verbal information involves a “mind’s voice” and a “mind’s ear”. When visually presented verbal information such as printed word is encoded, the word is “voiced” into a sound-based or auditory-phonological code. The
[image:3.612.79.544.519.662.2]sounds are then organised into verbal models where the words change from the basis of sounds to the basis of meaning. The verbal and pictorial models are then integrated with prior knowledge to form a meaningful understanding. In contrast, an Event-B model does not have pictures. Therefore, the information presented in the Event-B model is heavily processed in one channel that is responsible for processing words. This leads to qualitatively unbalanced processing between the two channels. As a result, the mental models are not well developed in the working memory.
4.3 Method
The second experiment was a replication of the first experiment. Thus, the nature of the notations (graphical and textual versus textual alone), the design of the experiment (cross-over trial) and the protocol used remained the same as in the first experiment. In fact, the same response variables were used; Score (accuracy) and
Time taken. They were used to determine the measure of
efficiency; Rate of scoring. These variables were expected to be
influenced by the state variable, that is, the notations used in the models.
The questions on the models however were different from the first experiment. In particular, they focused on the construction of knowledge structures, which can be demonstrated by the ability of the subjects to explain cause-and-effect, compare and contrast two elements, describe main ideas and supporting details, list a set of items and analyse a domain into sets and subsets [15]. These criteria were used together with Bloom’s Taxonomy [16] as the measurement instrument in the second experiment.
Similar to the first experiment, the experiment had a related within-subject design where each of the subjects was trained and assigned a task on both models (UML-B and Event-B). As there were two treatments to be tested, the subjects were allocated randomly into two groups. To reduce variability across groups, the blocking and balancing techniques were applied. The subjects were blocked based on their ability on the object-oriented technology and formal methods. Each subject from each block was then randomly assigned to one of the groups. Each group therefore comprised a mixture of subjects from various blocks of ability. As the distribution was balanced between groups, both groups were considered as equivalent. The experiment was designed in such a way that at one point in time, one group was assigned a task on the UML-B model while the other was assigned the same task on an equivalent Event-B model. The reverse was then carried out later. The experiment had two treatments to be examined in two consecutive sessions. Therefore, four models that represented two separate problem domains were developed. Both the UML-B and Event-B models for each session were made equivalent where the information contained in one model was also inferable from the other. Moreover, the models for the second session were made equivalent in complexity to the first session so that the treatment effect to be tested remained. The models however were made different enough in subject matter to avoid confounding the
second session with learning gained from the first session. For each problem domain, the UML-B model had one Package
diagram that contained one Context diagram, one Class diagram with two classes and two State diagrams with two states each.
There were about 130 lines of script for each of the Event-B models.
There were six questions in each model and the questions were the same for both UML-B and Event-B models. The six questions were divided into two main categories; three questions assessed the subjects’ ability to recognise the presented information and the rest assessed the subjects’ ability to extend the understanding in novel situations. The former category involved description of main ideas, process and comparison of operations. The latter category included model modification, proposal of new solutions and criticising models for better solutions. These two categories acted as the basis for the analysis and hypotheses testing.
Unlike the first experiment, the second experiment was an online exercise where the subjects viewed the given models on the computer screen. It was conducted in a two-hour slot. The slot was divided into two sessions with forty-five minutes each. There was a fifteen-minute break between the sessions to mitigate any learning effect. Subjects were given a specific model and its questionnaire in each session. The instruction sheet was given at the beginning of the first session. The subjects were not allowed to talk to each other but were allowed to refer to notes. After the allocated time had passed, the questionnaire was collected whether or not the subjects had completed answering all the questions. Prior to the experiment execution, the protocol and the materials used in the experiment were reviewed and approved by the University’s Ethics committee. A pilot study that involved seven postgraduate students was also conducted. This was to ensure the accuracy of the materials and the feasibility of the tasks.
4.4 Subjects
[image:4.612.74.538.85.229.2]There were thirty-six students that participated in the experiment; eighteen third-year Undergraduate students and eighteen Masters students of Computer Science and Software Engineering courses at the University of Southampton, United Kingdom. They were students from Europe and Asia. The international students, who came from outside the United Kingdom constituted half of the subjects and the proportion of women to men was 1:4. The subjects were taught formally on B for about eight hours, one hour on Event-B and one hour on UML-B. All subjects had gone
Table 1. Rate of scoring distribution for Recognition task Min 1st
Q
Mean Med 3rd
Q
Max Std Dev
N
C1 :U
0.30 0.45 0.65 0.63 0.76 1.27 0.26 18
C1 :E
0.27 0.38 0.57 0.53 0.73 0.93 0.22 17 (1)
C2 :U
0.58 0.82 1.14 1.11 1.32 1.81 0.40 17 (1)
C2 :E
0.32 0.50 0.75 0.77 0.93 1.33 0.29 18
U 0.30 0.61 0.89 0.77 1.18 1.81 0.41 35
E 0.27 0.42 0.66 0.68 0.84 1.33 0.27 35
Table 2. Rate of scoring distribution for Understanding task Min 1st
Q
Mean Med 3rd
Q
Max Std Dev
N
C1 :U
0.00 (1)
0.28 0.85 0.85 1.32 1.75 0.59 18
C1 :E
0.00 (1)
0.43 0.71 0.70 0.97 1.63 0.42 17 (1)
C2 :U
0.33 0.68 1.07 1.12 1.44 2.00 0.49 17 (1)
C2 :E
0.18 0.41 0.71 0.74 0.95 1.56 0.36 18
U 0.00
(1)
0.51 0.96 1.04 1.33 2.00 0.55 35
E 0.00
(1)
0.41 0.71 0.73 0.97 1.63 0.38 35 through courses on the object-oriented technology and formal
methods at some points of their studies. The subjects were in the final semester of their respective courses and had reasonable amount of experience and knowledge of software development. Some of the Masters students had some work experience for at least a year. They were the next generation of professionals. Thus, they represented closely the population under study; software stakeholders.
4.5 Results
The Rate of scoring was the measure of interest as it considered both accuracy and duration of comprehension, that is, efficiency. The scale used for the Rate of scoring
was marks per minute (marks/min). This means a model
with a higher Rate of scoring is better than otherwise
since it indicates a higher accuracy with least time taken to understand the model.
There were two types of analysis, which were based on the two categories of questions mentioned earlier. One was the efficiency in recognising the presented information (Recognition task) and the other was the
efficiency in extending the understanding in novel situations (Understanding task). The measures were obtained by calculating the total Score and Time taken for
the three questions in each category.
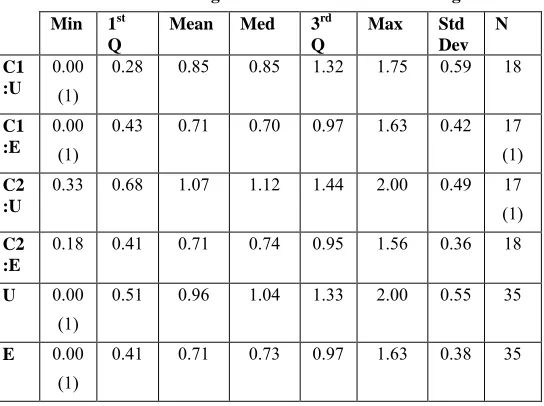
The Table 1 and 2 below illustrate the measures of center and spread for the Recognition task and Understanding task. Column Min shows the minimum values, column 1st
Q shows the first quartile values, column Mean shows the average values, column Med shows the median or middle
values, column 3rd Q shows the third quartile values,
column Max shows the maximum values, column Std Dev
shows the degree of variation, and column N gives the
number of collected data. Rows C1:U and C1:E present
the Rate of scoring of UML-B model and Event-B model respectively for the first case study. Rows C2:U and C2:E
present the Rate of scoring of the respective models for
the second case study. The last two rows present the grouped Rate of scoring based on the models used,
regardless of the case.
The analysis excluded the subjects who did not attempt the task, which numbers are stated in the brackets under the N column. On the other hand, the subjects who had
attempted the task for some time but failed to get any score were included in the analysis, which numbers are stated in the brackets under the Min column. The
implication of this data is that the subjects had struggled to understand the model or perhaps had misunderstood the model. Either possibility indicates that there was a problem on the model comprehensibility. This is the reason why they were included in the analysis
From the descriptive statistics shown below, it can be seen that the
Rate of scoring on the UML-B models is higher than the Event-B models. These differences may be a reflection of true differences in the population from which the samples were taken. On the other hand, it is possible that the differences may be due to sampling errors. In order to assume that the differences obtained from the samples to be true differences in the population, the standard statistical inference needs to be applied.
Like the first experiment, this experiment employed a robust statistical method called bootstrap methods and permutation tests for the statistical inference [17]. The bootstrap methods were used to calculate the standard errors and the confidence intervals, whereas the permutation tests were used to test the significance
level of the observed effects. The analysis was done using the S-PLUS® 7.0 for Windows-Enterprise Developer [18] software. The experiment employed a cross-over design and thus had to consider the period effect [9]. Period effect concerns the chances of detecting effects due to the session when the treatment is applied rather than the treatment itself. The analysis used in the experiment had taken care of the effect. The true treatment effect (t) that considers the period effect at 95% confidence interval for
the respective comprehension tasks are shown in the Table 3 below. They are the estimated differences between the expected
Rate of scoring under the UML-B model and that under the
Event-B model at 95% confidence interval.
[image:5.612.280.552.339.542.2]Table 3. Confidence intervals and p-values of comprehension tasks
Task 95% Confidence Interval
p-value (alternative > null)
Recognition 0.13 <= t <= 0.35 0.001
Understanding 0.11 <= t <= 0.39 0.003
the significance criterion (α=0.05). As indicated in the Table 3
below, the p-values for both comprehension tasks are less than 0.05 in favour of the UML-B model. This means that the difference in the treatment effect between the UML-B model and the Event-B model is statistically significant (P<0.05). This suggests that the UML-B model is more comprehensible than the Event-B model in terms of the efficiency in recognising the presented information and extending the understanding in novel situations. In other words, the UML-B is better than the Event-B model in fostering problem domain understanding.
5. CONCLUSIONS AND FUTURE WORK
This paper has presented two experimental comparison of the comprehensibility of a UML-based formal model (UML-B) versus a textual one (B and Event-B). This paper summarises the first controlled experiment but its main contribution is the second experiment (replication) conducted on the latest version UML-B. The results of both experiments indicate that a model that integrates the use of semi-formal and formal notations such as UML-B is capable of expediting the subjects’ comprehension task with accuracy even with limited training. In particular, the model enables the subjects to not only efficiently recognise the presented information but also extend the understanding in novel situations. This finding is appealing as it suggests that introducing some graphical features of a semi-formal notation into a formal notation significantly improves the formal notation’s accessibility.There are several ways in which the experiments and findings could be improved. One possible way is through replication, where the comprehensibility of UML-B model could be assessed using other cognitive theories such as Cognitive Fit [19]. It would be interesting to investigate the nature of problem that could be effectively presented by such a model and how the notation fits the required cognitive processes. This could improve the understanding of why such a model is more useful for problem understanding than its counterparts. In addition, as the experiments were conducted using students and “toy problems”, the replication could also involve using more experienced subjects and large-scale problems. Such studies could be conducted as quasi-experiments in industrial settings.
6. ACKNOWLEDGMENTS
Our thanks to students of COMP3011 Spring 2006 & 2007 for their participation and Dr. Paul Garratt for his help and advice.
7. REFERENCES
[1] Object Management Group. Introduction to OMG’s Unified Modeling Language (UML). [Online]. Available:
http://www.omg.org/gettingstarted/what_is_uml.htm, 2006. [2] Abrial, J.R. The B-Method - Assigning Programs to
Meanings, Cambridge University Press, 1996.
[3] Mayer, R.E., Bove, W., Bryman, A., Mars, R., and Tapangco, L. When Less is More: Meaningful Learning from Visual and Verbal Summaries of Science Textbook Lessons. Journal of Educational Psychology, 88, 1996, 64-73.
[4] Snook, C., and Butler, M. UML-B: Formal Modelling and Design Aided by UML. ACM Transactions on Software Engineering and Methodology, 15, 1, 2006, 92-122. [5] Steria, Aix-en-Provence, France, Atelier B, User and
Reference Manuals. [Online]. Available:
http://www.atelierb.societe.com/index uk.html (2007) [6] B-Core (UK) Limited, Oxon, UK, B-Toolkit, On-line
manual. [Online]. Available: http://www.b-core.com/ONLINEDOC/Contents.html (2007)
[7] Abrial, J. R., Butler, M., Hallerstede, S., and Voisin, L. An Open Extensible Tool Environment for Event-B. In
Proceedings of 8th International Conference on Formal Engineering Methods (ICFEM)(Macau, November 1-3 2006), LNCS 4260, 2006, 588-605.
[8] Razali, R., Snook, C. F., Poppleton, M. R., Garratt, P. W., and Walters, R. J. Experimental Comparison of the Comprehensibility of a UML-based Formal Specification versus a Textual One. In Proceedings of 11th International Conference on Evaluation and Assessment in Software Engineering (EASE)(Keele, UK, April 2-3 2007), 2007, 1-11. [9] Senn, S. Cross-over Trials in Clinical Research (Statistics in
Practice), John Wiley & Sons, 2002.
[10] Mayer, R.E. Multimedia Learning, Cambridge University
Press, 2001.
[11] Paivio, A. Mental representation: A dual coding approach, Oxford University Press, 1986.
[12] Chandler, P., and Sweller, J. Cognitive load theory and the format of instruction. Cognition and Instruction, 8, 1991,
293-332.
[13] Baddeley, A.D. Working memory, Oxford University Press, 1986.
[14] Mayer, R.E. The promise of educational psychology, Upper
Saddle River, Prentice Hall, 1999.
[15] Cook, L. K., and Mayer, R. E. Teaching readers about the structure of scientific text. Journal of Educational Psychology, 80, 1988, 448-456.
[16] Bloom, B. S., and Krathwohl, D. R. Taxonomy of Educational Objectives: The Classification of Educational Goals, by a Committee of College and University Examiners.
Handbook I: Cognitive Domain, Longmans, New York,
1956.
[17] Efron, B., and Tibshirani, R. An Introduction to the Bootstrap. Chapman and Hall, New York, London, 1993.
[18] Insightful Corporation. [Online]. Available:
http://www.insightful.com/products/splus/default.asp, 2006. [19] Vessey, I. Cognitive Fit: A Theory-Based Analysis of the
![Figure 3. The cognitive theory of multimedia learning [10]](https://thumb-us.123doks.com/thumbv2/123dok_us/8496260.346072/3.612.79.544.519.662/figure-cognitive-theory-multimedia-learning.webp)