Running head: SPATIAL EXPLORATION PATTERNS AND EFFICIENCY
Spatial Exploration Patterns Determine Navigation Efficiency:
Trade-off Between Memory Demands and Distance Travelled
Tamas Makany, Edward S. Redhead, & Itiel E. Dror
School of Psychology, University of Southampton Southampton, SO17 1BJ, United Kingdom
Telephone: +44 23 8059 6698
Abstract
Strategies reflect both structural commonalities and programmatic patterns in cognitive processes (Gordon, 2004). The value of a strategy reflects an optimized trade-off between the costs and benefits of the utilized behaviour. In the case of spatial navigation, a strategy refers to a mental representation of the navigator’s own position in relation to the surrounding spatial environment including a goal position and an intentional plan to reach that goal in an optimal way.
In previous studies of spatial search and navigation, the time in which a task is solved was taken as a rough indicator of underlying spatial ability – such as learning (e.g., Morris, 1981) or mental manipulations (e.g., Shepard & Cooper, 1982). Decreasing escape latencies in a water maze study, for example, would suggest that the animals are learning the spatial layout of the pool. However, it does not reveal much about the nature of learning, whether it was a qualitative or quantitative change (Thinus-Blanc & Gaunet, 1997). To analyse patterns of behaviour in spatial navigation further measures are required over the commonly applied method of latency.
Visible indices of navigation – like path choices or object visit sequences – are also measured with video recordings and independent observation tools with defined sets of coding guidelines (Graziano, Petrosini, & Bartoletti, 2003; Makany & Kallai, 2004).
Alternatively, automated algorithms can identify behavioural patterns within large datasets of spatial information, such as video surveillance of pedestrian movements (Helbing, Keltsch, & Molnar, 1997; Sas, O’Hare, & Reilly, 2003). In fact, pattern formation of any complex spatial system can be described by the inherent syntax that determines their physical appearance (Hillier, 1996). Exploratory patterns are the behavioural manifestations of spatial strategies, and the frequency of reoccurrence is a quantitative indicator of how well that spatial
An earlier study of navigation behaviour found that global patterns change over time as a result of spatial learning (Tellevik, 1992). Three patterns were observed while blindfolded participants searched for target objects inside a room. Two of them (perimeter and gridline) were determined by the size and the shape of the environment. In the perimeter case, the participants limited exploration to the border of the environment, while the gridline referred to a strategy where participants followed straight line from one side of the environment to the other. The third type of pattern was referred to as the reference-point strategy, where an object served as a point for each significant directional change. Tellevik argued that familiarity with the space allowed the participants to utilize object-to-object relationships rather than being preoccupied with the spatial characteristics of the environment (i.e. shape). Object based searching led to a better performance with a wider array of specific strategy patterns.
In a study by Kallai, Makany, Karadi, and Jacobs (2005) reoccurring patterns of
exploration behaviour were found to be good predictors of navigation performance and also as indicators for the temporal dynamics of spatial knowledge acquisition. Some patterns appeared more often during the early phases of spatial learning, such as the wall-following strategy, while others (e.g., visual scanning strategy) became more apparent, when a reliable representation of the space was formed. The authors concluded that human participants with poorer spatial abilities needed to periodically re-stabilize their positions in relation to the fixed perimeter, therefore they used the wall-following strategy more extensively. Whereas advanced navigators could benefit from linking the allocentric external landmarks to each other, which allowed them to reduce their walking distances and to switch to a more memory dependent strategy.
strategy enables a rough comprehension of the spatial relations, while back-and-forth movements refine the spatial knowledge, allowing a detailed and well-organized encoding. Consequently, the latter strategy leads to more efficient performance.
It should be noted however, that the reported optimal cyclic strategy in baboons by Gouteux, Vauclair, and Thinus-Blanc (1999) was, in fact, found to be non-optimal in the human data (Gaunet & Thinus-Blanc, 1996). This suggests that while animals utilize a more sequential exploratory strategy as their optimal foraging behaviour, humans achieve better scores if they were more concerned with constructing a detailed representation of the space. One interpretation of the discrepancy between the two sets of results could be that a
compromising mechanism sets the balance between cognitive load and travelled distance costs, in a sense that humans utilize their cognitive abilities better in spatial navigation tasks (Thinus-Blanc & Gaunet, 1997).
Despite the growing interest in recognising patterns of navigation, there is little understanding on how spatial knowledge acquisition and representation correspond to observable exploratory behaviour. Although a number of studies focusing on the
representation of spatial cues, such as landmarks or environmental geometry (e.g., Cheng & Newcombe, 2005), and on identifiable patterns during navigation (e.g., Thinus-Blanc & Gaunet, 1997) have been performed, investigations are needed to understand the relation between these two levels of spatial cognition.
behavioural performance with certain patterns of exploratory activity, and to provide plausible interpretations to how strategies manifest on each level of spatial navigation.
In this paper, we analysed initial exploratory patterns of human spatial navigation and related them to navigation patterns in a subsequent search task. Our first question was whether there are distinct patterns in initial exploration of a novel environment. We implemented an automated clustering algorithm in order to investigate emerging structural regularities within the routes of spatial exploration. The visual characteristics of these patterns would reflect on the preferred exploratory strategy. We further examined whether any pattern type during initial exploration would determine performance in subsequent structured navigation. A more intensive and spatially extensive search strategy would result in a better representation of the space, hence better performance scores in specific navigation tasks. However, human navigation performance and efficiency cannot be unequivocally determined by means of heuristic algorithms (see Mitchell, 2004 for a computational explanation of these algorithms), thus the measurements are dependent on how optimal performance is defined (MacGregor & Ormerod, 1996). Due to the complex nature of navigation behaviour, we measured performance in two different ways: one examined the size of the search space (Binary measure) and the other focused on the total travelled distance (Frequency measure). Conclusions about the human cognitive and energy cost-and-benefit optimization in spatial navigation tasks were drawn from the findings.
Method Participants
Apparatus
The experiment was conducted in a square room (L 3.5 m x W 3.5 m x H 2.5 m) with walls covered by black curtains that masked all spatial information outside the room. The room was evenly illuminated from the four corners by neon lights set in the ceiling. A speaker was hidden behind the curtains to communicate the tasks to the participants. A video camcorder was placed in the centre of the ceiling, to record the navigation activity from a bird’s eye-view perspective.
The room contained five visually identical open cardboard boxes placed in an irregular array on the floor. The dimension of the boxes was L 55 x W 55 x H 150 cm. A different object was placed inside each box. The five objects were similar sized coloured toys: a gorilla, a yellow bird, a ball, a frog and a puffin. An object could only be seen by leaning over the top of the box. This ensured that participants had to walk close to the box to explore its content.
Procedure
The participants were led by the experimenter to a starting position in the room with their eyes closed. The starting position was a fixed location in the closest corner to the entrance door throughout the whole experiment. On a spoken signal from the experimenter who had returned to the adjacent control room, the participants opened their eyes to begin their exploration. The camera on the ceiling recorded all navigation activity.
required to visit the objects in a predefined order. They first visited each object one-by-one (single) and then they had to link two or three (multiple) objects by visiting them in a fixed order. The required sequence of visits was the same for all participants. Participants carried out 5 single object and 6 multiple object visits. The purpose of this phase was to ensure that all participants have learnt the spatial layout of the room and the location of the objects. All participants finished at the position from where they had begun in Phase 1. Phase 3:
Participants were asked to visit 3 objects in any order they wished. This task was repeated 3 times (3 x 3 visits) with different combination of objects on each trial. All participants were given the same combinations whereupon they could choose their preferred order of visit.
Throughout the experiment, the participants were asked to find the objects as quickly and efficiently as possible, however there was no specific time limit on Phase 2 and Phase 3. After the last task was completed, the experimenter entered the room and lead the participant out.
Results Transcribing data
First, the navigation activity, recorded on videotape, was transcribed to a quantifiable format. The transcription implemented a 6x6 grid matrix, which represented the squared room from the perspective of the camera and the spatial positions of the participant was coded within this grid.
With such partition of the room, each of the five identical boxes occupied one square of the grid, leaving 31 positions free for navigation. The coding required that a participant could only occupy one square at a time, but stepping from one square to another could have
At the start, all 31 possible navigation positions were set to 0, and as the navigator entered a square, that value changed to either 1 (Binary measure: number of squares visited), or increased by 1 (Frequency measure: total number of visits). This numerical matrix
representation of the space allowed us to monitor the dynamics of the utilized spatial areas during both exploration and navigation (Phase 1 & 3, respectively).
Determining Exploratory Patterns: Hierarchical Cluster Analysis
Initial exploration patterns were grouped with a hierarchical cluster analysis. The clustering method was the complete linkage (furthest neighbour) with squared Euclidean distances. All the computations were carried out with the statistical software package SPSS 14.0 (SPSS Inc., 2005) A good clustering solution was deemed to have small within-cluster distances, and large between-cluster distances (Everitt, Landau, & Leese, 2001).
An inconsistently large jump within the similarity measure between joined clusters indicated a good termination point for the clustering procedure (Clatworthy, Buick, Hankins, Weinman, & Horne, 2005). In this study a rescaled distance cluster value of 20 was used to determine the termination of cluster splitting. With this criterion two clusters of recurring patterns were found, Axial and Circular labelled according to their visual appearance. There were 11 participants in the prior and 28 in the latter group. One participant’s (number 22) pattern did not belong to either of these clusters, and was excluded from further analysis. In the case of another participant (number 8), there was a videotape error resulting in this data also being omitted.
Determining Spatial Efficiency
represented the sum of squares with a maximum possible of 31 (all 36 squares minus the 5 squares with an object on them). The most spatially efficient score could be associated with the smallest size of the actively used space, whereat the task was still solvable.
Another way to measure efficiency is counting the actual frequencies of all the square visits within the grid (Frequency measure). Practically, this measure expressed the total travel distance in addition to its spatial distribution on the matrix. The sum could have infinitely increased, however the most efficient strategy reduced both the number of visited squares and the frequency to the possible minimum.
Figure 1 about here
Differences in Spatial Efficiency Based on the Exploratory Patterns
In the case of the Binary efficiency measure, where the matrix contained only 1 or 0, the independent groups two-tailed t-test revealed a significant difference between the mean spatial efficiency scores of the two pattern clusters [t (37) = 8.03, p<.001] with lower group means for the participants classed as Axial [Maxial = 10.64; SDaxial = 1.86] than for the
participants classed as Circular [Mcircular = 15.14; SDcircular = 1.46].
A different outcome was found when the Frequency measure was used where the matrix contained the number of visits for each position. The two exploratory pattern groups had significantly different spatial efficiency mean scores [t (37) = -2.12, p<.05]. The Axial group had longer paths (worse efficiency) [Maxial = 23.45; SDaxial = 3.42] than the Circular group
[Mcircular = 21.14; SDcircular = 2.93]. These group means for both Binary and Axial groups can
be seen in Figure 2.
on the z-scores with Binary versus Frequency scores (within) and Axial versus Circular patterns as the independent measures revealed a significant interaction between the efficiency measures and the exploratory patterns [F (1, 37) = 38.36, p<.001]. The main effect of scores was also found to be significant [F (1, 37) = 7.29, p<.05], so as the effect of exploratory patterns [F (1,37) = 6.29, p<.05] (see Figure 2 for the interaction).
Figure 2 about here
Further Data Considerations: Gender Effects
The results were further analysed to examine possible gender effects. There was no difference between the genders [t (37) = .89, n.s.] on the two exploration patterns. Binary task efficiency showed no gender effect either [t (37) = .14, n.s]. However, the Frequency measure revealed that males solved the navigation task more efficiently than females [t (37) = 3.50, p=.001; Mmale = 19.80; SDmale = 2.18; Mfemale = 23.04; SDfemale = 3.14].
Discussion
The present study investigated navigation task efficiency as a function of initial spatial exploration in a novel environment. Two distinct clusters of exploratory patterns (Axial & Circular) were found based on their emergent visual appearance. The data showed that search patterns reflect different strategies of spatial information acquisition and representation that determined subsequent navigation efficiency. Furthermore, a significant interaction in our data showed that navigation efficiency depended not only on initial exploratory patterns, but also on how optimal performance is defined.
(Helbing et al., 1997; Sas et al., 2003). However, these derived cluster patterns reflect only probabilistic categories based on the global visual features of the travelling paths.
Nevertheless, they are only meaningful in their functions, if they have an effect on navigation performance (Thinus-Blanc & Gaunet, 1997). The two exploratory patterns identified in our study were found to determine the subsequent navigation efficiency of participants.
Participants of each group subsequently performed differently in the navigational tasks (Figure 1).
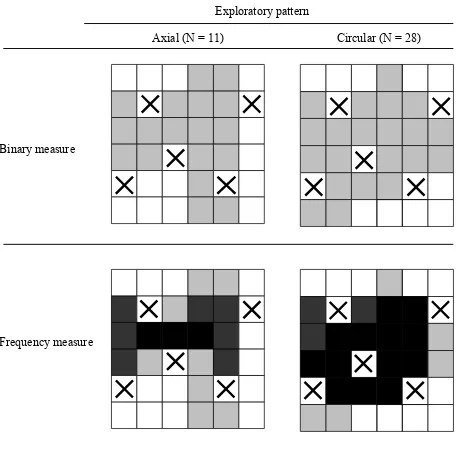
Members of the Axial group were exploring only a limited region of the space, without expanding their search area (top left corner of Figure 1). The explorations were mostly registered on the two main lateral axes of the room and focused around these artificial lines of the room geometry. Axial explorers preferred walking on these few routes, where objects could be remembered in a fixed sequence (low memory demand). Such an exploratory pattern indicates a cognitively economical, route-following strategy of spatial knowledge acquisition. They remained anchored to the centre of the space that served as a base (bottom left corner of Figure 1). Consequently, they had to make more journeys on the same routes, which resulted in higher overall distance travelled costs.
Circular explorers spread out to the more peripheral regions of the space, and included more closed circle trajectories around the centre of the room (right side of Figure 1). This group initially explored the space more intensively, which could have resulted in a more flexible spatial representation. Such exploratory pattern reflects a strategy with initially high memory and distance investments. In return, this exploratory pattern allowed Circulars to perform subsequent navigational tasks with less walking via more flexible route choices than Axials.
experiment these two approaches were represented by the Binary and Frequency measures, and the results were analysed both ways. The significant interaction between the two efficiency measures on the exploratory patterns suggests that efficiency in navigation depends on how optimal performance (energy optimum or cognitive optimum) is defined (Figure 2).
Furthermore, there is a relationship between the level of task complexity and the
optimization of the spatial strategies (Hartley, Maguire, Spiers, & Burgess, 2003). In complex navigation tasks, where inferential relations have to be represented (i.e., the cinema is in the downtown, a few blocks away from the central library), a flexible exploration strategy could enhance way-finding accuracy and efficiency. In such cases, reasonable cognitive effort has to be made to compute a novel route or select a previously learnt path. However, if the task is easy enough to be solved by the use of only simple action-based representations, a more rigid and routine series of spatial actions (i.e., following a few axial paths) could lead to a good level of performance. In such cases, any extra cognitive load would rather disturb the
execution of well-learnt route following. In simple tasks, a sequential solution could provide the best strategy with the most efficient paths. However, relying only on a single route for more complex navigation tasks could reduce the chance of finding the most optimal way. In fact, humans seem to apply more than one strategy for orientation and wayfinding, depending on both environmental and individual factors (see Lawton, 1996, for examples of navigational strategies). This flexibility and range of strategy representations has its
presented results, we argue that these early exploratory patterns determine subsequent navigation task performances.
Some aspects of spatial navigation are sensitive to gender differences (for a review, see Maguire, Burgess, & O’Keefe, 1999). Males are often found to be better in mental image maintenance and manipulation, whereas females have more rapid access and retrieval capabilities in spatial tasks (Loring-Meier & Halpern, 1999). In the present study, there was no difference between the exploratory patterns of males and females. The only difference in task efficiency that was found here showed that males could perform the navigation task with less intensive search (Frequency measure) than females. This result was however, not due to any difference in the spatial expansion of the search area, as the result on Binary measure did not show a significant gender effect. This suggests that initial spatial strategies are similar in the two genders and differences in performance are due to subsequent variations in
information processing that deserve more thorough investigation.
References
Cheng, K. & Newcombe, N. S. (2005). Is there a geometric module for spatial orientation? Squaring theory and evidence. Psychonomic Bulletin & Review, 12, 1-23.
Clatworthy, J., Buick, D., Hankins, M., Weinman, J., & Horne, R. (2005). The use and reporting of cluster analysis in health psychology: A review. British Journal of Health Psychology, 10, 329-358.
Esber, G. R., McGregor, A., Good, M. A., Hayward, A., & Pearce, J. M. (2005). Transfer of spatial behaviour controlled by a landmark array with distinctive shape. The Quarterly Journal of Experimental Psychology: Section B, 58, 69-91.
Everitt, B., Landau, S., & Leese, M. (2001). Cluster analysis (4th ed.). London: Edward Arnold Publishers Ltd.
Gaunet, F. & Thinus-Blanc, C. (1996). Early-blind subjects’ spatial abilities in the locomotor space: Exploratory strategies and reaction-to-change. Perception, 25, 967-981.
Gordon, A. S. (2004). Strategy representation: An analysis of planning knowledge. London: Lawrence Erlbaum Associates, Publishers.
Gouteux, S., Vauclair, J., & Thinus-Blanc, C. (1999). Reaction to spatial novelty and exploratory strategies in baboons. Animal Learning & Behavior, 27, 323-332.
Graziano, A., Petrosini, L., & Bartoletti, A. (2003). Automatic recognition of explorative strategies in the Morris water maze. Journal of Neuroscience Methods, 130, 33-44.
Hartley, T., Maguire, E. A., Spiers, H. J., & Burgess, N. (2003). The well-learnt route and the path less travelled: Distinct neural bases of route following and wayfinding in humans. Neuron, 37, 877-888.
Helbing, D., Keltsch, J., & Molnar, P. (1997). Modelling the evolution of human trail systems. Nature, 388, 47-50.
Kallai, J., Makany, T., Karadi, K., & Jacobs, W.J. (2005). Spatial orientation strategies in Morris-type virtual water task for humans. Behavioural Brain Research, 159, 187-196. Lawton, C. A. (1996). Strategies for indoor wayfinding: The role of orientation. Journal of
Environmental Psychology, 16, 137-145.
Loring-Meier, S. & Halpern, D. F. (1999). Sex differences in visuospatial working memory: Components of cognitive processing. Psychonomic Bulletin & Review, 6, 464-471.
MacGregor, J. N. & Ormerod, T. (1996). Human performance on the traveling salesman problem. Perception & Psychophysics, 58, 527-539.
Maguire, E. A., Burgess, N., & O'Keefe, J. (1999). Human spatial navigation: Cognitive maps, sexual dimorphism, and neural substrates. Current Opinion in Neurobiology, 9, 171-177.
Makany, T. & Kallai, J. (2004). Human spatial orientation and way-finding analysis with Ethovision in a real arena maze. Noldus News, 11, 3-4.
Mitchell, J. S. B. (2004). Shortest paths and networks. In J. E. Goodman & J. O’Rourke (Eds.), Handbook of discrete and computational geometry (pp. 607-641). New York, NY: CRC Press.
Morris, R. G. M. (1981). Spatial localization does not require the presence of local cues. Learning & Motivation, 12, 239-260.
Sas, C., O’Hare, G., & Reilly R. (2003). Online trajectory classification. In B. Ganter & A. de Moor (Eds.), International conference on computational science: Lecture notes in computer science 2659 (pp. 1035-1044). Berlin: Springer-Verlag.
Shepard, R. N. & Cooper, L. A. (1982). Mental images and their transformations. Cambridge, MA: MIT Press.
Acknowledgements
Figure 1. Superimposed matrices of the two patterns (Axial & Circular) found during the first
minute of exploration (Phase 1). The Binary measure shows only if a grid within the matrix was either visited (grey) or not-visited (white). The Frequency measure includes grey shadings according to how frequently that particular grid was visited (white = not visited; light grey = 1-10 visits; dark grey = 11-40 visits; black = over 40 visits).
Exploratory pattern
Axial (N = 11) Circular (N = 28)
Binary measure
Frequency measure
Figure 2. Significant interaction (p<.001) between measures of spatial navigation efficiency