PART 1- LITERATURE REVIEW
Cryptic Glacial Refugia
PART 2- EXPERIMENTAL THESIS
Chloroplast DNA variation in
Nothofagus cunninghamii
(Hook.) Oerst.
James Worth B.Sc.
Submitted in partial requirement for the degree of Bachelor of Science with
Honours.
School of Plant Science
University of Tasmania
DECLARATION
I hereby declare that this thesis contains no material which has been accepted for the award of any degree in any university and that to the best of my knowledge and belief, the thesis contains no copy or paraphrase of material previously published or written by any other person, except where due reference is made in the text.
ABSTRACT
Nothofagus cunninghamii (Hook.) Oerst. is the dominant component of most cool temperate rainforest in southeastern Australia. N. cunninghamii has a long history in the region and has endured through a period of great climatic changes, including the glacial-interglacial cycles. Currently the possible roles of glacial refugia, postglacial migration and long distance dispersal of seed are not well understood to explain the patchy
CONTENTS
Part 1- Literature Review
Chapter 1- Cryptic glacial refugia………1
1.1 Introduction………1
1.2 How can cryptic refugia be identified………4
1.3 What does the evidence say about cryptic refugia……….7
1.4 Conclusions………15
Part 2- Experimental Thesis
Chapter 2- Background………182.1 Introduction………..18
2.2 Explaining the current distribution of N. cunninghamii: glacial refugia, migration or long distance dispersal?………..20
2.3 Chloroplast DNA………..23
Chapter 3- Materials and Methods………28
31. Sampling Strategy……….28
3.2 Molecular Methods………30
Chapter 4- Results………35
4.1 Polymerase Chain Reaction……….35
4.2 Restriction Digestion………35
4.3 Genetic relationships and descriptions and description of haplotypes………….38
4.4 Distribution of haplotypes……….45
Chapter 5- Discussion………49
5.1 Low variation of chloroplast DNA………49
5.2 Biogeographical inferences from the distribution of hapolytes in N. cunninghamii………52
5.3 Future Research………...57
Appendix 1………59
Appendix 2………63
Acknowledgements………..64
PART 1:
LITERATURE REVIEW
Cryptic Glacial Refugia
James Worth B.Sc.
Submitted in partial requirement for the degree of Bachelor of Science with
Honours.
School of Plant Science
University of Tasmania
Chapter 1: Cryptic glacial refugia
CHAPTER 1
Cryptic glacial refugia
1.1 Introduction
The extensive climatic fluctuations of the Quaternary (the glacial-interglacial cycles), involved large, and sometimes very rapid changes in temperature, precipitation and CO2 concentration (Davis and Shaw 2001). Changing climates posed problems for the survival of species, and caused major changes in the world’s vegetation (Huntley and Birks 1983). This work reviews the intense current debate on where species survived during these extreme conditions of the Quaternary ice ages. Consideration is made of both plants and animals, but the focus is on the survival of plants, especially forest trees, which have received most research attention. The Quaternary refers to the last 1.6 million years (Comes and Kadereit 1998). The last full glacial cycle began at the end of the last interglacial (135 thousand years ago) when the world climate proceeded to glacial conditions. The glacial lasted approximately a hundred and seventeen thousand years ago, giving way to the present interglacial approximately 14000 years ago (Hewitt 1996).
1.1.2 What are refugia?
Chapter 1: Cryptic glacial refugia
2
warm adapted species of temperate forests, unable to tolerate conditions, experienced local extinction. However, for widespread species, not all of their range was equally affected, and they were able to survive where conditions were suitable (Stewart and Lister 2001; Hewitt 1996). In the literature these areas are called refugia, with glacial refugia used to describe an area where a species survived throughout the entire last glacial period (Ravazzi 2002).
Fragmentation of species ranges during glaciations is commonly used to explain current biogeographical patterns, such as the distribution of endemic (Kirkpatrick and Fowler 1998) and disjunct plant populations (McGlone 1985; Schonswetter et al. 2003). This hypothesis relies on the species not having recovered their former range, but presumably being in the process of doing so (McGlone 1985). The second explanation for disjunctions involves an origin via long distance dispersal (McGlone 1985). However, until recently palaeoecologists have not given equal consideration to this hypothesis (Pielou 1991) in part due to a lack of understanding of the mechanisms underlying long distance transport. However, Jordan (2001) has demonstrated that observable traits of species can be used to estimate their probability of long distance dispersal.
Chapter 1: Cryptic glacial refugia
eventually complete introgressive replacement, may enable the former species to increase their range faster than through seed dispersal alone (Potts and Reid 1988).
Northern Hemisphere forest expansions from refugia are considered to have been rapid, involving long distance dispersal of seed (Hewitt 1996), and covering vast areas on a continental scale (Willis 1996). High genetic diversity of forest trees in southern Europe, for example, relative to northern areas has led to the hypothesis that colonization involved a series of bottlenecks (Hewitt 1996). Firstly, migration may have happened only from the northern fringes of refugia (Taberlet et al. 1998). Long distant dispersants from this fringe established a distance away from the main wave of expansion, which then were the progenitors of colonization of surrounding areas (Ferris and King 1998). The southern populations in refugia may have been prevented from contributing due to being blocked by the northern expanding populations (Vogel et al.1999). This process would lead to only a subset of the overall genetic diversity in refugia colonizing areas left vacant by the retreating glaciers (Grivet and Petit 2002; Ferris et al. 1999), while the majority of diversity remains in situ in refugial areas (Vogel et al. 1999).
The intensity of glaciations has differed significantly between hemispheres, with the northern hemisphere experiencing massive ice sheet coverage and an extensive periglacial conditions at middle and high latitudes. In the mid latitudes of the southern hemisphere glaciation was not as extensive during the ice ages (Hewitt 1996), with less continuous ice cover (Premoli et al. 2002).
1.1.3 What are cryptic refugia?
Chapter 1: Cryptic glacial refugia
4
sylvestris; Cruzan and Templeton 2000), have led to the ‘cryptic’ refugia hypothesis (Stewart and Lister 2001). It proposes that to explain these apparent anomalies temperate plants may, in fact, have been able to survive the aridity and cold of the full glacial in situ, protected in favourable microclimates (Stewart and Lister 2001). These areas are called ‘cryptic’ glacial refugia, as they are unexpected because of: 1) our understanding of the tolerance and/or adaptive range of species (e.g. McVean 1964); 2) models of glacial climatic conditions (e.g. temperature, aridity and ice coverage, e.g. Kullmann 2002); 3) predictions of biogeographical histories of species from current distribution patterns, and 4) available pollen evidence. In northern Europe, for example, small isolated populations of trees protected by favourable microclimates could have been the origin of temperate tree pollen found in northern and central Europe during the last glacial, which is usually explained as originating via long distance dispersal from southern glacial refugia, or as having been reworked from interglacial deposits (Willis et al. 2000; Stewart and Lister 2001; Carrion et al. 2003). The concept of cryptic glacial refugia suggests a more complex role of glacial refugia in shaping the world’s biota (Stewart and Lister 2001), and may be relevant to southern hemisphere biogeography.
1.2 How can cryptic refugia be identified?
1.2.1 Pollen
Chapter 1: Cryptic glacial refugia
Schauffler 2002). In addition, very small populations (e.g, low density, Bennett 1985) may be undetectable through palynological studies (Birks 1989). Therefore, although fossil pollen can be useful to identify local presence of some plant species, its usefulness is limited for wind-pollinated species, species that reproduce vegetatively, or species with a small number of individuals.
1.2.2 Macrofossils
Macrofossils could provide the most direct evidence for the identification and characterisation of cryptic refugia (Stewart and Lister 2001). This is due to the fact that macrofossils can often be identified to species level, and are rarely transported long distances (e.g Field et al. 2000, but see Tallantire 2002). Sites with fossil of autochthonous origins, e.g, logs in peat bogs, (Kullmann 2002); fossil middens of woodrats or sticknest rats (Lyford et al. 2003); charcoal (Willis et al. 2000); and tree stumps preserved in growth position (Rowell et al. 2001) are particularly useful as they enable precise reconstruction of past vegetation but unfortunately such sites are rare (Rowell et al. 2001). The accuracy of radiocarbon dating methods used is of crucial importance in fossil studies, in order to distinguish between true cryptic refugia (i.e survival through the entire glacial period) and isolated populations that were established by long distance dispersal long before the main expansion from distant refugia (Lyford et al. 2003).
1.2.3 Molecular techniques
Chapter 1: Cryptic glacial refugia
6
Chapter 1: Cryptic glacial refugia
1.3 What does the evidence say about cryptic refugia?
In this section fossil and molecular evidence are discussed primarily in reference to temperate trees of Europe, and in particular, their survival in cryptic refugia during the height of the last glacial (approximately 23,000-18,000 years ago). However, evidence for other examples of cryptic refugia are given for regions outside Europe, and in different plant groups (e.g alpine plants).
1.3.1 Fossil evidence
There is abundant pollen evidence that, in Europe and North America, temperate trees survived the ice ages in southern glacial refugia well south of the icesheets (Huntley and Birks 1993; Soltis et al. 1997). The pollen evidence has suggested that glacial refugia occurred in the mountains of the Mediterranean peninsulas (Iberia, Italy, and the Balkans) (Huntley and Birks 1983; Bennett et al. 1991; Denefle et al. 2000), the coast of the Black Sea (Tarasov 2000), and in California, Mexico and Florida in North America (Hewitt 1996; Davis 1976; Soltis et al. 1997). Tzedakis et al. (2003) considered that there is no pollen evidence indicating postglacial colonization of temperate trees from central and northern Europe.
Chapter 1: Cryptic glacial refugia
8
dated as occurring 18,000 years ago in Slovakia (Stewart and Lister 2001). Macrofossils recovered from Paleolithic sites in northern Spain, dated between 17,000BP and 15,000BP (uncalibrated), have revealed diverse assemblages of temperate and Mediterranean species suggesting a full glacial tree refugium (Carcaillet and Vernet 2001). Carcaillet and Vernet (2001) consider that while these records indicate the presence of tree species during the full glacial in central Europe, the type of vegetation, whether forest, woodland, or treed steppe-tundra with prostrated individuals, cannot be determined. However, Willis et al. (2001) noted that these records may be unreliable as many of the macrofossil charcoal assemblages have poor chronological control.
A recent study by Willis et al. (2000) identified macroscopic charcoal particles from 31 full glacial sedimentary sequences in Hungary. While boreal trees Picea, Larix, and Pinus dominated, at one site, the temperate tree Carpinus betulus was present. This finding was considered by Willis et al. (2000) to be inconsistent with regional glacial climatic conditions predicted for this time. Independent fossil mollusk evidence from the same site supported this anomalous finding, with temperate species dominating the mollusk assemblage. Willis et al. (2000) interpreted these findings as indicating that there were “oases” in central Europe where temperate flora and fauna could survive in situ through the full glacial conditions. These microenvironments could be the product of the increased humidity and protection from wind afforded by the surrounding coniferous trees (Willis et al. 2000). Analogous communities of conifers with small pockets of temperate trees are found at the southern edge of modern boreal forests (Willis et al. 2000). Carcaillet and Vernet (2001) questioned the occurrence of Carpinus betulus this far north, suggesting that the wood anatomy of C. betulus is very hard to distinguish from that of C. orientalis, a drought resistant shrub (Grivet and Petit 2003).
Chapter 1: Cryptic glacial refugia
generally considered to be required for tree species), suggests that, when climatic reconstructions are considered, stunted trees could have survived in refugia on the coast of Norway during the last glacial maximum, enabled by the relative temperate conditions of the ocean (Stewart and Lister 2001). A long distant dispersal origin, however, could explain the early arrival of trees in the Swedish Scandes. In the same region fossil leaves and fruits of oaks (Quercus), elm (Ulmus), hazel (Corylis) and alder (Alnus) dated at between 8500-8000 years before present indicate the early arrival of temperate trees soon after deglaciation (Stewart and Lister 2001). A Norwegian coastal refugium is supported by the findings of fossil Red Squirrel (Sciurus vulgaris) in cave deposits close to the Norwegian Coast, a species with a close association with both P. abies and P. sylvestris (Kullmann 2002).
Overall, the macrofossil evidence suggests that a number of temperate trees may have survived through the glacial in some regions of northern and central Europe, with strong evidence for survival of hornbeam (Carpinus betulus) at least as far north as Hungary (Willis 1996). Further fossil discoveries are needed to better understand the glacial history of temperate trees in Europe, such as the location and species composition of cryptic refugia and their northern limit.
Chapter 1: Cryptic glacial refugia
10
1.3.2 Molecular evidence
1.3.2.1 Southern refugia vs. cryptic refugia hypothesis
Chapter 1: Cryptic glacial refugia
1.3.2.2 Scottish populations of Pinus sylvestris
Scot’s pine, Pinus sylvestris, is widely distributed in western Europe, extending from Norway to the mountains of southern Spain (Sinclair et al. 1999). A highly disjunct population occurs in the northwest of Scotland (Sinclair et al. 1999), the origin of which has been the subject of great interest and investigation. Birks (1989), using isochrone pollen mapping techniques, demonstrated that two separate postglacial expansions in abundance of P. sylvestris pollen occurred, one in northwestern Scotland between 8500 and 7900 years ago and independently in southern England, approximately 9500years ago. Considering the predictions of the severity of the climate in Scotland and the extent of glaciation (Birks 1989; Taberlet et al. 1998) during the Last Glacial, it has generally been considered that P. sylvestris could not have survived (Godwin 1975) and must have dispersed there during the postglacial (Birks 1989). High nuclear genetic diversity in the Scottish populations, despite considerable range contraction by natural and human causes (Kinloch et al. 1986) and evidence from mitochondrial DNA (Sinclair et al. 1999) has provided strong evidence for a contrary origin in a cryptic refugium (Sinclair et al. 1999; Cruzan and Templeton 2000; Stewart and Lister 2001). This finding is consistent with the recognition as a separate taxonomic variety of the Scottish populations (Kinloch et al. 1986; Birks 1989).
1.3.2.3 Alpine plants of the European Alps
Chapter 1: Cryptic glacial refugia
12
populations and Central Alp populations in the subalpine perennial herb Erinus alpinus (Stehlik et al. 2002a) and the alpine herb Rumex nivalis (Stehlik 2002). In addition, the distribution of two divergent groups of cpDNA haplotypes identified in the perennial cushion plant Eritrichium nanum indicate survival of the species on separate nunataks in the west and east central Alps during the ice ages (Stehlik et al. 2002b). In situ survival could be a common response of alpine plants to the Quaternary glaciations (Stehlik et al. 2002b). However, an AFLP study of the high alpine plant Phyteuma globulariifolium does not indicate survival in the glaciated Central Alps, but rather survival in peripheral ice-free areas (Schonswetter et al. 2002), which may reflect the stochastic nature of plant survival in these areas.
1.3.2.4 Cryptic refugia of Fagus grandifolia and Acer rubrum
In North America, Clark (2002) surveyed the distribution of cpDNA variation in two eastern North American tree species, American beech (Fagus grandifolia) and red maple (Acer rubrum) with a resultant pattern suggesting that in both species populations survived in cryptic refugia at higher latitudes than expected from pollen evidence, close to the Laurentide Ice Sheet.
1.3.2.5 Eastern Tasmanian forest glacial refugia
Chapter 1: Cryptic glacial refugia
Chapter 1: Cryptic glacial refugia
14
1.3.3 Cryptic populations
The fossil and molecular studies described above have been interpreted as evidence for species tolerating the full glacial conditions in favourable microclimates. In the modern environment situations analogous to these past refugia are not uncommon. Populations, or even individuals, have been found surviving in areas that are unexpected, outside the estimated tolerance range of the species. Microenvironments are created by a combination of factors related to topography, geology and climate (Danin 1999). There are many known examples of this phenomenon of which a small number will be discussed here.
In central Sahara, a total of 233 individuals of the conifer, Cupressus dupreziana survive in ravines and wadis, where (although highly variable) average annual rainfall amounts to 30 mm (Abdoun and Beddiaf 2002). In the deserts and steppe of Jordan, the Sinai and Israel, mesophytic plant species occur in the crevices of rocks and around permanent springs (oases) (Danin1999). For example, Pistacia atlantica, a tree normally found occurring in open forests in the moist areas of Israel, is found in the Negev Highlands (100 mm rainfall per annum) in the water accumulation zone of a large smooth faced limestone outcrop. The population size of some species in these desert refugia can be very low, with for example, only three individuals of the tree species Arbatus andrachne surviving near springs in south-western Jordan (Danin 1999). It survives in an area with less than 200 mm of annual rainfall whereas the closest trees live with 500-600 mm of annual rainfall in northern Jordan and the Judean mountains (Danin 1999). Danin (1999) regards P. atlantica, and most other mesophytic trees and shrubs found in the region, to be relicts of moister periods.
The conifer Picea mariana, is found beyond the latitudinal tree line in Canada where it survives by layering, with no sexual reproduction (Laberge et al. 2000). In this case survival is related to the reproductive plasticity of the species under the harsh conditions (Mejias et al. 2002), rather than micro-environmental factors, involving an increased allocation of resources to vegetative reproduction, rather than sexual reproduction (Laberge et al. 2000).
Chapter 1: Cryptic glacial refugia
Podocarpus, occur isolated in a deep sandstone gorge where the vegetation itself and sheltered aspect provide a cool and humid microclimate even during the dry season (Cranston 1998).
In Tasmania, Australia, isolated stands of cool temperate rainforest dominated by Nothofagus cunninghamii can be found in regions outside the predicted range of the species (Harle et al. 1993). An isolated stand at Yarlington Tier, southeastern Tasmania, occurs in a relatively dry region with the lowest rainfall known in the range of the species. A high groundwater table, protection from fire and frequent cloud cover are factors that allow the species to survive in a largely inhospitable area (Harle et al. 1993).
1.4. Conclusions
The available evidence suggests that during the last glaciation, and presumably other glacials, plant species were able to tolerate conditions by surviving in cryptic refugia, in many parts of the world.
Chapter 1: Cryptic glacial refugia
16
explanation (Ronce 2001). This has important implications, as the ability of species to migrate rapidly in response to climate change, has been considered important for the long-term maintenance of biomes in the face of future anthropogenic climate change (Clark et al. 1998; Nathan et al. 2002). For example, after molecular evidence suggested that two temperate North American trees may have survived further north near the icesheets than previously understood estimations of the migration rate were lowered from 1000m a year to <100m a year (McLachlan unpublished). This lower estimation of dispersal rate is more consistent with knowledge of life history and dispersal ability of the species (Ronce 2001).
In addition, cryptic refugia could explain lack of pollen evidence indicating the initial colonization by pioneer species (e.g pine and birch) followed by late successionary species such as oak, ash and beech suggested by north-European forest succession models (Willis 1996). Instead there appears to have been an immediate increase of diverse mixed deciduous woodland (Willis 1996).
Chapter 1: Cryptic glacial refugia
PART 2-
EXPERIMENTAL THESIS
Chloroplast DNA variation in
Nothofagus cunninghamii
(Hook.) Oerst.
James Worth B.Sc.
Submitted in partial requirement for the degree of
Bachelor of Science with Honours.
School of Plant Science
University of Tasmania
Chapter 2: Background
CHAPTER 2
Background
2.1 Introduction
The last 10 million years has seen marked changes in the world vegetation (Traverse 1982), due to a general cooling trend, increased seasonality, decreased rainfall and large, rapid climatic fluctuations at high and middle latitudes (Macphail et al. 1993). The vegetation of much of the temperate world, including southeastern Australia, has acquired much of its character during this period (Macphail et al. 1993). In particular, the temperate rainforest component of the Australian vegetation has suffered severe contraction in its range and a reduction in species diversity (Martin 1990; Carpenter et al. 1994). Vegetation with temperate rainforest affinities was far more widespread in
Australia during the Tertiary (Kemp 1978), the extent of which is well demonstrated by the discovery of fossils of the current Southern Hemisphere temperate rainforest genus Nothofagus in late Eocene (55-34 million years ago) sediments from southwestern Western Australia (Hill et al. 1996). Some time in the Pleistocene, temperate rainforest became confined to southeastern Australia and to some isolated areas of the east coast of Australia (Read and Brown 1996). As a result, temperate rainforest is now a relatively minor component of the Australian vegetation.
Chapter 2: Background
[image:26.612.122.470.95.578.2]19
Chapter 2: Background
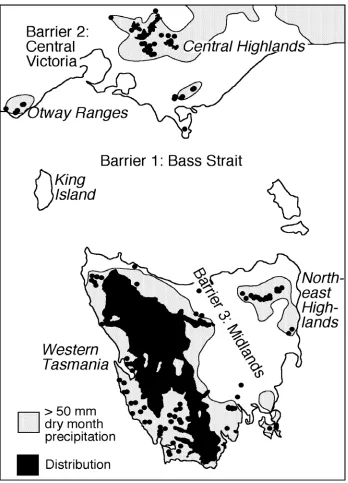
The species has a long history in Australia, with available fossil information suggesting that N. cunninghamii evolved from a clade of species in the subgenus Lophozonia that has been present in Australia for 55 million years, with the modern species recognizable in the fossil record for at least the last 1 million years (Jordan 1999). The current distribution of N. cunninghamii is no doubt the result of complex interactions of the species with both past and present environments, along with stochastic events (e.g. glacial survival). For example, Busby (1986) considered that the present absence of the species from the highlands of northeastern Victoria, despite suitable climatic conditions, is due to the severe effects of the last ice age and the species slow recovery due to poor dispersal. The ecological versatility of N.
cunninghamii (Hill et al. 1996) is considered to have been an important factor in its survival through the climatic changes of the last 10 million years, particularly the glacial-interglacial cycles (Read and Brown 1996). The tolerance of this species to a wide range of conditions is demonstrated by the species large altitudinal range. N. cunninghamii occurring from sea level to over 1500m (Howard and Ashton 1973), where it ranges from a 50m tall tree at low altitudes (e.g. Parsons et al. 1975) to a compact shrub under 50cm in height at the extremes of its altitudinal range (Reid and Brown 1996).
2.2 Explaining the current distribution of N. cunninghamii: glacial refugia,
migration or long distance dispersal?
Considering the severe climatic changes that have characterised the past 10 million years a number of important questions exist concerning the history of N. cunninghamii. One of the most significant of these is where the species survived over this period and the nature of its migration across the landscape. The low seed
Chapter 2: Background
21 within each major region of its distribution. However, during glacial periods many parts of the current range of N. cunninghamii would have been highly stressful places for rainforest species. Glacial climates, particularly in Tasmania, were severe relative to current interglacial conditions. For example, the climate during the Last Glacial, which is the best understood, is estimated to have had temperatures approximately 6ºC colder than present (Colhoun et al. 1996), and a likely 50% reduction in rainfall (Colhoun 2000). These conditions allowed the development of ice caps on upland areas of Tasmania and extensive periglacial conditions in both Tasmania and the southeast of mainland Australia (Davies 1974; McKenzie 1997).
The available fossil record is limited in its ability to tell us whether N.
cunninghamii survived in glacial refugia in each region that it now occupies. The species is known to have survived continuously for at least 350,000 years in western Tasmania (Colhoun and van der Geer 1998; Colhoun 2000) and is also known to have been present before the last glacial in the Central Highlands of Victoria, surviving through the Last Glacial Maximum (McKenzie 1997). While some fossil record exists for other regions of the species distribution, for example Wilsons Promontory and the Otway Ranges, these records extend only 5000 years and 7000 years before present, respectively (Hope 1974; McKenzie and Kershaw 1997). These records start 9000 and 7000 years after the end of the Last Glacial Maximum and are, therefore, uninformative as to glacial survival in these areas. Currently no fossil evidence of N. cunninghamii is available for eastern Tasmania.
Other explanations of the cause of the disjunctions that do not require the survival through the glacial cycles must be also be considered. Observations in the European and North American fossil record suggests that forest trees with large seeds and generally low seed dispersal abilities (e.g. oaks) were capable of rapid migrations in response to
Chapter 2: Background
conditions were widespread creating a nearly treeless environment (Macphail 1979; McKenzie 1997; Colhoun 2000). Rapid migration across current barriers during wetter periods (or with more even rainfall) could explain some of the large disjunctions or minor disjunctions within regions. Interchange between Victoria and Tasmania of N.
cunninghamii could have occurred in the past across the relatively shallow Bass Strait (mostly <100m deep), a land bridge that has been repeatedly exposed and submerged by changes in sea level since at least the Early Miocene (17 million years ago; Baillie 1989). A time lag between the amelioration of climate after glacial periods (end of Last Glacial 14000 years ago) and the closure of the land bridge across Bass Strait (6400 years ago; Belperio 2002) by the rise of sea level, could have allowed migration between Tasmania and Victoria by N. cunninghamii if the climate was suitably wet. This possibility is supported by macrofossils of the species on King Island thirty eight thousand years old (Hill et al. 1996). Macphail (1979) and McKenzie (1997) have observed periods of expansion of N. cunninghamii in the fossil record beyond present limits due to periods of wetter conditions in both Tasmania (8000 and 5000 years ago; Macphail 1979) and Victoria (7000-4000 years ago; McKenzie 1997), repectively. These periods, and similar periods before it, could explain some major or minor disjunctions within the species distribution. Evidence exists for the rapid postglacial migration of other Nothofagus species, for example New Zealand Nothofagus species (see McGlone 1985).
The third possible origin of disjunctions in the range of N. cunninghamii is via long distance dispersal of seed. There is a general insistence in the literature that Nothofagus is incapable of long distance seed dispersal (Hill et al. 1996). Indeed, this seems to be supported by the seed possessing only small wings and being heavier than normal wind dispersed seed (McGlone et al. 1996), and experimental data suggesting average dispersal is only one or two canopy heights away from the mother tree (Hickey et al. 1982). A number of lines of evidence suggest that the potential dispersal distance of Nothofagus seed could be greater. For example, stands of Nothofagus in New Zealand isolated up to 25km from the nearest populations are considered to have their origin via rare long distance dispersal of seed (Burrows 1977; Wardle 1980; Haase 1990).
Chapter 2: Background
23 appear in the New Zealand fossil record well after the severing of dry land routes
between Australia and New Zealand, approximately 25 million years ago for Lophozonia and forty-three million years ago for Brassospora (Macphail et al. 1996). These
subgenera appeared first in Australia before New Zealand (Hill et al. 1996). The unlikelihood that these subgenera were present in New Zealand earlier but did not contribute to the pollen record while doing so in Australia and South America has led to the suggestion that at some stage Nothofagus has crossed the 2000km Tasman Sea from Australia to New Zealand (Pole 1994; Macphail 1997). This assertion is supported by fossil evidence suggesting an origin via long distance seed dispersal for other New Zealand taxa (Mildenhall 1980). While the mechanisms underlying long distance transport in Nothofagus are not understood, McGlone et al. (1996) consider storm- force winds or perhaps seed stuck in birds plumage or feet could be possible vectors. Overall, the possibility that rare long distance seed dispersal has had a role in the distribution of Nothofagus species suggests that a similar role of long distance dispersal in the
distribution of N. cunninghamii is possible.
2.3 Chloroplast DNA
While the fossil record has been a major contributor to the understanding of the past history of plant species, phylogeography is increasingly becoming an important and independent source of information. Phylogeography is the study of the relationship between the phylogeny of current intra-and/ or interspecific genetic variation and its geographical distribution (Dumolin-Lapegue et al. 1997). The tool of choice in plant phylogeography is chloroplast DNA (Avise 1998). This is due to the maternal inheritance of the genome in most angiosperms and, therefore, the distribution of
Chapter 2: Background
structuring of variation (Ennos et al. 1999). This is due to cpDNA having half the effective population size of that found in the nuclear genome. Furthermore, because of the constant rate of evolution of the cpDNA genome, the depth of common ancestry of populations can be inferred by the their degree of genetic similarity (Schaal et al. 1998). The roles of fragmentation and migration (the species spatio-temporal dynamics) in a species past history may be inferred by examining the phylogeny of chloroplast DNA variation and overlaying this over a geographical framework (Ennos et al. 1999).
The distribution of cpDNA haplotypes has been used to infer the biogeographical history, especially the response to the ice ages, of numerous plant taxa on all continents. The glacial history of temperate European trees has received much research attention. Continental scale studies of cpDNA variation of the hornbeam (Carpinus betulus), olive (Olea europeae), hazel (Corylis avellana), common ivy (Hedera spp.), black alder (Alnus glutinosa) and common beech (Fagus sylvicata) (Demesure et al. 1996; Besnard et al 2002; Grivet and Petit 2002; Palme and Vendramin 2002; Grivet and Petit 2003) show strong structuring of cpDNA variation. This was used to infer the locations of refugia in southern European peninsulas and northern postglacial colonization routes. Other studies have found weak structuring of cpDNA variation (e.g. Raspe et al. 2000; Mohanty et al. 2001; Rendell and Ennos 2002) in species that are characterized by efficient seed
dispersal mechanisms (e.g. wind or animal dispersed) (Hampe et al. 2003). At a regional scale, examination of the distribution of cpDNA variation has provided strong evidence that some alpine plants (e.g. Eritrichium nanum) were able to survive the heavy
glaciation of the Alps separately on ice-free nunataks and in peripheral refugia (Stehlik 2001).
Chapter 2: Background
25 isolating pure chloroplast DNA followed by restriction digest (e.g. Bank and Birky 1985; Dally and Second 1989; Sahuquillo and Lumaret 1999). The requirement to isolate pure cpDNA, and not the use of restriction enzymes, severely limited the number of samples analysed. Restriction enzymes cleave (restrict) DNA at specific nucleotide sequences (recognition sites) and generate fragments of the original product. Variation in the nucleotide sequence between samples are detected by the differences in fragment size as a result of the creation or loss of restriction sites by mutation of single nucleotides (Parker et al. 1998) or through insertion or deletion mutations (indels) (Curtis and Clegg 1984). This size variation is known as “restriction fragment length polymorphism” (RFLP) (Parker et al. 1998). The invention of Southern hybridization (Southern 1975) brought about great improvement in the analysis of cpDNA. This technique allowed larger number of samples to be analysed but is still considered time consuming (e.g.
Chapter 2: Background
of DNA differentiation (Parker et al. 1998), although this technique is more time consuming than PCR-RFLP analysis.
Chloroplast DNA phylogeographic studies in southeastern Australia are so far limited to the genus Eucalyptus, the dominant of non-rainforest forest vegetation (e.g. Byrne et al. 1994; Jackson et al. 1999; Freeman et al. 2001; McKinnon et al. 2001). To date no study into the distribution of cpDNA variation has been completed in cool temperate rainforest plants in Australia. Currently, the only studies of cool temperate rainforest plants using molecular techniques consist of two rangewide isozyme studies of the Huon Pine (Lagarostrobus franklinii), a Tasmanian endemic, and Sassafras
(Atherosperma moschatum) (Shapcott 1993; Shapcott 1997) and an allozyme study investigating the clonality of the extremely restricted Lomatia tasmanica (Lynch et al. 1998). In addition, few genetic studies have been undertaken in the genus Nothofagus (e.g. Premoli 1997; Marchelli et al. 1998; Marchelli and Gallo 2001), despite the genus being "...the key to southern hemisphere biogeography" (van Steenis 1972).
Chapter 2: Background
Chapter 3: Materials and Methods
CHAPTER 3
Materials and Methods
3.1 Sampling Strategy
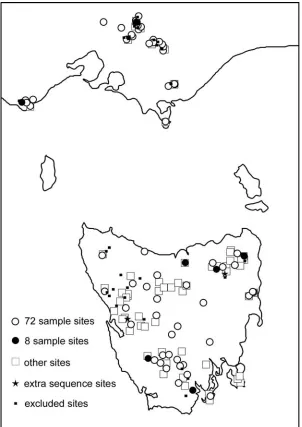
Leaf tissue was collected from 170 adult trees in natural stands from across the latitudinal and altitudinal range of Nothofagus cunninghamii (Appendix 1). This includes samples from all regions of the species distribution (Fig. 3.1). The sampling strategy aimed to sample as extensively in each region as possible, with an objective to sample each individual tree at least 10km from the nearest individual. Most known small isolated stands were also sampled. Multiple samples were collected with a minimum distance of approximately 50m between trees sampled at the Dazzler Ranges, Lookout Hill and Blue Tier, as these populations were considered as
potentially significant (e.g. putative glacial refugia, or remnant populations). Parts of the southwest, central and northwestern Tasmania were not sampled in this study due to inaccessibility.
Chapter 3: Materials and Methods
[image:36.612.183.485.70.497.2]29 Fig 3.1 The 170 sites sampled for N. cunninghamii across its range. Open circles represent samples that were used in the 72 sample screening; filled circles represent samples used in the
initial eight sample screening size; open squares represent other sites not used in the former
analyses; stars represent those samples sequenced for the SfM locus in addition to the sample
Chapter 3: Materials and Methods
3.2 Molecular Methods
3.2.1 DNA Extraction
Total genomic DNA was extracted following the CTAB protocol of Doyle and Doyle (1990), with the following modifications: using 1g of adult leaf tissue and 5ml of CTAB buffer with 4% polyvinylpyrrolidone and 35µl of 1M DTT and
incubating for 30 min at 55°C. All samples were cleaned by re-precipitation in the presence of high salt concentration (2.0M NaCl). DNA concentration and purity of all samples was assessed using agarose gel electrophoresis with ethidium bromide staining, comparing with a standard molecular weight marker (Lamda Hind III). DNA concentration of samples was standardized at 5ng per micro-litre.
3.2.2 Polymerase Chain Reaction
PCR was used to isolate different regions of the chloroplast genome. In order to maximize the number of cpDNA regions isolated in N. cunninghamii, an initial experimental phase was undertaken involving the testing of thirty-three universal chloroplast DNA primer pairs (described in Demesure et al. (1995); Dumolin- Lapegue et al. (1997); Sang et al. (1997); Grivet et al. (2001); Huang et al. (2002)) (Table 3.1).
Each cpDNA primer pair was initially tested using the annealing temperature described by Demesure et al. (1995), Dumolin- Lapegue et al. (1997), Sang et al. (1997), Grivet et al. (2001), Huang et al. (2002). The reaction mixture (25µl final volume) contained 2.5 mM MgCl2; 100µg/mL BSA (Bovine Serum Albumin); 80µM each of dATP, dCTP, dGTP and dTTP; 5 picomoles of each primer; 1 x PCR buffer
(67 mM Tris-HCI (pH 8.8), 16.6 mM (NH4)2 SO4, 0.5% Triton X-100 and 5µg of Gelatin);2 units of Taq polymerase (Promega; Madison, Wisconsin); and 10 ng of genomic DNA. PCR amplification was performed in a Corbett Research
Chapter 3: Materials and Methods
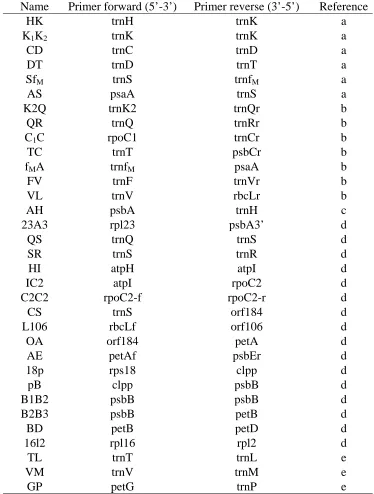
[image:38.612.149.523.93.587.2]31 Table 3.1 Forward and reverse primer pairs for the 33 primer pairs used in this study.
Name Primer forward (5’-3’) Primer reverse (3’-5’) Reference
HK trnH trnK a
K1K2 trnK trnK a
CD trnC trnD a
DT trnD trnT a
SfM trnS trnfM a
AS psaA trnS a
K2Q trnK2 trnQr b
QR trnQ trnRr b
C1C rpoC1 trnCr b
TC trnT psbCr b
fMA trnfM psaA b
FV trnF trnVr b
VL trnV rbcLr b
AH psbA trnH c
23A3 rpl23 psbA3’ d
QS trnQ trnS d
SR trnS trnR d
HI atpH atpI d
IC2 atpI rpoC2 d
C2C2 rpoC2-f rpoC2-r d
CS trnS orf184 d
L106 rbcLf orf106 d
OA orf184 petA d
AE petAf psbEr d
18p rps18 clpp d
pB clpp psbB d
B1B2 psbB psbB d
B2B3 psbB petB d
BD petB petD d
16l2 rpl16 rpl2 d
TL trnT trnL e
VM trnV trnM e
GP petG trnP e
Chapter 3: Materials and Methods
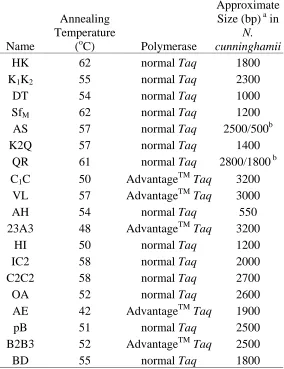
Table 3.2 Amplification conditions and the approximate size (bp) of the PCR product for each primer pair that successfully amplified N. cunninghamii cpDNA.
a
bp equals number of nucleotide bases pairs in PCR product
b
PCR amplification produced double banded products
A different thermocycle was used for the AH locus with an initial 5min at 94°C to denature DNA; 30 cycles of 60s at 94°C, 60s at 46°C, 1 min at 72°C and a final extension of 5 min at 72°C. The quality of PCR products was assessed by electrophoresis on agarose gels (1%) stained with ethidium bromide.
Primer pairs that did not produce a PCR product, or PCR products that were of poor quality (e.g. low yield or more than one PCR product), were further tested under a range of annealing temperatures. Each primer pair was tested, using the
Name
Annealing Temperature
(oC) Polymerase
Approximate Size (bp) a in
N. cunninghamii
HK 62 normal Taq 1800
K1K2 55 normal Taq 2300
DT 54 normal Taq 1000
SfM 62 normal Taq 1200
AS 57 normal Taq 2500/500b
K2Q 57 normal Taq 1400
QR 61 normal Taq 2800/1800 b
C1C 50 AdvantageTMTaq 3200
VL 57 AdvantageTMTaq 3000
AH 54 normal Taq 550
23A3 48 AdvantageTMTaq 3200
HI 50 normal Taq 1200
IC2 58 normal Taq 2000
C2C2 58 normal Taq 2700
OA 52 normal Taq 2600
AE 42 AdvantageTMTaq 1900
pB 51 normal Taq 2500
B2B3 52 AdvantageTMTaq 2500
Chapter 3: Materials and Methods
33 eight-sample size, at 12 different annealing temperatures in 2-4°C intervals above and below the given annealing temperature. Those primer pairs that subsequently
remained unsuccessful after manipulation of annealing temperature were tested using the BD Advantage™ 2 PCR Kit (BD Biosciences Clontech). This kit is particularly useful for the amplification of large DNA fragments. The PCR reaction mixture (20µl final volume) using BD Advantage™ 2 PCR Kit contained: 1 x BD
Advantage™ 2 PCR Buffer (40mM Tricine-KOH (pH 8.7), 15mM KOAc, 3.5mM Mg (OAc)2, 3.75µg/mL, 0.005% Tween 20, 0.005% Nonidet-P40); 26 µM each of dATP, dCTP, dGTP and dTTP; 0.5µlof BD Advantage™ 2 Polymerase Mix; 5 picomoles of each primer; and 10 ng of genomic DNA.
3.2.3 Detecting variation in the cpDNA of N. cunninghamii- PCR/RFLP
Eight individuals (Fig 3.1) were amplified with 16 cpDNA primer pairs. These eight samples were selected to be representative of the major disjunctions in the geographic range of N. cunninghamii and, because of marked altitude difference within species, incorporated both high and low altitude forms.
Fourteen PCR fragments (DT, SfM, K2Q, C1C, VL, 23A3, HI, IC2, C2C2, OA, AE, pB, B2B3, BD) were digested with eight restriction enzymes. Two fragments, HK and K1K2, were digested with 19 restriction enzymes. The specific recognition site and the specific reaction conditions for each enzyme (as
Chapter 3: Materials and Methods
restriction fragments was assessed by comparison with a 100bp molecular weight marker (Promega; Madison, Wisconsin).
Because of a lack of variation detected between the eight samples, seventy-two samples were amplified for five loci (C1C, IC2, C2C2, OA and pB). The 72 samples chosen included multiple samples from each major region of the distribution of N. cunninghamii, and samples from all small isolated populations sampled (Fig 3.1). The five PCR fragments were digested with two restriction enzymes TaqI and HinfI under the same conditions as described above.
Those fragment/enzyme combinations that produced variation between samples either using the eight or 72 sample screening size were screened for all 170 samples of N. cunninghamii to determine the geographic distribution of variants. Samples of N. moorei and N. menziesii were also screened with variable fragment/ enzyme combinations to provide information on the eventual status of restriction sites in N. cunninghamii.
3.2.4DNASequencing
The nucleotide sequence of the AH and SfM loci were determined by direct sequencing of the PCR products. The same eight samples as used above, and an additional two samples (sample number 35 from western Tasmania and sample number 12 from the northeast highlands of Tasmania) were used for the SfM locus (Fig. 3.1). PCR products were purified using a QIAGEN Quick PCR purification kit (QIAGEN Pty Ltd Vic, Australia). PCR products were sequenced in both forward and reverse directions. Sequence reactions were performed using the Beckman Coulter protocol as described in Poke et al. (2003). Products were sequenced on a Beckman Coulter CEQ 2000 automated sequencer. Sequence data was analysed using Sequencher software (Gene Codes Corporation MI, USA). Sequences were manually checked for incorrect base calls, heterozygous sites, polymorphisms, insertions/deletions (indels), and length variations (microsatellite like variation in numbers of a particular base occurring in a region between different samples).
Chapter 4: Results
35
CHAPTER 4
Results
4.1 Polymerase Chain Reaction
Nineteen primer pairs produced an amplification product in N. cunninghamii. Five loci were amplified using the BD Advantage™ 2 PCR Kit. A total of 34,850bp of single banded amplified product of the cpDNA genome of N. cunninghamii was isolated. Two primer pairs produced double-banded products under all conditions and were not used further. The approximate sizes of each primer pair product are described in Table 3.2. All loci were situated in the large single copy region, except 23A3, which amplified a region in the inverted repeat.
4.2 Restriction Digestions
The number of fragments visualized for each primer pair/ enzyme
Chapter 4: Results
Table 4.1 The number of fragments observed after digestion of 14 primer pairs with eight restriction enzymes of N. cunninghamii. The average number of fragments for each restriction enzyme is shown. No variation between samples was observed for these primer
pair/ enzyme combinations. – denotes missing data.
Restriction Enzyme Locus TaqI HinfI AluI DpnII HaeIII Hinp1I RsaI DdeI
DT 3 3 2 4 3 1 2 2
SfM 3 4 3 4 3 1 2 2
K2Q - 4 3 2 2 2 3 2
C1C 7 6 6 7 2 3 4 6
VL 7 6 6 4 3 - 2 4
23A3 3 8 5 5 3 3 4 4
HI 2 4 3 3 2 1 1 3
IC2 6 5 4 3 3 1 4 4
C2C2 5 6 3 4 4 3 7 6
OA 7 6 5 6 3 2 4 6
AE 4 4 1 2 3 3 3 2
pB 3 2 4 4 5 3 6 3
B2B3 4 5 6 - 4 1 4 2
BD 3 3 3 5 2 3 2 4
Chapter 4: Results
[image:44.612.244.397.192.516.2]37 Table 4.2 The number of fragments observed after digestion of the cpDNA fragments HK and K1K2 using 19 restriction enzymes across the eight samples of N. cunninghamii. One mutation was observed at the K1K2 locus using TaqI.
Locus Restriction Enzyme HK K1K2
TaqI 1 8
HinfI 2 2
AluI 6 1
DpnII 4 3
HaeIII 2 1
Hinp1I 2 1
RsaI 2 3
DdeI 2 1
MspI 2 3
HphI 1 1
NcoI 1 1
SspI 2 3
AseI 3 1
StyI 5 1
NciI 3 3
DraI 2 4
ClaI 1 2
BstUI 4 4
EcoRV 1 2
Three mutations were revealed in the survey of 72 samples after restriction digestion of the C2C2, IC2 and OA locus with TaqI. No variation was detected using the other loci/ enzyme combinations. The screening of all the N. cunninghamii
individuals (n=170), and samples of N. moorei and N. menziesii, was conducted using the variable locus/ enzyme combinations K1K2/ TaqI, IC2/ TaqI, OA/ TaqI and C2C2/
Chapter 4: Results
4.3 Genetic relationships and description of haplotypes
Overall four mutations were identified in N. cunninghamii using restriction digestion with the enzyme TaqI of the eight and seventy-two sample sizes. These mutations defined five haplotypes in N. cunninghamii. A further three mutations were identified between N. cunninghamii and N. menziesii. No mutational
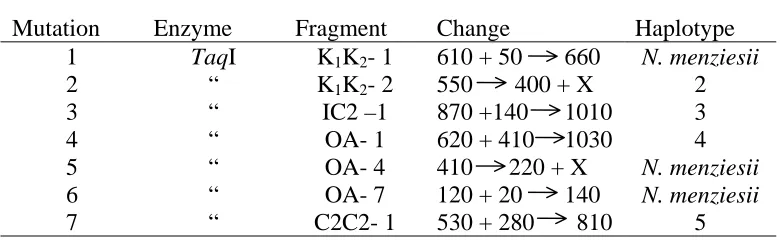
differences were found between N. moorei and haplotype 1 of N. cunninghamii. A simple haplotype network was constructed to represent the relationship between haplotypes (Fig. 4.5). Haplotype 1 occupies the central position in the network. All other haplotypes could be explained as being derived from it, and all differ from haplotype 1 by only one mutation. The mutational changes between haplotype 1 are described in Table 4.3. Mutation 1 occurs in N. menziesii at the K1K2 and is the result of the loss of a restriction site (Fig. 4.1). Mutation 2 occurs in N. cunninghamii at the K1K2 locus and is the result of either a 150bp deletion or the creation of a new
restriction site resulting in a 150bp fragment that could not be observed because it migrated with other fragments of similar size (Fig 4.1). Mutation 3 in N. cunnghamii is caused by the loss of a restriction site in the IC2 locus (see Fig 4.2). Mutation 4 at the OA locus in N. cunninghamii is the result of a mutation at a restriction site causing the failure of cutting by the restriction enzyme (Fig 4.3). Mutation 5 in N. menziesii at the OA locus is the result of a 170bp deletion or the creation of a restriction site (Fig 4.3). Mutation 6, also in N. menziesii at the same locus, is
probably the result of the loss of a restriction site, although the 20bp fragment cannot be visualized being too small (Fig 4.3). Mutation 7 occurs in N. cunninghamii at the C2C2 locus and is the result of the loss of a restriction site (Fig. 4.4).
Chapter 4: Results
[image:46.612.102.492.353.473.2]39 Table 4.3 Restriction fragment length changes in haplotypes 2 to 5 in N. cunninghamii and in N. menziesii, compared to the fragment size of haplotype 1 of N. cunninghamii and N. moorei.
Mutation Enzyme Fragment Change Haplotype
1 TaqI K1K2- 1 610 + 50 660 N. menziesii
2 “ K1K2- 2 550 400 + X 2
3 “ IC2 –1 870 +140 1010 3
4 “ OA- 1 620 + 410 1030 4
5 “ OA- 4 410 220 + X N. menziesii
6 “ OA- 7 120 + 20 140 N. menziesii
7 “ C2C2- 1 530 + 280 810 5
Arrows indicate the direction of change as inferred from condition in N. moorei and
Chapter 4: Results
Fig 4.1. Restriction fragments produced by the digestion of K1K2 PCR product with TaqI for N. moorei (lane 1), N. menziesii (defined by mutation one) (lane 2) and for N. cunninghamii
haplotype 1 (lane 3) and haplotype 2 (defined by mutation 2) (lane 4), after electrophoresis in
2% agarose gels. Lane M= Molecular weight marker (100bp ladder; Promega; Madison,
Chapter 4: Results
[image:48.612.110.419.260.523.2]41 Fig 4.2. Restriction fragments produced by the digestion of IC2 PCR product with TaqI for
N. moorei (lane 1), N. menziesii (lane 2) and for N. cunninghamii haplotype 1 (lane 3) and haplotype 3 (defined by mutation three) (lane 4), followed by electrophoresis in 2% agarose
gels. M= Molecular weight marker (100bp ladder; Promega; Madison, Wisconsin). The size
Chapter 4: Results
Fig 4.3. Restriction fragments produced by the digestion of OA PCR product with TaqI for
N. moorei (lane 1), N. menziesii (defined by mutation five and six) (lane 2) and for N. cunninghamii haplotype 1 (lane 3) and haplotype 4 (lane 4), after electrophoresis in 2% agarose gels. M= Molecular weight marker (100bp ladder; Promega; Madison, Wisconsin).
Chapter 4: Results
[image:50.612.117.426.261.527.2]43 Fig 4.4. Restriction fragments produced by the digestion of C2C2 PCR product with TaqI for
N. moorei (lane 1). N. menziesii (lane 2) and for N. cunninghamii haplotype 1 (lane 3) and haplotype 5 (defined by mutation seven) (lane 4), after electrophoresis in 2% agarose gels.
Lane M= Molecular weight marker (100bp ladder; Promega; Madison, Wisconsin). The size
Chapter 4: Results
2
3
1
4
5
m
K
1K
2Taq
I
IC2
Ta q
I
OA
Taq
I
C2C2
Taq
I
O A
Taq
I’
[image:51.612.110.531.126.540.2]K
1K
2Taq
I’
OA
Taq
I”
Fig 4.5 Network of the 5 haplotypes identified in N. cunninghamii. The area of the circles is proportional to the haplotype frequencies. Intersecting lines indicate a single mutational step
difference from the common haplotype, with loci enzyme combinations identifying mutation
Chapter 4: Results
45 4.4 Distribution of Haplotypes
Of the 170 individuals screened the haplotype of 36 samples could not be determined because of missing data at one or more of the polymorphic loci/ enzyme combinations (Appendix 1). Therefore the discussion of distribution of haplotypes refers only to those 134 samples with no missing data.
The distribution of the five haplotypes in N. cunninghamii shows strong geographic structure (Fig 4.6). Haplotype 1 is the most common (detected in 90 samples) and widespread across Tasmania and all regions of Victoria, except the Central Highlands (Fig. 4.6). Haplotype 2 (29 samples) is found in all samples from the Victorian Central Highlands and is present with Haplotype 1 in the Strezlecki Ranges. Haplotype 3 is found in nine samples from the northeast highlands of Tasmania, and in one individual from the Great Western Tiers. Haplotype 4 was detected in four samples in western and central Tasmania, and Haplotype 5 was found in only one individual from Lake St Clair. All three areas with multiple samples collected (Dazzler Ranges, Blue Tier and Lookout Hill) were fixed for the same haplotype. In addition, no association was found between haplotype and altitude of origin. For example, high altitude forms of N. cunninghamii on Mt Sprent and in the Sentinel Range possessed different haplotypes (haplotype 1 and haplotype 4,
Chapter 4: Results
Chapter 4: Results
47 4.5 DNA Sequencing
[image:54.612.168.460.388.580.2]A total of 441bp of the AH locus was successfully sequenced. No variation was detected between the 8 samples. 1200bp of the SfM locus was successfully sequenced. A mutation at a poly-T region (bp 442; Table 4.5) and a small indel (bp 780-781; Table 4.5) were identified. These two mutations defined three variants whose distribution is shown in Fig. 4.7. Variant A was shared between widespread samples in western Tasmania, northeastern Tasmania, and the Victorian Central Highlands and is most likely the ancestral form of these three variants. Three samples, two from northeastern Tasmania and one from the Dazzler Ranges shared variant B. Variant C was found in four samples from western, northwestern and southern Tasmania and the Otway Ranges (Fig. 4.7; Table 4.5).
Table 4.5 Summary of the DNA sequence variation observed between samples and their base position in the SfM locus. The PCR/RFLP haplotype of each individual is shown for
comparison.
Base Position
Variants 780, 781 442 Samples
PCR/RFLP Haplotype
A G A (T)10 24 1
“ “ “ 102 3
“ “ “ 12 2
B T C (T)10 9 1
“ “ “ 141 ?1
“ “ “ 154 1
C T C (T)11 35 1
“ “ “ 79 1
“ “ “ 166 ?1
Chapter 4: Results
[image:56.612.164.468.68.499.2]Chapter 5: Discussion
CHAPTER 5
Discussion
5.1 Low variation of chloroplast DNA
In total four mutations were detected in the chloroplast DNA (cpDNA) of N. cunninghamii. Three of the four mutations are likely the result of point mutations. This result is not consistent with Clegg et al. (1994) who consider that
insertion/deletion mutations account for much of the genetic variation detected using the PCR/RFLP method. The number of mutations detected in this study is low relative to some other studies (Table 5.1) considering the number of loci/enzyme combinations used (150). There are four main alternative explanations for this low observed diversity in N. cunninghamii.
The first alternative is that the PCR-RFLP technique used in this study failed to detect variation that exists in the genome of N. cunninghamii. While a large number of restriction enzymes were used in the eight-sample screening size in total only about 1% of the entire genome was analysed for variation. This certainly would have restricted the amount of variation detected. However, other studies have
Chapter 5: Discussion
50 low (Weising and Gardner 1999), but highly variable between species. At the
[image:58.612.64.569.276.486.2]extremes no variation has been reported for the alpine plant Erinus alpinus (Stehlik et al. 2002a), while cpDNA variation has been useful in infering the biogeographical history in other species (e.g Grivet and Petit 2003) (Table 5.1). Therefore the ability to make biogeographical interpretations from PCR-RFLP studies has varied widely between studies.
Table 5.1 Examples of the number of chloroplast DNA mutations detected by other studies using PCR/RFLP technique. N= the number of individuals used to screen for variation.
Species Distribution N
Loci/
enzyme Mutations Reference
Hazel Europe 248 17 4 Palme and Vendramin (2003)
N. nervosa S. Andes 22 25 3 Marchelli et al. (1998)
Hornbeam Europe 100 28 5 Grivet and Petit (2003)
Holly Europe 12 103 2 Rendall and Ennos (2003)
Erinus alpinus NW Alps 13 72 0 Stehlik et al. (2002)
Frangula alnus Europe 46 36 11 Hampe et al. (2003)
Castanea sativa Europe 181 99 6 Fineschi et al. (2000)
Eritrichium nanum Alps 148 117 17 Stehlik et al. (2002)
The second explanation is that the low number of mutations detected is due to the low mutation rate of the chloroplast genome in N. cunninghamii. The cpDNA mutation rate of plants is at least four times slower than that of the nuclear genome (Wolfe et al. 1987), and is considered to be even slower for long-lived forest trees (Dumolin-Lapegue et al. 1997), which would include N. cunninghamii.
The third possible explanation for the low variation observed in N.
Chapter 5: Discussion
maximum stem lifespan of between 450-500 years (Read 1999), and its vegetative capacity of regeneration (Howard 1973b). For example, if the bottleneck event occurred during the Last Glacial Maximum18000 years ago (Colhoun et al. 1996), considering an average lifespan of two centuries, N. cunninghamii would have had as few as 90 generations to recover variation. Lifespan is the relevant measure of generation time because the vast majority of reproductive effort in trees results in complete failure (Cannon and Manos 2003). However, the evidence for N. cunninghamii having passed through a single bottleneck in the past is not strong. Firstly, the fossil record suggests that the species survived in more than one region during the Last Glacial (McKenzie 1997; Colhoun 2000). In addition, the species was likely to be widespread in western Tasmania during the last glacial with temperature, not rainfall, being the strongest limiting factor (Colhoun 2000). McKenzie (1997) considered that pollen evidence for survival of N. cunninghamii through the last glacial in the Central Highlands of Victoria indicated the species survived temperatures that would not be expected based on current knowledge of the species temperature tolerance. Therefore, the species may have been more
widespread in western Tasmania than suggested by Colhoun (2000). The survival of N. cunninghamii in separate regions would work to increase diversity through genetic drift and isolation, therefore, catastrophic bottlenecks is unlikely to explain the low variation detected in the species.
Chapter 5: Discussion
52 5.2 Biogeographical inferences from the distribution of haplotypes in N.
cunninghamii
The possession of haplotype 1 by both N. cunninghamii and N. moorei, and N. menziesii differing by three mutations, suggests a closer relationship between N. cunninghamii and N. moorei than either species to N. menziesii. This relationship is supported by phylogenetic analysis of these species based on vegetative and
reproductive morphological data combined with molecular (chloroplast DNA and nuclear DNA data) (Jordan and Hill 1999). In this study outgroup analysis suggests that haplotype 1 is ancestral within N. cunninghamii. However, identification of the ancestral haplotype using simple outgroup methods (i.e N. moorei and N. menziesii) is not definitive. While haplotype 1 remains the most likely candidate due to its
presence in sister taxa N. moorei (Jordan and Hill 1999), it is possible that all the haplotypes found in N. cunninghamii haplotypes were transferred to both species via their common ancestor. In other words N. cunninghamii may not be monophyletic with regard to haplotype. However, two other lines of evidence supporting the inference that haplotype 1 is ancestral in N. cunninghamii can be invoked: 1) it is the internal haplotype within the haplotype network (Schaal et al. 1998), and 2) it is the most abundant and geographically widespread. Under this scenario N. menziesii haplotype may have been derived from the ancestral state haplotype 1.
Due to the ancestral status of haplotype 1 where it occurs with no other haplotypes such as the Otway Ranges, Wilsons Promontory, Douglas Apsley and large areas of the western half of Tasmania, it is not possible to make any
biogeographical inferences about its distribution. There are two possible opposing interpretations that can be made: 1) first that due to its internal position in the hapotype network, its distribution is the result of fragmentation (Schaal et al. 1998), for example between the Otway Ranges and western Tasmania or Wilsons
Promontory. Under this interpretation these populations could have remained in situ for a very long period of time, throughout the evolutionary history of N.
Chapter 5: Discussion
Tasmania the pollen evidence for N. cunninghamii supports this second interpretation, with evidence for postglacial recolonization during the last postglacial replacing areas formerly occupies by alpine vegetation and ice caps during the glacial period.
However, survival in glacial refugia cannot be ruled out within this region, while no interpretation can be made for the Otway Ranges, Wilsons Promomtory and Douglas Apsley where the fossil record is limited.
Stronger biogeographical interpretations can be made where the ancestral haplotype is found with derived haplotypes. In two major regions of the distribution of N. cunninghamii the ancestral haplotype occurs with derived haplotypes, that is haplotype 3 in the northeast highlands of Tasmania, which is almost confined to the region, and with haplotype 4 in western Tasmania, which appears to be endemic to this region. The presence of haplotype 3 in western Tasmania needs to be confirmed, because of this apparent geographic anomaly. In a study of the distribution of
cpDNA variation within the genus Lithocarpus in southeast Asia, Cannon and Manos (2003) found that the ancestral haplotype was widespread across its range, with a high level of endemism within each major region of its patchy distribution. This pattern was interpreted as each region having experienced little migration and extinction allowing both the accumulation of divergent haplotypes and the persistence of an ancient haplotype within each region (Cannon and Manos 2003). This interpretation was particularly strong with the identification of 76 DNA sequence haplotypes. In comparison, the diversity of derived haplotypes is very low in this study but a similar explanation whereby N. cunninghamii has remained for a long period in the northeast highlands and western Tasmania can be inferred. This interpretation is strengthened by the widespread distribution of each haplotype within each region. Haplotype 3 in the northeast highlands covers a geographic range of at least 50km, and haplotype 4 in western Tasmania covers a greater geographic range of almost 100km. The