T h e A u s t r a l i a n N a t i o n a l U n i v e r s i t y
Department of Engineering
Faculty of Engineering and Information Technology
Th e Au s tra l i an Na ti ona l U niv ers it y
EXPERIMENTAL STUDY OF
THE EFFECT OF WING ANGLE-OF-ATTACK AND STIFFNESS
ON LIFT AND THRUST
ON MODEL DRAGONFLY WINGS
Yutong Wang
A thesis submitted for the degree of
Master of Philosophy
Declaration
This thesis contains no material which has been accepted for the award of any other degree or diploma in any University or institute of higher learning. To the best of my knowledge, it contains no material preciously published or written by any other person, except where due reference is made in text.
Yutong Wang
This thesis would not have been completed without the support of many people. It is a great pleasure to express my gratitude to all those who have assisted and supported me in my research program. First and foremost, I would like to thank Associate Professor Rob Mahony, the Chair of my supervisory panel. Although I only have been with him for a short period, I have enjoyed his supervision, full support, and advice on many aspects of my research. Rob's comprehensive comments and good directions have been valuable in shaping my ideas and thoughts. I owe him much gratitude for having shown me how to conduct good quality research.
My sincere thanks go to other members of my panel, Dr. John Young and Mr. Rob Gresham. Dr Young’s wise supervision and sharp comments, guidance and support were all very useful in completing this thesis. His meaningful questions and advice helped me in clarifying my ideas. Mr Gresham’s support in building the experimental device is gratefully acknowledged.
I am also grateful to Mr. Ben Nash, workshop manager for his detailed advice and effort made in building and manufacturing the experimental device. I would also like to express my thanks to Mr Arif Ashraf for his help in our many lengthy discussions as well as his editorial assistance. My special thanks to Dr Tony Flynn. Without his effort and support in editing and proof-reading, this thesis would not have been formed in a professional way. I am very grateful to the Department of Engineering, ANU, headed by Professor Andres Cuevas. The Department’s generous financial and time support allowed the research program to be successfully completed.
Abstract
Recent studies in flapping-wing aerodynamics have touched the edge of unsteady aerodynamics where a flexible flapping wing and passive wing rotation are involved. The research in this area is still in infancy and the experimental data and results are extremely sparse.
The current research investigates the effects of spring stiffness correlating to angle-of-attack and wing stiffness on related aerodynamic parameters. The research was performed on a novel experimental device characterized as having a dragonfly-like wing rotating passively with asymmetrical up and down angle-of-attack.
Statement of Originality
iAcknowledgements
iiAbstract
iiiTable of Contents
ivTable of Figures
viiiList of Tables
xiTerms and Abbreviations
xiiPublications
xiii1 Introduction
12 Literature Review
62.1 Flapping Wing Aerodynamics 7
2.1.1 Scaling laws 9
2.1.1.1 Reynolds Number (Re) 9
2.1.1.2 Strouhal Number (Sr) 10
2.1.1.3 Reduced Frequency (k) 10
2.1.2 Unsteady aerodynamics and Unsteady Aerodynamic Mechanisms
11
2.1.2.1 Leading Edge Vortex 12
2.1.2.2 Rotational Force 14
2.1.2.3 Wake Capture 14
2.1.2.4 Clap-and-fling 14
2.1.3 Research Approaches 15
2.1.3.4 Physical Model Experiments 21
2.2 Angle-of-Attack 22
2.3 Wing Stiffness in Flapping Flight 25
2.4 Passiveness of Wing Rotation 26
2.5 Conclusion 28
3 Electro-Mechanical Experimental Device
303.1 Introduction 31
3.2 Requirements for the Experimental Device 34
3.2.1 Mechanical System Requirements 34
3.2.2 Electrical System Requirements 35
3.3 Mechanical System 35
3.3.1 Wing Flapping Motion Mechanism 36
3.3.2 Wing Passive Motion Mechanism 37
3.3.3 Support Structure 40
3.3.4 Removal of Mechanical Noise 41
3.4 Electrical System 42
3.4.1 Electrical Control Components 43
3.4.2 Force/Torque Data Acquisition Components 46
3.4.3 Rotation Angle Measurement 49
3.5 Force/Torque Data Conversion 51
3.6 Conclusion 54
4 Experiments and Results
564.1 Introduction 57
4.2 Fabrication of Flexible Wings 58
4.3 Reynolds Number 62
4.4 Experimental Platform 64
4.7 Results 79
4.8 Conclusion 80
5 Analyses and Discussion
815.1 Introduction 82
5.2 Analyses 83
5.2.1 Effects of the Factors on Resultant Force, FR 84 5.2.2 Effects of the Factors on Power Economy, PE 88 5.2.3 Effects of the Factors on Resultant Force Direction, β 92
5.2.4 Effects of the Factors on Power, P 95
5.2.5 Effects of the Factors on Lift, FX 97
5.2.6 Effects of the Factors on Thrust, FY 99
5.3 Discussion 101
5.4 Conclusion 111
6 Conclusion
114References
118Appendix A: Data Processing Program
123Appendix B: Force Evolution Graph
139Appendix C: Power Evolution Graph
167On CD
Data Processing Program (Matlab code)
Flapping Wing in Normal Motion (movie)
Table of Figures
Figure 3.1 Experimental device showing the wing membrane 32
Figure 3.2 Side view showing the wing near its dorsal reversal position 33
Figure 3.3 Schematic diagram of the experimental device 33
Figure 3.4 Schematics of four-bar mechanism 36
Figure 3.5 Physical four-bar mechanism 36
Figure 3.6 Illustration of the principle of the wing passive rotation
mechanism, viewed from wing tip to root. 38
Figure 3.7 Photo of the wing rotation control unit 38
Figure 3.8 Rotation angle and AOA viewed from wing tip to root. 39
Figure 3.9 Supporting Structure 40
Figure 3.10 Vibration absorption Linkage 41
Figure 3.11 Flange and grommet 42
Figure 3.12 Schematic diagram of the Electrical Control System 43
Figure 3.13 Motor-gearbox-encoder assembly 43
Figure 3.14 Servo amplifier 44
Figure 3.15 Power supply 45
Figure 3.16 High frequency chokes 45
Figure 3.17 Mechanical schematic diagram of the data acquisition system 46
Figure 3.18 Schematic diagram of the Force/Torque sensor acquisition
System 47
Figure 3.19 6-DOF Force/Torque sensor, on the device (Left), and before
installation (Right) 47
Figure 3.23 Conversion between the rotation angle and Hall sensor output
voltage 50
Figure 3.24 Sensor reference oxyz and ground reference OXYZ 51
Figure 3.25 Fapping angle θ 52
Figure 3.26 Rotating angle φ, viewed from wing tip to wing root 52
Figure 3.27 Flow chart of post-test data analysis program 54
Figure 4.1 Fabricated wing with the shape of dragonfly Aeschna’s hindwing 59
Figure 4.2 Wings spanwise stiffness 61
Figure 4.3 Wings chordwise stiffness. The distance is normalized to the
longest chord 62
Figure 4.4 Diagram of Experimental Set-up 64
Figure 4.5 Raw force data with membrane on the wing, 12 flapping cycles
for run 6 67
Figure 4.6 Raw force data without membrane on the wing, 12 flapping
cycles for run 6.
68
Figure 4.7 Rotation angle of Run 6 measured in Hall-effect sensor. 68
Figure 4.8 Rotation-angle conversion chart. 69
Figure 5.1 Main effects plot for resultant force, FR 85
Figure 5.2 Interaction plot for resultant force, FR 85
Figure 5.3 Main effects plot for power economy, PE 89
Figure 5.4 Interaction plot for power economy, PE 89
Figure 5.5 Main effects plot for resultant force direction β 93
Figure 5.6 Interaction plot for resultant force direction β 93
Figure 5.7 Main effects plot for power, P 95
Figure 5.8 Interaction plot for power, P 95
Figure 5.12 Interaction plot for thrust, FY 100
Figure 5.13 Image from flow visualization experiment 103
Figure 5.14 A series of pictures of one flapping cycle. Gounp 111 105
Figure 5.15 A series of pictures of one flapping cycle. Gounp 221 106
Figure 5.16 A series of pictures of one flapping cycle. Gounp 331 107
Figure 5.17 Force generated from group 111 108
Figure 5.18 Force generated from group 221 109
Table 4.1 Mass properties of five flexible wings 60
Terms and Abbreviations
6-DOF Six degree of Freedom
Adj MS adjusted mean squares
Adj SS adjusted sum of squares
ANOVA Analysis of Variance
AOA Angle-of-Attack
CFD Computational Fluid Dynamics
DARPA Defense Advanced Research Projects Agency
DF Degrees of freedom
EI Flexural stiffness
F F-value
factor A Down stroke spring stiffness
factor B Up stroke spring stiffness
factor C Wing chordwise flexural stiffness
FR Resultant force magnitude
FX Veritical force
FY Horizontal force
GUI Graphical User Interface
k Reduced Frequency
LEV Leading Edge Vortex
MAVs Micro-Air-Vehicles
NACA0012 A wing profile
P Power
PE Power Economy
PVC Polyvinyl Chloride
RANS Reynolds-Averaged Navier-Stokes
Re Reynolds number
Publications
Accepted Conference Papers
39th AIAA Fluid Dynamic Conference & Exhibit (2009)*
Title: Effects of Flapping Wing Angle of Attack on Lift and Thrust
27th AIAA Applied Aerodynamics Conference (2009)*
Title: Effects of Flapping Wing Stiffness on Lift and Thrust
Australian Conference on Robotics and Automation (2008)
Title: Design and Fabrication of Dragonfly Test Bed for Aerodynamic Characterization
Chapter
1
______________________________________________________________________Introduction
In 1996, the Defense Advanced Research Projects Agency (DARPA, a US based agency) initiated a program of developing Micro-Air-Vehicles (MAVs). In this program, an MAV was defined as a flying device with no dimension greater than 6 inches and the overall weight less than 100 grams (McMichael and Francis 1997). An important application for MAVs is reconnaissance for military purposes, including deploying MAVs inside confined space structures such as buildings and tunnels. Since then, research to develop MAVs which meet the above mentioned requirements has intensified and spread globally.
external means such as the use of motors. The effect of wing flexibility of a passively rotated dragonfly-like wing on propulsive performance has never been explored. Further, the effect of the variation of the stiffness on the force generation of the same wing needed to be explored.
The research conducted here uses springs to passively control the angle-of-attack of the wing during the flapping cycle. It is the main aim of the current research to study the effects aforementioned on lift and thrust when the wing flaps actively but is rotated passively around the pitch axis. Specifically, the objectives of this study are:
To investigate if there exists the optimal spring tension or wing stiffness in producing maximum aerodynamic force.
To investigate the effects of the spring tension or wing stiffness on power economy.
The design of MAVs can be improved significantly if the above relationships are successfully determined. The current study was restricted to one particular flapping configuration,that is the hovering mode. The Reynolds number (Re) based on the average chord length was around 16000, which is within the range associated with MAVs flight (Re < 105).
of different stiffness of the spring which allows wing rotation and wing stiffness were obtained in the post-test analysis. The full factorial experiment was run with three factors (two spring stiffness and one wing stiffness) and each had three levels.
Chapter
2
______________________________________________________________________Literature Review
______________________________________________________________________
2.1. Flapping Wing Aerodynamics 2.1.1 Scaling laws
2.1.1.1. Reynolds Number (Re) 2.1.1.2. Strouhal Number (Sr) 2.1.1.3. Reduced Frequency (k) 2.1.2 Unsteady Aerodynamic Mechanisms
2.1.2.1. Leading Edge Vortex (LEV) 2.1.2.2. Rotational Force
2.1.2.3. Wake Capture 2.1.2.4. Clap-and -fling 2.1.3 Research Approaches
2.1.3.1. Theoretical Analysis 2.1.3.2. Biological Experiments
2.1.3.3. Computational Fluid Dynamics (CFD) 2.1.3.4. Physical Model Experiments
2.2. Angle-of-Attack 2.3 Wing Stiffness
In this Chapter, the overall study of flapping wing aerodynamics is considered first, followed by a review of research done in studying the effect of AOA and wing stiffness, particularly on lift, thrust and power efficiency. Finally, passiveness of wing rotation (pitch) is covered at the end of the Chapter. A broader review of flapping wing flight at low Reynolds numbers can be found in papers (Jensen 1956; Maxworthy 1981; Wakeling 1993; Rozhdestvensky 2003; Sun and Lan 2004; Sane 2003; Wang 2005; Ansari 2006; Platzer 2008) and books (Pringle 1957; Norberg 1975a; Lighthill 1987; Dudley 1999; Azuma 2006; Shyy 2008).
2.1 Flapping Wing Aerodynamics
The corresponding Reynolds number for MAVs is in the range of less than 105 (Shyy 2008). The application of this type of aircraft includes environment surveillance, military reconnaissance, traffic management and real–estate survey. MAVs are required to be able to work inside confined spaces such as buildings, caves, tunnels and wells. Therefore, MAVs could be characterized as having small size, slow speed, low noise and high maneuverability.
addition, the Reynolds number of MAVs is in the same magnitude as smaller birds or larger insects. Thus, the idea of mimicking nature has encouraged researchers to put effort into studying the flapping wing aerodynamics of biological flyers in the hope of gaining inspiration from nature. Insects in particular have received more attention than birds and bats for their smaller size, hovering and all-direction flight capability (Dudley 1999), notably high lift in some species (Ellington 1999), and simpler wing structures (no articulations).
The study of insect flight has revealed that insect flapping flight is far more complicated than the existing fixed-wing aeroplane flight. The unsteady aerodynamics for a flapping wing is still in its developing stage. For a fixed wing, lift can be calculated by the simple formula
L =
2 1
CLρAv2,
where L is lift , CL the lift coefficient, ρ air density, A wing area, and v wing velocity. However, for a flapping wing, lift is influenced by a large number of factors, including kinematic parameters: flapping frequency, forward speed, flapping amplitude, stroke plane direction, instantaneous angle-of-attack, as well as wing-property parameters: wing size, wing shape, wing surface structure, wing stiffness, wing inertia and many others. Therefore, although flapping wing propulsion aircraft has a promising future for MAV design, understanding the associated aerodynamic mechanism needs to be developed significantly.
2.1.1 Scaling laws
Scaling laws have proved helpful in MAVs flight studies, especially in mechanical and computational modeling. They help to set up the models, identify flow patterns and predict lift and thrust. In MAVs flight, the Reynolds number, Strouhal number and reduced frequency are the three key dimensionless parameters. By applying these parameters certain aerodynamic similarities could be maintained. For a rigid flapping wing, it would be sufficient to define aerodynamic similarities within the above three parameters in addition to geometric and kinematic similarities (Shyy 2008).
2.1.1.1. Reynolds Number
The Reynolds number describes the ratio of the inertial force to the viscous force. In general, the Reynolds number is defined as
/
ReUCm ,
Where, U is wing velocity, Cm object characteristic length, ν kinematic viscosity. In flapping flight, U is taken differently according to the flight mode. In forward flight, U
is the wing’s forward speed, Cm the mean chord length, but in hovering flight, U is wing flapping velocity. In the current research, U represents the wing tip mean velocity. So, if Ф is the amplitude of flapping angle measured from peak upstroke position to peak downstroke position, then
/ 2 ffRCm
U ,
2.1.1.2. Strouhal Number
The Strouhal number is used for forward flight, representing inertial force expressed as the ratio of two initial forces, i.e., that of the unsteadiness of the flow to the inertial force due to the change in velocity in the flow field. It provides an estimate of unsteadiness in the flow. The Strouhal number is defined as
Sr = ffH/U,
where, ff is flapping frequency, H is wing tip excursion measured as the vertical distance traveled by the wing tip during flapping stroke, and U is forward velocity. The Strouhal numbers in natural flyers are found within a narrow range 0.2 < Sr < 0.4 (Taylor and Thomas, 2003). In hovering flight, if U is represented by the wing-tip mean velocity, then
Sr = ff H/ U = ff H/2Ф ff R Cm/ ν = ν H/2ФR Cm,
which is the figure only related to the wing flapping amplitude and wing shape. In other words, Sr will be the same so long as the wing flapping amplitude and the wing are kept the same.
2.1.1.3 Reduced Frequency (k)
This parameter also characterizes the unsteady aerodynamics of the wing. It is defined as
k=ω Cm /U,
defined as before. Similar to Sr, it can be explained that k could be the same as long as wing rotation amplitude and wing shape are kept the same.
2.1.2. Unsteady Aerodynamic Mechanisms
Despite the complexities and unsteady aerodynamic effects in insect flight, the flow around the wing can still be modeled by the unsteady Navier-Stokes equations. Ellington has showed his proof of this unsteadiness by “proof-of-contradiction” (Ellington 1984a; Ellington 1984b) and at the same time denied the quasi-steady theory which was used for explaining the lift generation by Weis-Fogh (1973) and Jensen (1956).
Using unsteady aerodynamic mechanisms, insects enhance the forces generated by their wings. To date, four types of unsteady aerodynamic mechanism have been identified, namely leading edge vortex (LEV), rotational force, wake capture and clap-and-fling. These are reviewed briefly as follows.
2.1.2.1 Leading Edge Vortex
That high lift is the result of the existence of leading-edge-vortex (LEV) has been convincingly argued by Ellington et al., (1996), although that LEV could benefit lift was noticed earlier (Maxworthy 1979, Dickinson and Gotz 1993).
LEV is a flow phenomenon associated with wing flapping. When the wing moves with high AOA, the flow is separated into two parts, those above and below the wing. The flow above the wing forms a vortex near the leading edge of the wing. This vortex creates a low pressure region above the wing, which causes the high lift commonly found in insect flight.
size of LEV increased gradually from wing root to wing tip and attached to the wing for up to 75% of the wing length and was temporally experienced for almost half the stroke. The LEV shed out eventually at the end of the stroke. The leading edge vortex was also observed by Dickinson et al. (1999) on their mechanical model Robofly.
Ellington (1996) suggested that the stability of LEV is enhanced by its spiral flow along the wing span, because it prevents the LEV being shed from the wing where the spiral span-wise flow of the LEV transfers the momentum radially. As a result, it reduces the momentum accumulation in the chord, which keeps the LEV smaller and bound more tightly and longer on the wing. Therefore the spanwise spiral flow serves as a stable means of maintaining the LEV on the wing. In further research on Flapper, Usherwood and Ellington (2002) also concluded that axial flow is the key factor for LEV remaining attached. In contrast to the downstroke, however, during the upstroke the Flapper produced much less aerodynamic forces and no LEV was observed on the wing. Apart from being noticed on mechanical models (Ellington, 1996; Dickinson et al. 1999), the LEV was observed directly from insects (Willmott et al. 1997a; Willmott et al. 1997b; Willmott et al. 1997c), with these observations leading to the belief that LEV is the predominant mechanism used in insects to produce high lift. Further confirmation came from another research line. By using CFD, Liu and Kawachi (1998) and Liu (1998) showed that their flow simulation results are consistent with those observed found on the Flapper.
2.1.2.2 Rotational Force
mechanical model, “Robofly”, occurring near the end of a stroke when the wing underwent a rapid rotation. The rotational force appeared as a peak force recorded in the lift time history near each stroke end, where lift coefficient, CL, could be as high as 1.74
in some cases. The CFD results obtained by Ramamurti and Sandberg (2002) and Sun and Tang (2002) were consistent with the discovery reported by Dickinson, et al.(1999).
2.1.2.3 Wake Capture
The unsteady mechanism of wake capture was extensively studied by Dickinson et al (1999). Wake capture is a wing-wake interaction, occurring at the beginning of the stroke when the wing meets the wake from the previous stroke. They found that by using a wake capture mechanism the transient lift coefficient CL could be up to 4 in
some cases. Numerical studies (Wang 2004; Tang et al., 2007) on elliptic airfoils showed the existence of wake capture as well. The effect of different flight parameters on the lift in wake capture was further studied by Sane and Dickinson (2001).
2.1.2.4 Clap-and-fling
produce additional thrust for the insect. During the fling phase, a low pressure region generated between the wings accounts for the high lift of the insect.
Clap-and-fling may not only explain high lift for the wasp, but may also apply to other insects with a clap flight mechanism, including Drosophila (Gotz 1987), butterflies (Brodsky 1994), and locusts (Cooter and Baker, 1977).
Lighthill (1973) has modeled and theoretically analyzed the clap-and-fling mechanism, whereas Maxworthy (1979) and Spedding (1986) have studied it by experiments. Other studies of clap-and-fling can be found in the literature (Ellington 1984; Ennos 1989; and Lehmann et al 2005).
2.1.3 Research Approaches
In order to discover the principles underlying unsteady flapping flight, four research approaches are often used, these are theoretical analysis, biological study, CFD simulation, and physical model study. Theoretical analysis attempts to derive the analytic expression for lift and other aerodynamic forces. The biological studies seek the truth directly from the natural flapping flyers. CFD simulation solves Navier-Stokes/Euler equations to find aerodynamic forces, while the physical-model study extracts aerodynamic information from mechanical models which preserve some flight characteristics.
An incompressible, unsteady flow pattern is governed by Navier-Stokes equations (Kundu 1990). In differential form, it can be expressed as
ρ(Du/Dt)=-p+ ρg+μ2u,
where u is particle velocity, μ viscosity, g gravity acceleration constant, ρ density of fluid, p pressure, del operator.
Under no-slip conditions and no-penetration conditions, Wu (1981) derived a 2D analytic expression from Navier-Stokes equations to calculated the lift for an airfoil.
F=- ρdγ/dt +ρ
dt d
SdA, where γ=
RrdR,Where F is lift generated by unit span, ρ density of fluid, γ first moment of vorticity, r
distance form the origin, R area of region of interest, A cross-sectional area of the airfoil. The above lift F includes the vorticity around the airfoil. However, it has no practical use in insect flight. First, an insect vortex spirals radially outwards, hence is 3D. The above force expression did not take this into account during derivation. Second, the flow in the vicinity of the wing must be known and this adds more difficulty to its use. Finally, the lift F, was basically derived from the translating airfoil, not from a flapping wing.
Minotti (2002) derived an analytic expression of lift for a flapping wing in complex form.
Fx-iFy=i
dzdz dw 2
2
i
*
wdz t
where w(z)= Ux(t)+iUy(t), ρ density of air, and * symbol for complex conjugate. This equation has its own limitations as it was derived from the Euler equation which implies that the fluid was considered as inviscid. The wing is regarded as a rigid plate and the vortex is in a sense 2D, which ignores the flow along the wing span. Only the LEV was considered during the derivation, while the other unsteady mechanisms such as rotational force, wake capture, and clap-and-fling were not considered. Although not including all the unsteady phenomena, the above formula is the most advanced analytical formula seen in the literature addressing unsteady aerodynamics in insect flight.
2.1.3.2. Biological Experiments
Biological experiments perform the studies of insect flight directly on insects’ wings through observing morphology, measuring kinematics and analyzing aerodynamics. This provides an ideal approach, because all the data obtained are true and direct without any modifications and thus reflect the true flight behavior of an insect.
2006). It was found that dragonfly flight is characterized by a nearly vertical stroke plane, independent control of each wing, hindwing leading forewing in hovering, and a different angle of attack during up and down stroke (Somps and Luttges 1985).
Studies in dragonfly aerodynamics have revealed that a dragonfly can generate extremely high lift. Somps and Luttges (1985) found the transient lift could be as high as 15~20 times body weight, while average lift was measured as 2~3 times body weight. Under quasi-steady theory, estimation of the lift coefficient, CL, in dragonflies reached 2
(Weis-Fogh 1973) and 6.1 (Norberg 1975). Although quasi-steady theory overestimated CL at between 2.3 and 6.1, numerical studies showed that CL values remained at 2
(Gustavson 1991, Wang 2000, Sun and Lan 2004, Young et al. 2008). That leading edge vortex (LEV) is the cause of high lift in insects was argued by Ellington (1984a) and the existence of the LEV was demonstrated on the Flapper, a physical hawkmoth model (Ellington 1999). LEV on tethered dragonflies were observed by Savage et al (1979) and Somps and Luttges (1985). Other than LEV, the hindwing capturing the wakes shed from the forewing may also be responsible for the high lift (Maybury et al 2004). In addition to unsteady flow, the properties of the wing that may also contribute to high lift in dragonflies include wing flexibility (Combes and Daniel 2001; Combes and Daniel 2003) and wing roughness (Okamoto et al 1996).
wings show exceptional steady-state aerodynamic properties in comparison with the wings of other insects. This viewpoint was shared by Kesel (2000). Wootton (1992) pointed out that the wing rotation in Odonata may be passive, which agreed with the findings by Ennos (1988b) and Newman and Wootton (1986). Azuma (1988) showed the twisting of the dragonfly wing must be adaptive.
2.1.3.3. Computational Fluid Dynamics (CFD)
With the development of solvers for Navier-Stockes equations, computational fluid dynamics (CFD) has become a powerful tool in MAV studies. It allows researchers to investigate flow details around the wing, find the relationship between flow fields and the aerodynamic forces generated by the wing, as well as to optimize the MAV’s design and improve its flight performance. Although CFD is a promising tool, CFD model establishment and its validation often requires detailed experimental kinematic data and long computing time. Despite the difficulties, much progress has been made in this area of study.
Liu et al (1998a; 1998b) applied Reynolds-Averaged Navier-Stokes (RANS) code to hawkmoth wing motion and found that they could match 2D force results, but were unable to match 3D force results because of lack of experimental 3D force data. They also confirm the existence of the LEV flow pattern which was found both on real hawk moth wings and an aerodynamically scaled-up model Flapper by Ellington et al (1996). Ramamurti and Sandberg (2002; 2007) used a finite element solver to study Drosophila
matched Dickinson’s Robofly results only moderately. Lian and Shyy (2006) studied membrane aerodynamics by CFD and concluded that a membrane wing and rigid wing exhibit similar aerodynamic performance but the former has a much larger stall margin. This conclusion is supported by the experiments of Waszak et al. (2002) and Galvao et al. (2006). Young and Lai (2007) showed that a plunging-pitching airfoil having a peak propulsive efficiency with a Strouhal number of 0.05~0.15, is consistent with experimental results of Anderson et al. (1998) and those in nature (Taylor and Thomas 2003). As a simulation tool, CFD also provides intuitive flow visualization. The vortices structures shed from the wing profile NACA0012 (Lai and Platzer 1998), near a flapping dragonfly wing (Wang 2000), around a pitch-up airfoil (Birch and Dickinson 2003), and during clap-and-fling (Lehmann et al. 2005) are among the remarkable results of flow visualization. In another example, the roles of vortices in a hawkmoth wing were clearly demonstrated by flow visualization and computed results (Aono and Liu 2006).
2.1.3.4. Physical Model Experiments
Despite biological experiments providing the most reliable insect flight kinematics and aerodynamics data, biologists often face challenges in obtaining detailed or systematic information about the kinematics of a wing, even with modern measuring technology. Dynamic scaled-up mechanical wings have provided another platform for insect-flight study, which in some sense could overcome the difficulties encountered when studying insects directly. Some research results from model wing studies have offered insights into unsteady insect aerodynamics. The discovery of the LEV mentioned previously is one example (Ellington 1996). In another example, Dickinson (1993) confirmed the existence of LEV at low Re (<10000) by studying his dynamic scaled model, Robofly. Experiments on Robofly were carried out in a mineral oil tank (Lauder 2001). Using Robofly, Dickinson (1994) also discovered that rotational force during stroke reversal may provide an important source of aerodynamic force in insect flight, and both rotational force and wake capture are the unsteady mechanisms for high lift in insect wings.
by Weis-Fogh (1973) was mimicked by Robofly (Lehmann 2004; Lehmann and Sane 2005) who showed that it could enhance lift by 17%. They also noted that the angle separation of the two wings should be no more than 10o~12o. Double LEV was observed when carrying out experiments on a model flapping wing (Lu et al. 2006) with the aid of Digital Partical Image Velocimetry ( DPIV).
Progress in mechanical model studies has demonstrated the unique advantage of employing models. Aerodynamical phenomena could be enlarged and wing motion operated in a controllable manner during experiments while preserving the flow patterns. In fact, much useful information has been extracted through the use of model studies.
2.2 Angle of Attack (AOA)
Angle of Attack plays an important flight controlling role in all types of flyers from fixed-wing airplanes to complicated flapping-wing insects existing in nature. This section reviews some AOA properties found in research into MAVs.
successfully built by Ifju et al (2002). Other studies of the membrane wing can be found in Nielsen (1963), Sugimoto and Sato (1988), Shyy (1997), and Galvao et al (2006).
The angle of attack in an insect wing during flapping is rather complicated compared with a fixed rigid wing. Insects vary the angle of attack during the stroke, Neivel (1960). “Methodologically, the wing angle of attack has proven to be difficult to quantify for arbitrary free motion.” (Dudley 1999). AOA twists along the wing span with the greatest value at the wing base when the wing flaps across the middle portion of the flapping stroke (Ellington 1984c). The twisted wing performs at its aerodynamic optimum, since the angle of attack of each section of the wing is adapted to the flow around at its best angular position.
Higher angle of attack characterizes the hovering flapping flight in nature. Experimental study of this phenomenon (Dickinson and Gotz 1993) in a sucrose tank with fixed AOA leads for the observation of the leading edge vortex (LEV) attached to a rigid 5x15mm rectangular wing for at least two chord lengths when AOA was set between 13.5° and 54°. The leading edge vortex is suggested as the cause of 80% lift increase when compared to that measured five chord lengths later.
The effect of angle of attack on lift was studied by Lai et al (2005) on a vertically flapping mechanical wing in a wind tunnel. The wing was made by bonding PVC film on a carbon fiber frame. In the range of 0 to 15°, AOA was fixed to a certain value for both up and down stroke for each individual test. Their results showed that lift increased with increase of AOA to between 0 to 15°, when flapping frequency was approximately 4Hz.
Very recently, Singh and Chopra (2008) studied the aerodynamics of seven horizontally hovering flapping model wings with passive pitching motion. In the hovering mode, pitch angle is a complementary angle of the angle of attack. Because of their symmetrical design of the pitching mechanism, the pitching motion in the up stroke is the same as that in the downstroke. From the test results of their third wing, with a 100mm span and 48mm chord length, made of an aluminum frame and Mylar membrane, it was found that the wing with a 45° pitch angle generated higher thrust than was the case for the 30° pitch angle. In addition, the power required was also found to be reduced.
between flapping-wing aerodynamics and AOA is measured on a case-by-case basis, and data in this field is still very limited. A similar situation exists in relation to the affect of wing stiffness on aerodynamics and flight efficiency.
2.3 Wing Stiffness
Wings in all natural flying animals exhibit flexible property (Swartz 1992, 1997. Tian et al 2006). Combes and Daniel (2001, 2003) studied flexural stiffness distribution and scaling rules in insect wings on 16 species from 6 orders, and determined that flexural stiffness in a single wing was distributed in such a way that it decreases exponentially either from wing base to tip or leading to tailing edge. It was also found that, between species, spanwise flexural stiffness was proportional to the cube of the wing span, whereas the chordwise flexural stiffness was proportional to the square of the chord length. The advantage with flexible wings is that the wing is enabled to adapt to its flow environment, which could lead to delayed flow separation in fixed membrane wings (Shyy and Berg 1999; Waszsk et al., 2002).
The benefit of a flexible wing in control was found by Raney and Solminske (2004) who reported a that flexible wing can speed up transition between wing-beating modes.
flexible wing, whereas lift produced in the three wings was similar. This result was confirmed by Torres and Mueller (2004), Lian and Shyy (2003) and Galvao (2006).
Heathcote (2004) suggested that optimal wing stiffness exists to produce maximum propulsion after experiments in a water tank at zero-stream velocity, in which he tested three plunging rectangular wings where each had a different thickness. These rectangular plates with different thicknesses served as wings with different flexibilities. He also found that flexible wings improve power efficiency. By numerical analysis, Pederzani (2006) also showed that chordwise flexibility increases propulsive efficiency in a heaving motion. Heathcote (2008) advanced his experiments with spanwise flexible rectangular wings using the same experimental equipment at non-zero fluid-flow speeds and found results similar to those before, that modest flexibility is beneficial to thrust and power efficiency. He noted that this was observed when the Strouhal number was within the range 0.2~0.4. By simulation, Chimakurthi’s (2008) computational results matched Heathcote’s (2008) experimental results.
2.4 Passiveness of Wing Rotation
by wing base sclerites while others (Norberg 1972; Ennos 1988; Wang 2005; and Bergou et al., 2007) believe that it is passive. It is not difficult to assume it to be active, because insects are living creatures. But it is less obvious why it could be passive.
Norberg (1972) demonstrated that the mass centre of the wing in some dragonfly species is posterior to the rotation axis. At the end of each stroke, the inertia caused by the deceleration of the wing makes the wing rotate; hence the wing rotation is passive.
From the viewpoint of the power requirement for wing rotation at end reversal, Bergou et al (2007) also proved that there is no need for the wing base to supply power to rotate the wing in the dragonfly, fruit fly and hawkmoth. Their method proposes that the power needed in a wing muscle should be that power needed to overcome the wing inertia in rotation minus the power generated by associated aerodynamics. In the case of the dragonfly, the authors used the kinematics measured by Russell and Wang (2004). Aerodynamic force was obtained by solving 2D Navier-Stokes equations described by Xu and Wang (2006a), where their results show that the power required from the wing muscle is negative. Its direct interpretation is that the aerodynamic force is injecting power into the wing, where, in fact, it signifies the passivity of the wing’s rotation. Similar results were found for fruitfly and hawkmoth.
2.5 Conclusion
This feature is crucial to an apparatus used in the air when payload, agility and power consumption are of paramount importance.
In a passive wing rotation system, how AOAs different in up and down strokes and how the wing stiffness of a dragonfly-like wing affects lift, thrust and power efficiency has been found to be largely unexplored in the published literature. This was the motivation for this research.
Chapter
3
______________________________________________________________________
Electro-Mechanical
Experimental Device
______________________________________________________________________
3.1 Introduction
3.2 Requirements for the Experimental Device 3.3 Mechanical System
3.3.1 Wing Flapping Motion Mechanism 3.3.2 Wing Passive Motion Mechanism 3.3.3 Support Structure
3.3.4 Noise Removal 3.4 Electrical System
3.4.1 Electrical Control Components
3.4.2 Force/Torque Data Acquisition Components 3.4.3 Rotation Angle Measurement
3.1 Introduction
Physical experiments have been a valuable means in studying of flapping unsteady aerodynamics. The discovery of the unsteady aerodynamic mechanism ‘rotational force’ (Dickinson and Gotz 1994) and the ‘leading edge vortex’ (Ellington 1996) are the two prominent examples. In other researches, experimental devices have been used in finding the optimal angle-of-attack (Sane and Dickinson 2001) and dual leading-edge-vortices (Lu et al., 2006), in verifying the ‘clap-and-fling’ mechanism (Lehmann 2004), and in providing flow visualization (Ellington 1996; van den Berg 1997; Willmott and Ellington, 1997). The effect of phase relation between two wings on lift was explored on a physical model as well (Mayburry and Lehmann 2004).
The above researches were concentrated on rigid wings. Recently, Heathcote (2004, 2008) explored the effect of wing flexibility on thrust of wings in plunging motion in a water tank. More recently, Singh (2008) studied a passively flapping wing in normal hovering (horizontal wing stroke plane). Despite these studies, research into the flexible wing is still in its infancy and many new aspects remain to be explored.
The experimental device is constructed with two major systems: a mechanical and an electrical system. The mechanical system includes the structure supporting the entire device as well as the functional mechanism to convert the motor rotation motion to the wing flapping motion. In addition, the wing is rotated passively during flapping, with the degree of rotation independently controlled by two springs in up and down stroke. The electrical system controls the flapping frequency via a servo amplifier and a personal computer and collects the force and torque data from a six degree of freedom (6-DOF) sensor placed at the base of the wing. The rotation angle of the wing base is measured via a Hall-effect sensor located at the end of the wing rotation shaft.
Two pictures of the finished test bench viewed from rear-side and from the side are shown in Figure 3.1 and 3.2. The schematic of the test bench is illustrated in Figure 3.3. The video footage of the wing in flapping is stored in the CD attached.
Figure 3.2 Side view showing the wing near its dorsal reversal position
Figure 3.3 Schematic diagram of the experimental device
This chapter covers the requirements placed upon the device, followed by the detailed mechanical and electrical design description and components selection. The
Motor Wing
Table 6-DOF F/T Sensor
Sensor Interface
Angle Sensor
force/torque data conversion from sensor coordinates on the wing to the ground coordinates is covered last.
3.2 Requirements for the Experimental Device
To achieve the objectives of the experimental program for the thesis, the test bench is mechanically required to provide two motions for the wing: an active flapping motion with a passive rotating motion. In addition, it should be possible to vary certain kinematical parameters of the flapping, such as flapping frequency, flapping amplitude, and angle-of-attack in either up- or down-stroke. The electrical system should offer the necessary control and power for the mechanical system so that it can flap at an accurate flapping frequency with sufficient torque. The data acquisition system should complete two tasks: one is to measure the force and torque generated by the wing and the other is to measure the rotation angle at the wing base. Apart from the objectives mentioned above, the test bench should be able to work with a wing of any shape.
To achieve the expected design aims for the experiment device as a whole, individual systems which make up the device should meet their own functional requirements separately. For clarity, these requirements are listed in detail as follows:
3.2.1. Mechanical System Requirements
1) Provide solid structure support for the test bench. 2) Produce required wing motions, which are,
Passive rotation motion while flapping 3) Contain adjustable flight parameters, which are,
Flapping amplitude: 0~60 deg, that covers the range found in most dragonflies.
Angle of attack: 10~90 deg, that covers the range in dragonflies as well.
Wing neutral flapping position, i.e. the azimuth of the wing rotation axis when the flapping angle is zero.
4) Minimizing mechanical noise in the 6-DOF force/torque sensor 5) Minimizing the inertia force contained in the force/torque data
3.2.2. Electrical System Requirements
1) Provide sufficient power to drive the experimental device (max 250w) 2) Control the flapping speed precisely (+/-0.02Hz)
3) Collect required force and torque data 4) Collect required wing rotational angle data 5) Record, process and convert the collected data
3.3 Mechanical System
3.3.1 Wing Flapping Motion Mechanism
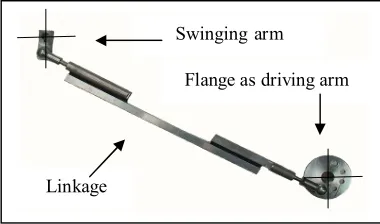
The wing flapping motion is realized by employing a four-bar mechanical mechanism that converts the rotational motion of the driving arm to the swinging arm via a linkage, as illustrated in Figure 3.4. Mechanically, the wing base, the whole moving portion between the swinging arm and the connector into which the wing is inserted, is coupled with the swinging arm. Therefore the motion of the wing root is same as the oscillating motion of the swinging arm. Furthermore, since the wing is fixed on the wing base, the wing’s flapping motion is identical to the motion of the swinging arm. The physical four-bar mechanical mechanism is shown in Figure 3.5 in which the flange connected to the output shaft of the motor acts as the driving arm. The linkage between the driving arm and swinging arm is formed with three sections and the purpose of this design is to reduce the noise and will be discussed in Section 3.3.4.
Figure 3.4 Schematics of four-bar mechanism
Figure 3.5 Physical four-bar mechanism
Linkage
Driving arm Swinging arm
Flange as driving arm
Linkage
[image:50.612.243.433.579.691.2]There are two adjustable parameters in this four-bar mechanism. One is the length of the driving arm, and the other is the length of the linkage. Changing the driving arm length corresponds to changing the flapping amplitude of the wing. Changing the linkage length corresponds to changing the azimuth of the flapping wing when in its flapping neutral position. The length change of the driving arm is realized by placing the nearer linkage connector to the different holes that have different distances to the centre of the flange. The length change of the linkage is realized by turning the linkage, since the threads at two ends were designed being in opposite directions. Given a rotating driving signal at the input link, follower link will undergo a sinusoidal angular displacement. Experimental results obtained for the azimuth set to zero and flapping amplitude set to 52º, showed angle trajectories closely resembled a sinusoidal wave with R-squared value 0.9928.
3.3.2 Wing Passive Motion Mechanism
While flapping, the wing rotates passively in the current experimental device. The wing rotation axis flaps in the stroke plane (see Figure 3.6). Because the force Ftotal
representing all the external forces on the wing is not acting on the rotation axis, a torque about the rotation axis is produced, which makes the wing rotate. Since this torque is not actively produced but caused by the wing flapping motion, the wing rotation is passive.
end is fixed on the lever which rotates with the wing and the other end is tied with a soft string.
Figure 3.6 Illustration of the principle of the wing passive rotation mechanism, viewed from wing
tip to root.
Figure 3.7 Photo of the wing rotation control unit
Wing Chord
Inertia Weight
Air
Total F F F
F
Flapping Motion Stroke Plane
Rotation Axis Spring-1
Spring-2
Rotation Control Unit Lever
Neutral Rotation Position
Soft String
Soft String
Spring 2 Lever
Another end of the string is fixed on the case of the Rotation Control Unit. This design allows only one spring to work after the wing passes its neutral position. During the up-stroke, the external force pushes the wing downwards. The wing tends to rotate clockwise from its neutral position as shown in Figure 3.6; spring-2 works against this rotation by pulling the lever, while spring-1 is in its idle state. In contrast, spring-1 works and spring-2 idles when the wing rotates anti-clockwise from its neutral position.
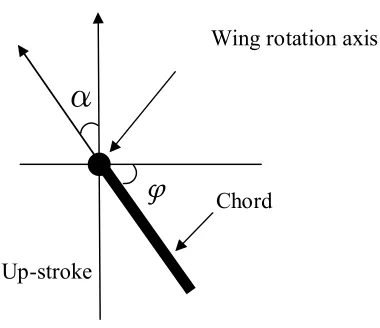
In flapping flight, the Angle-of-Attack (AOA) describes the position relationship between the wing orientation and the wing motion. For a wing in hover, the geometrical AOA is defined as the angle formed by wing chord pointing from the trailing edge to leading edge and the direction of the flapping motion. In the context of the current thesis, the AOA is referred to this geometrical AOA. As illustrated in Figure 3.8. In the up-stroke if the rotation angle is φ, then AOA α is complementary tothe rotation angle φ.
Figure 3.8 Rotation angle and AOA viewed from wing tip to root.
Therefore changing the rotation angle is equivalent to changing the AOA. As Wing rotation axis
Chord
Up-stroke
α
[image:53.612.257.447.460.624.2]mentioned before, two springs work against the wing rotation. Hence, the controlling of AOA can be achieved by controlling the stiffness of the springs. In the down-stroke, the complementary relation between αandφ still holds.
3.3.3 Support Structure
Figure 3.9 Supporting Structure
A robust metal table was built to provide a solid foundation for the experiments in order to prevent interference from an unstable base (see Figure 3.9). On top of the table there are two unconnected portions: one for supporting the motor and the other for supporting the wing. Each portion has a base made of a timber plate on top of 100mm thick foam. The gap between the two portions and the two foams serve to prevent vibration being transmitted from the motor to the force/torque sensor mounted on the wing. The details of noise attenuation are given in next Section. The motor holders and the support frame
Robust Metal table Thick foam
Support for flapping parts
for flapping parts were bolted onto the timbers respectively. Glue was used to bind the foam with the timber and the metal table.
3.3.4 Removal of Mechanical Noise
[image:55.612.128.538.601.676.2]After the device was assembled, significant mechanical noise was detected by the sensitive 6-DOF force and torque sensor mounted at the end of the wing. Noise was found to be generated from the motor-gearbox assembly when bolted onto a regular table. To reduce the noise, a very robust table was built using bulky steel bars and the noise path from motor-gearbox to sensor was cut off by using two big pieces of 100mm thick foam placed under the wing supporting structure and the motor-gearbox assembly. This management cut off the noise path from gearbox to sensor via the table.
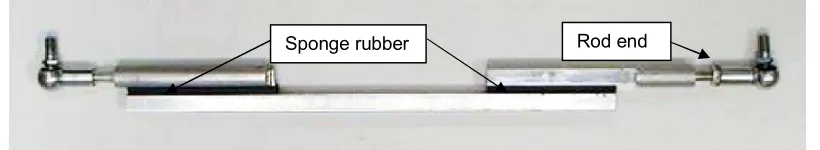
Noise was also transmitted from the gearbox to the sensor via the four-bar linkage mechanism. To cut off this second path, the middle portion of the linkage was removed and replaced with a longer rod which overlapped the remaining two end portions of the linkage. Sponge rubbers were placed between the overlapped parts portions. Cyanoacrylate glue was found strong enough in bonding the rubber and metal. The finished linkage is shown in Figure 3.10.
Figure 3.10 Vibration absorption Linkage
In addition to this arrangement, a rubber grommet was inserted into the connection hole on the flange mounted on the output shaft of the gearbox. This arrangement provided a soft connection between the flange and linkage end rod as shown in Figure 3.11. As a result, noise transmitted in the linkage path was eliminated effectively.
Figure 3.11 Flange and grommet
After the two paths for noise transmitting were blocked, force/torque data became quite clean (see Figure 4.5 and Figure 4.6).
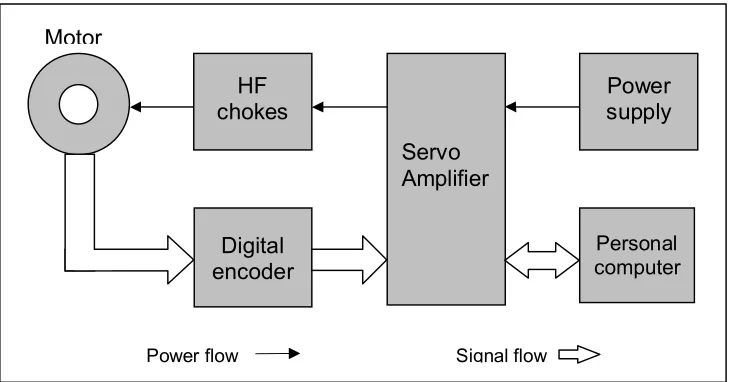
3.4 Electrical System
Figure 3.12. The data acquisition part of the electrical system has components of 6-DOF force/torque sensor, sensor interface and, acquisition card and rotation angle measuring unit. The major work carried out on the electrical system was to select the adequate components and integrate them into the desired system.
Figure 3.12 Schematic diagram of the Electrical Control System
3.4.1 Electrical Control Components
(1) Motor-Gearbox-Encoder
Figure 3.13 Motor-gearbox-encoder assembly
Personal computer
Servo Amplifier Motor
HF chokes
Digital encoder
Power supply
Power flow Signal flow
[image:57.612.158.523.208.399.2]A Maxon EC 45 250 watt brushless motor was chosen to drive the system, as shown in Figure 3.13. The motor has a maximum speed of 11000rpm with a nominal operating voltage of 48v. The motor draws continuous current of 8.2 A at a speed of 5000 rpm. This motor provides a reliable driving source.
The gearbox selected was a Maxon planetary gearbox GP 42C, with an output torque of 3~15Nm and a reduction ratio of 26:1. The gearbox transmits power effectively with the only disadvantage being the mechanical noise generated. Extra insulation effort had to be spent to remove the noise (See Section 3.3.4).
A Maxon digital encoder HP HEDS 6540 was employed to detect the rotor’s position and rotation direction for precise motor speed and position control.
(2) Servo Amplifier
A servo amplifier 4-Q-EC DEC 70/10 was used for the electrical driving system, Figure 3.14. It has the advantage of providing digital speed control as well as digital torque control. The control can be operated in both accelerating and braking directions.
(3) Power Supply and High Frequency Chokes
The power supply shown in Figure 3.15 used in the current test bench is a Parameters P4303, a dual-tracking DC power supply, which takes AC from the mains and transforms it to DC. Combining two channels in series, it provides a variable voltage between 0 and 60V and the total current output could reach 6A.
Figure 3.15 Power supply Figure 3.16 High frequency chokes
High frequency chokes (Figure 3.16) were used between the motor and the servo amplifier to reduce the high frequency noise. Without using the high frequency chokes, an audible sharp electrical noise was generated by the motor. The high pitch noise was caused by the digitized motor supply power. By connecting 3 high frequency chokes between the 3 power cables to the motor and the servo amplifier the noise was eliminated and the motor worked in a quiet condition.
(4) Motor Control Program
3.4.2 Force/Torque Acquisition Components
Data acquisition part is responsible to collect the desired data during the process of experiments. In the present experimental study, there are two types of data to be collected. One is the force and torque data from the 6-DOF force/torque sensor and the other is the wing rotational angle value measured by a Hall-effect sensor. The force/torque sensor records the force and torque at the wing base during flapping. The Hall-effect sensor measures the time history of the wing root rotation that occurs during flapping. Figure 3.17 shows the mechanical schematic diagram of the data acquisition system.
Figure 3.17 Mechanical schematic diagram of the data acquisition system.
(1) The 6-DOF Force/Torque Sensor
The electrical schematic diagram of force/torque acquisition is illustrated in Figure 3.18. Wing
Wing base
Hall-effect Sensor
Magnet Force/Torque
Sensor Rotation axis
The force/torque acquisition part consists of 3 major parts: 6-DOF F/T sensor, sensor interface and the data acquisition card.
Figure 3.18 Schematic diagram of the Force/Torque sensor acquisition System
A 6-DOF Force/Torque Sensor, Nano 43 from ATI Pty Ltd was selected and mounted at the wing base (see Figure 3.19).
Figure 3.19 6-DOF Force/Torque sensor, on the device (Left), and before installation (Right)
The 6-DOF sensor collects the force fx, fy, fz and torque mx, my, mz in xyz three directions with respect to the reference frame on the sensor. This reference frame is
Personal computer Sensor
Interface
Data acquisition card
Power flow Signal flow
defined as follows. The origin is at the centre of the one end of the cylindrical sensor. That end is facing the wing when the sensor is installed on the device. The z-axis corresponds to the sensor’s cylindrical axis pointing outwards from the wing root to tip, and it is also co-axial with the wing rotation axis. When the wing surface is horizontally placed, the x direction is pointing vertically upwards. The y direction can be found by the right hand rule.
(2) Sensor Interface
Figure 3.20 Sensor Interface
The sensor interface power supply box as shown in Figure 3.19, designed for small sensors like the Nano 43 also from ATI, provides the working power for the sensor as well as the electronics for cleaning the loading analogue signal collected from the same sensor before passing it onto the data acquisition card installed in the computer.
(3) Data Acquisition Card
the current device is an M series NI PCI-6221, a fast yet low cost data acquisition card from National Instrument.
Figure 3.21 Data acquisition card, NI-PCI 6221
3.4.3 Rotation Angle Measurement
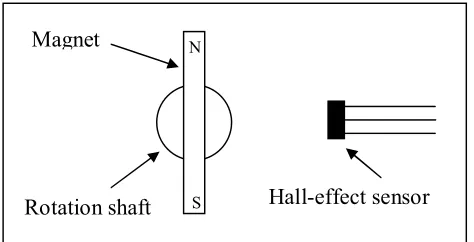
Rotation angle measurement was achieved using a Hall-effect sensor configration. This sensor had the advantage of low cost, light weight and zero mechanical friction. The principle of the current rotation angle measuring device with hall sensor can be described with the aid of Figure 3.22.
[image:63.612.219.456.505.626.2]Viewed from wing root to tip as shown in Figure 3.22, the middle of a magentic bar is
Figure 3.22 Hall-effect sensor and magnet for rotation angle measurement
N Magnet
mounted onto the end of wing rotation shaft, the Hall sensor is placed at about 10mm off the rotation axis. When the wing is in its neutral positon, as shown in Figure 3.22, there is no magnetic field strength detected by the Hall-effect sensor. Its output voltage is about 2.63v.
When the wing rotates clockwise, N-pole moves closer to the Hall sensor and the output voltage of the sensor is increased above 2.63v. In contrast, negative magnetic strength is detected and the output voltage of the sensor is decreased from 2.63v when the wing rotates count-clockwise from its neutral position. The larger the degree the wing rotates, and the stronger the strength the sensor detected, in either direction. The rotation angle +/-90 degree corresponds to the Hall-effect sensor output voltage 0~5v, conversion between the rotation angle and Hall sensor output voltage is shown in Figure 3.23.
Figure 3.23 Conversion between the rotation angle and Hall sensor output voltage.
Rotation Angle Conversion
-2 -1.5 -1 -0.5 0 0.5 1 1.5 2
1.53 1.63 1.82 2.03 2.23 2.38 2.48 2.53 2.59 2.63 2.68 2.74 2.81 2.90 3.02 3.2
2
3
.46
3.65 3.7
5
Measured Voltage V (v)
3.5 Force/Torque Data Conversion
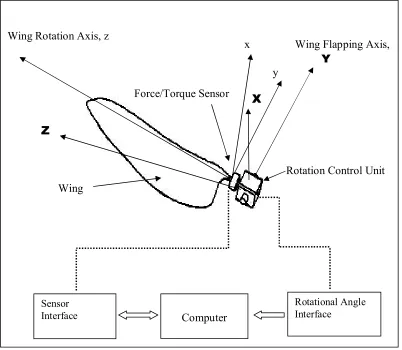
The data collected from the 6-DOF sensor are with respect to the sensor reference. Because the sensor is mounted on the wing root, it flaps and rotates with the motion of the wing root. To gain the aerodynamic force with respect to the ground, the data collected from the sensor must be converted to the ground reference frame. This conversion was carried out in the post-test data process program written in Matlab.
The sensor and ground reference coordinates are illustrated in the Figure 3.24. Sensor Wing Rotation Axis, z
Wing Flapping Axis,
Y
Force/Torque Sensor
Rotation Control Unit
Computer
Sensor Interface
Rotational Angle Interface
y x
X
Wing
reference was determined when the sensor was manufactured with the origin at the centre of the one end of the sensor and z axis is coaxial to the axis of sensor cylinder and x axis was marked on the sensor. When installed in the current experiment device, it was arranged such that the z axis was coaxial to the wing rotation axis pointing from wing root to tip, and x axis pointing vertically upwards when the wing was at horizontal position. Ground reference is defined such that X axis has the positive direction upwards and Y axis has the positive direction same as the sensor y axis in its neutral flapping position. As a result, the positive direction of the Z axis is same as the sensor z axis when the wing is in a horizontal position.
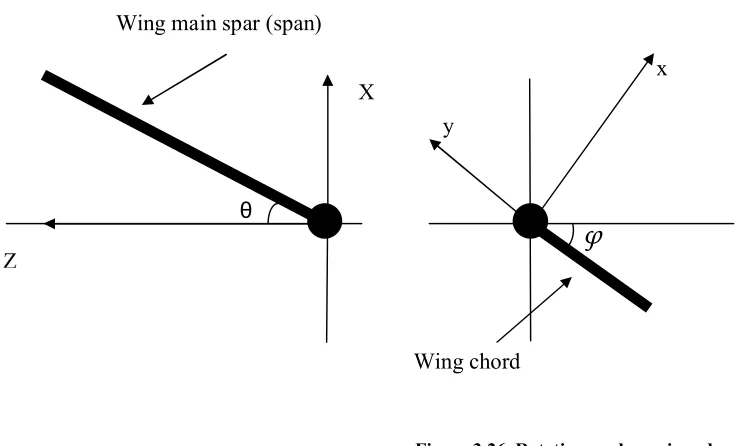
The side views of the wing in Figure 3.25 and 3.26 illustrate the flapping and rotation angle θ and φ respectively, which are the only two angles involved in the conversion.
θ
φ
Wing main spar (span)Wing chord X
Z
[image:66.612.135.509.445.668.2]x y
Figure 3.26. Rotating angle φ, viewed from wing tip to wing root.
The flapping angle θ is measured between main spar and its horizontal position and it is positive when the wing flaps upwards. The rotation angle φ is defined as zero when the surface of wing is parallel to the horizontal plane and is positive when the wing rotates clockwise, viewed from wing tip to root.
Having defined two references and two angles, the conversion matrix from sensor reference to ground reference was found as:
= cos cos sin sin cos 0 cos sin sin cos sin cos cos
Hence, F * f ,where F
Fx Fy Fz
1 and f
fx fy fz
1F is the force in ground reference, and f is the force in sensor reference.
To remove the inertial force the wing generated, experiments were conducted under two situations: wing with membrane and wing without membrane. Two sets of test data were collected. The AOA was detected by a Hall-effect sensor and displayed and recorded in oscilloscope Agilent 54624A; data for force and torque was recorded through ATI software in LabView.
were converted to the ground reference frame.
Figure 3.27 Flow chart of post-test data analysis program
The Matlab program is attached in the Appendix A. It is noticed that the sensor reference and ground reference have different origins. This does not affect the force conversion, but will change the results of torque conversion slightly. However, the calculation with real experimental data has shown that the differences in results are negligible. Therefore, the conversion matrix is also valid for torque.
3.6 Conclusion
An electro-mechanical test bench using passively rotating wing concept with angle-of-attack controllable at the end of wing rotation shaft was successfully designed. The mechanical, electrical and data acquisition system all function as expected. The mechanical vibration noise problem generated in the gearbox was completely solved by blocking the noise transmitting paths. The 27 slow wing motions movies depicting the
Force/Torque with membrane
Rotation angle with membrane
Rotation angle no membrane
Force/Torque no membrane
Force/Torque In Ground Reference
Converting Matrix Converting Matrix Phase
averaging
Phase averaging
Phase averaging
Phase averaging
Flapping angle
function ∑