This is a repository copy of
High speed imaging techniques for the analysis of
close-coupled gas atomisation
.
White Rose Research Online URL for this paper:
http://eprints.whiterose.ac.uk/83577/
Version: Accepted Version
Proceedings Paper:
Mullis, AM, McCarthy, IN and Cochrane, RF (2010) High speed imaging techniques for the
analysis of close-coupled gas atomisation. In: Proceedings of the World Powder
Metallurgy Congress and Exhibition, World PM 2010. World PM2010 Congress &
Exhibition, 10-14 Oct 2010, Florence, Italy. European Powder Metallurgy Association
(EPMA) . ISBN 9781899072194
[email protected] https://eprints.whiterose.ac.uk/ Reuse
Unless indicated otherwise, fulltext items are protected by copyright with all rights reserved. The copyright exception in section 29 of the Copyright, Designs and Patents Act 1988 allows the making of a single copy solely for the purpose of non-commercial research or private study within the limits of fair dealing. The publisher or other rights-holder may allow further reproduction and re-use of this version - refer to the White Rose Research Online record for this item. Where records identify the publisher as the copyright holder, users can verify any specific terms of use on the publisher’s website.
Takedown
If you consider content in White Rose Research Online to be in breach of UK law, please notify us by
High Speed Imaging Techniques for the Analysis of Close-Coupled Gas
Atomisation
A.M. Mullis, I.N. McCarthy & R.F. Cochrane
Institute for Materials Research, University of Leeds, Leeds LS2-9JT, UK
Abstract
We describe two complimentary, high speed imaging techniques for studying close-coupled gas atomisation. In the first technique a high frame rate (18,000 fps) video camera is used to film a continuous sequence of images, whilst in the second a pulsed Nd:YAG laser is used to obtain pairs of still images with an effective 6 ns exposure time. By combining these techniques we are able to demonstrate directly that the melt spray cone consists of a jet precessing around the surface of a cone. Further, we demonstrate that the width of this jet is directly related to the geometry of the melt nozzle. By applying Particle Image Velocimetry techniques we are also able to map the flow field in both the primary and secondary atomisation zones, demonstrating an asymmetric recirculation eddy exists at the circumferential edge of the gas-melt interface in the primary atomisation zone.
Introduction
Close-coupled gas atomisation (CCGA) is an important production technique for fine, spherical metal powders. Such powders have a variety of uses, such as in pigments, catalysts, fuel for solid-fuel rocket engines, metal injection moulding (MIM) and solder pastes for ‘flip-chip’ type circuit board fabrication. In principle, CCGA is straightforward: high pressure gas jets impinging upon a molten metal stream are used to disrupt the stream, breaking it up into a series of fine droplets. However, in practice the complex interaction between the high velocity gas jets and the metal results in a turbulent, and often chaotic, flow with the result that the details of the process are far from well understood. Consequently, early work into gas atomisation focused on empirical correlations between median particle size and process parameters[1, 2, 3] such as gas pressure, gas flow rate and melt flow rate. The most widely quoted of these empirical relationships is that due Lubanska[2], which correlates particle size with (1+G)1/2, where G is the gas:metal mass ratio.
Many notable advances in atomiser design have been brought about in recent years, though, through the careful, scientific study of the atomisation process and these have allowed significant reductions in median particle size and increases in process efficiency[4, 5, 6, 7]. Despite this, a significant problem with CCGA remains the wide distribution of particle sizes produced. This contrasts with many end-users specification for a tightly constrained distribution. This necessitates significant sieving and filtering to obtain the in-specification product, reducing the yield of the process. Remelting of the remaining product can add substantially to the cost and energy usage of the overall process[8].
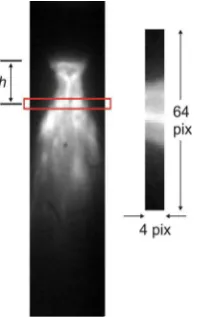
In two recent papers[12, 13] we have reported the results of a series of experiments in which high-speed (18,000 fps) video imaging was used to study both a research scale metal atomiser and an analogue (water) atomiser. In the case of the metal atomiser the material being atomised was a Ni-Al alloy with an initial melt temperature of ~1800 K, wherein the melt plume had sufficient luminosity to be imaged without additional light sources being employed. For the water atomiser, the plume was imaged in reflected light from two high power halogen lamps. The resulting images have been quantitatively analysed by considering the volume of material in the plume and the position of its centre as it passes through a narrow window, a distance h below the melt delivery nozzle (see Fig. 1). For each frame two statistics are calculated, the total optical intensity of the material passing through the window, which may be associated with the volume of material, and the mean position of the centre of the plume, calculated from a weighted average of the intensities[12]. The resulting data comprise two time-series, each consisting of 65,536 points (this limit being determined by the video buffer size), spanning 3.64 s of atomisation, detailing the variation with time of the volume of material being atomised and the centre position of the plume. A Discrete Fourier Transform (DFT) was subsequently applied to each time-series to determine any dominant frequencies present.
Figure 1. Image of the atomisation plume during atomisation of Ni-Al, as captured by the high speed video camera, showing the 4 pixel high window used to sample the instantaneous intensity and position of the plume (inset - magnified view through the sampling window).
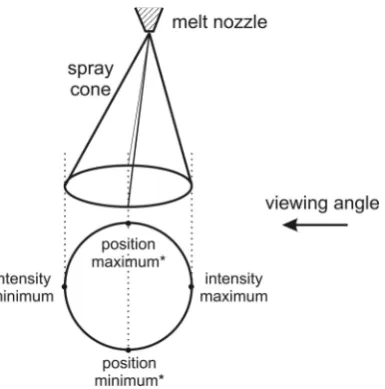
A typical set of results for this DFT analysis are shown in Fig. 2. Like Ting et al.[10] we observe dominant modes of oscillation at both low and high frequencies. The low frequency oscillation, which only appears in the intensity and not in the position spectra, is clearly associated with pulsing in the volume of material at the atomisation tip, and can be accounted for by the system alternating between open- and closed-wake conditions. The high frequency oscillation in contrast appears in both spectra with exactly the same frequency and must therefore involve a displacement of the plume, as well as a variation in the apparent brightness of the material in the plume. In fact, careful analysis of the raw time-series data reveals that the maxima (minima) in the intensity time-time-series are exactly 90° out of phase with the maxima (minima) in the position time-series. This we inferred was due to the melt plume consisting of a thin jet that was precessing around the surface of a cone, with the maxima and minima in the intensity corresponding to the jet being aligned with the line-of-sight to the camera (see Fig. 3). This would be consistent with the observation by Anderson et al.[14] of irregular filming of the melt nozzle tip by the liquid metal. However, our conclusion from these previous experiments remains an inference, rather than a direct observation. The purpose of this paper is to describe a set of experiments with an alternative imaging system that allows direct observation of precession within the melt plume. Such direct observation significantly improves the extent to which we can interpret the DFT spectra from our previous investigations.
Figure 2. DFT spectra of (a) the variation in the quantity of atomised material passing through the sample window and (b) the centre of the melt plume.
Figure 3. Schematic model showing how precession of a melt filament around the surface of a cone could give rise to variation in the intensity and position of the apparent melt plume that are exactly 90° out of phase. *Note that the maxima and minima may be interchanged depending upon the pixel number scheme.
Experimental Technique
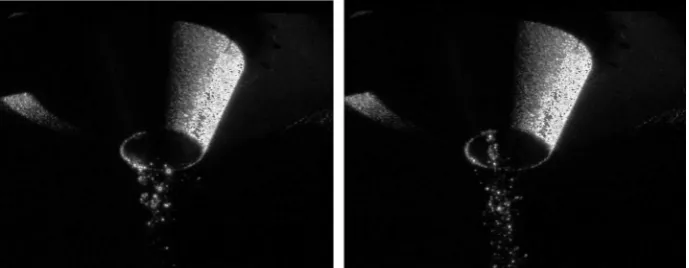
[image:4.595.205.398.305.500.2]The analogue atomiser is contained within a light tight, black anodised aluminium housing. Illumination is provided by a Nd:YAG laser with a wavelength of 532 nm, a typical energy of 90 mJ/pulse and a pulse duration of 6 ns. The laser light is converted into a 2 mm thick light sheet and fed into the interrogation area using an optical arm fitted with appropriate defocusing optics. The optical arm was positioned such that the centre of the light sheet is aligned with the centre of the melt nozzle. The short pulse duration provided by the laser allows particles to be 虎frozen誇 even in exceptionally fast flows. The laser is capable of providing two pulses with a variable delay between the pulses of 0.1 µs – 5 s. These pulses are synchronised with the shutter of a high speed, 2 Mpixel camera. The output from the system is thus a pair of images with a user defined delay between the pair and a very short effective shutter speed. Imaging was conducted either normal to the central axis of the melt delivery nozzle, or inclined to it at an angle of 35°. Example images from both configurations are shown in Fig. 5.
Figure 4. Schematic geometry of the gas delivery jets and melt delivery nozzles used in this study.
Figure 5. Example images of water atomisation obtained using the pulsed Nd:YAG laser system (a) normal to the atomiser axis and (b) offset from the normal by 35°.
A further consequence of the imaging technique is that by using appropriate software (in this case INSIGHT 3G[16]), a velocity map can be created for individual droplets within the plume using the Particle Image Velocimetry (PIV) technique. This software uses a cross-correlation algorithm to identify particles within the image pair that can be traced with a high degree of certainty from the first image to the second and, given a calibrated length scale in the image and the temporal separation between images, calculate the particle velocity. In many PIV applications tracer or seed particles are introduced into the flow, but in this work we have relied on the fact that the software is capable of detecting individual particles created by the break-up of the melt stream during atomisation. This will however inevitably lead to some biasing of the detection, with higher weighting being given to larger droplets which are easier
[image:5.595.218.379.420.602.2]to detect. Nonetheless, the technique provides valuable information regarding the particle flow field. In order to ensure reliable tracking in the atomisation environment, which contains a high density of fast moving particles, the temporal separation of the images is short, typically 5 µs.
Results
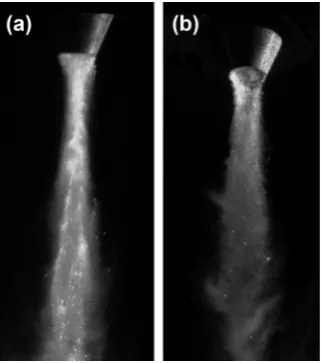
[image:6.595.126.471.324.458.2]Fig. 6. shows a pair of images taken in the 35° orientation using the flared type melt nozzle. This nozzle type was chosen as in our previous experiments[12, 13] it has been shown to give one of the sharpest peaks in the DFT spectrum. In this experiment the water flow rate has been reduced to a relatively low rate (100 cm3 min-1) as this was also known from our previous work to give a particularly sharply peaked spectra. It is clear from the two images in Fig. 6 that the melt 虎plume誇 actually consists of a very fine filament, which is indeed undergoing precessional motion. In the 500 µs interval between the two frames the filament moves from almost at the back of the nozzle (as viewed) to close to the front of the nozzle, somewhat over 120° in total, which is consistent with the 600 Hz precession frequency measured using the DFT methodology in this case. This we believe constitutes direct observational evidence for the precession of the melt plume during close coupled gas atomisation.
Figure 6. Two images, separated by 500 µs, of the melt delivery nozzle during water atomisation clearly demonstrating prescession of a thin melt filament.
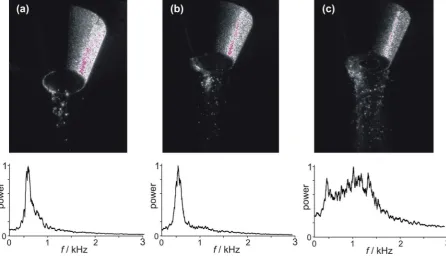
In Fig. 6, a very narrow melt filament is observed emanating from a flared type melt nozzle. As indicated above, we have previously shown that this type of melt nozzle gives a sharply peaked DFT spectrum. However, there are other atomiser configurations and operating parameter regimes which give a far more diffuse DFT spectra, particularly when the melt delivery nozzle has a broad, flat tip as shown in Fig. 4b (Type 1). In order to better understand and interpret these diffuse spectra, atomisation experiments have been performed using the three nozzle geometries shown in Fig. 4b. In each case the experiment has been filmed twice, once with the high speed video camera in order to obtain the DFT spectra and the second time with the pulsed Nd:YAG system to obtain high quality still images. The results for this are shown in Fig. 7. In order to facilitate more direct comparison between the three DFT spectra, each has been normalised to a peak spectral power of 1 and has been smoothed using a Savitzky–Golay[17] filter with a kernel width of 25. This makes it possible to unambiguously determine the full width half maximum (FWHM) of the peak, which we determine for the three cases as (a) 120 Hz, (b) 150 Hz and (c) 1060 Hz, although in case (c) it is possible that this may be a superposition of more than one overlapping peaks.
nozzle. Specifically, internal flaring of the melt nozzle appears to produce a very narrow, regular jet, whilst having a flat lip to the melt nozzle tends to produce a broad filament with a wider range of rotational frequencies being present. The extreme case of this is where the melt nozzle is completely flat, wherein a very broad melt plume is observed, covering a significant fraction of the circumference of the nozzle. The melt wetting pattern on such flat nozzles is also known to be highly erratic[14], which is consistent with the wider range of frequencies observed in the DFT.
Figure 7. Correlation between the still image and the Fourier spectra for (a) flared nozzle, (b) flared nozzle with lip and (c) flat nozzle.
Further interpretation of the still image pairs produced by the pulsed laser system can be obtained by applying PIV mapping software. A typical image, with superimposed velocity field, obtained using this procedure is shown in Fig. 8. The melt delivery nozzle, the left hand side of which is in shadow, is clearly evident at the top of the image. Two white arrows show the approximate trajectory of the gas jets as they travel parallel to the sides of the melt delivery nozzle, whilst the white marker shows the point at which the gas jets focus.
In the image the melt plume is displaced somewhat to the right. This is not unexpected given that we know that the plume is precessing. Indeed, even if the plume were to appear in the 2-D image to be central, the precession of the jet would mean that the actual melt plume would be off-axis, in this case either in front of, or behind, the central axis of the nozzle, with respect to the line of sight of the camera. Highly complex flow patterns, with many recirculation eddies, are evident, particularly downstream in the secondary atomisation zone.
From the image we have attempted to identify the 虎neck誇 in the melt plume, that is the point where the plume has its smallest diameter. In the literature this 虎neck誇 region is often depicted as being coincident with the focus of the gas jets[9], although this does not appear to be the case here, with the neck appearing approximately half way between the nozzle outlet and the focus of the gas jets. We attribute this to the asymmetry in the melt plume and note that the apparent 虎neck誇 position occurs close to where the gas jets on the right hand side of the melt nozzle (as viewed in Fig. 8) would first impinge upon the melt plume. As we are using a die with straight jets (resulting in choked flow) some spreading of the gas jets may also occur once the gas exits the jet and this may also serve to push the neck closer to the nozzle than would be expected from tracing the apparent focus of the jets.
Figure. 8. Image of water atomisation with superimposed velocity vectors calculated using the PIV technique from an image pair with 5 µs separation. The approximate trajectory of the gas jets is shown by the heavy white arrow. The focus of the jets and an apparent neck in the melt plume are also indicated.
We also note with interest the asymmetry in the flow pattern close to the nozzle in this region above the focus of the gas jets. To the right of the image (where there is a greater volume of material being atomised) there is evidence of recirculation. Conversely, on the left hand side of the image, where there is a deficiency of material being atomised, there is a strong, laminar down-flow, with no evidence of recirculation. The centre of the recirculation eddy appears close to the 虎neck誇 position.
Summary and Conclusions
8 References
suggesting a continuum variation exists between the end member geometries of completely flat and internally tapered with no flat lip whatsoever.
Interestingly, the trend in many commercial atomisers and in the literature[14] on discrete jet atomisers is towards internally flared melt nozzles with either minimal or no lip. The results presented here suggest that this accentuates the inhomogeneity in the delivery of the melt to the tip, but makes that delivery correspondingly more regular (i.e. the resulting filament is finer, but it is precessing in a more regular manner). As the effective (instantaneous) G will depend upon the width of the filament, the likely upshot of this is that a melt delivery nozzle with a pronounced internal taper will produce a more uniform product, with the melt filament always being exposed to a similar number of gas jets, but with a lower overall efficiency than a flat melt nozzle in which the broader but more erratic melt filament is exposed to a larger, but more variable number of gas jets. Other strategies, such as milling of slots in the tip of the melt delivery nozzle, have been reported[14] which aim to improve the efficiency and uniformity of melt delivery by channelling the melt towards the gas jets. Of course, in all cases low frequency pulsation in the quantity of the melt being delivered to the nozzle of the atomiser due to the open- to closed-wake transition will cause a variation in G which will be superimposed upon any variation due to erratic wetting of the nozzle.
Results from the PIV analysis suggest that there is a strong coupling between the melt and gas flow fields. Specifically, the asymmetry in the melt flow field brought about by the precession of the melt plume is mirrored in the gas flow field, with a recirculation eddy apparent where the melt plume is closer to the gas jets and a strong down-flow where it is further away from these jets. Although recirculation eddies have been postulated to exist at the circumferential edge of the gas-melt interface in the primary atomisation zone previously[6, 9], we believe that this is the first evidence for a strong asymmetry in this type of structure and is indicative of the strong coupling between the melt and gas flow field. Of course, given that the melt plume is precessing with a frequency of several hundred Hertz, it must be assumed that the observed asymmetry is varying on a commensurate time-scale.
1. D. Bradley, J. Phys. D: Appl. Phys. 6 (1973) 1724. 2. H. Lubanska, J. Metals 22 (1970) 45.
3. E. Klov & W.M. Schfer, ‘High pressure gas atomisation of metals’, 57 (1972), Syracuse, Syracuse University Press.
4 I.E. Anderson, R.S. Figliola & H. Morton, Mater. Sci. Eng. A 148 (1991) 101. 5. S.P. Mates & G.S. Settles, Adv. Powder Metall. Part. Mater., (1996) part 1, 67.
6. J. Ting, I.E. Anderson, R.L. Terpstra & J. Mi, Adv. Powder Metall. Part. Mater., (1998) part 10, 29.
7. I.E. Anderson & R.L. Terpstra, Mater. Sci. Eng. A 326 (2002) 101.
8. G.G. Nasr, A.J. Yule & L. Bendig, ‘Industrial sprays and atomisation design: Analysis and applications’, Springer Pubishing 2002, pp. 494.
9. J. Ting, M. Peretti & W.B. Eisen, Mater. Sci. Eng. A. 326 (2002) 110. 10. J. Ting, J. Connor & S .Ridder, Mater. Sci. Eng. A 390 (2005) 452. 11. S.P. Mates & G.S. Settles, Atomization and Sprays 15 (2005) 41.
12. A.M. Mullis, N.J. Adkins, Z. Aslam, I.N. McCarthy & R.F. Cochrane, Int. J. Powder Metall.
44(2008) 55.
13. I.N. McCarthy, Z. Aslam, N.J. Adkins, A.M. Mullis & R.F. Cochrane, Powder Metall. 52 (2009) 205.
14. I.E. Anderson, M. Peretti, J.A. Conin & R.S. Figliola, Proc. 3rd Int. Conf. on Spray Deposition and Melt Atomisation, (2006), Bremen, CD-proceedings.
15. V. Anand, A.J. Kaufman & N.J. Grant, Rapid Solidification Processing, Principles & Technologies II (Eds. Robert Mehrabian, B. H. Kear, M. Cohen), 1978, Claitor, Baton Rouge, LA, pp. 273.