A Dissertation on
A STUDY OF THYROID FUNCTION ABNORMALITIES IN PATIENTS WITH CHRONIC KIDNEY DISEASE
Dissertation Submitted to
THE TAMILNADU DR. MGR MEDICAL UNIVERSITY CHENNAI – 600 032
With Partial Fulfillment of the Regulations For the Award of the Degree of
M.D. GENERAL MEDICINE BRANCH – I
COIMBATORE MEDICAL COLLEGE, COIMBATORE
CERTIFICATE
This is to certify that the dissertation entitled “A STUDY OF THYROID FUNCTION ABNORMALITIES IN PATIENTS WITH CHRONIC KIDNEY DISEASE” is a bonafide research work done by Dr. RAJESH.S, Post Graduate student in General Medicine, under my direct guidance and supervision. This is being submitted to the The Tamil Nadu Dr. M.G.R. Medical University, Chennai, in partial fulfillment of the regulations for the award of M.D. Degree in General Medicine examination to be held in April 2016. I have great pleasure in forwarding the same to The Tamil Nadu Dr. M.G.R. Medical University, Chennai, Tamilnadu, India.
Dr. M.RAVEENDRAN, M.D., Dr. KUMAR NATARAJAN, M.D., Professor and Guide Professor,
Chief Medical Unit – V Head of the Department Department of Medicine, Department of Medicine
Coimbatore Medical College Coimbatore Medical College
Dr. A. EDWIN JOE M.D., B.L., The Dean
D
THE TAMILNADU DR.M.G.R MEDICAL UNIVERSITY
CHENNAI
DECLARATION BY THE CANDIDATE
I, Dr. RAJESH.S hereby declare that this dissertation entitled “A STUDY OF THYROID FUNCTION ABNORMALITIES IN PATIENTS WITH CHRONIC KIDNEY DISEASE” is a bonafide and genuine research work carried out by me under the guidance of Prof. Dr.M.RAVEENDRAN, M.D., Department of Medicine, Coimbatore Medical College, Coimbatore, in partial fulfillment of the regulations for the award of M.D. Degree in General Medicine to be held in April 2016.
This dissertation has not been submitted by me on any previous occasion to any university for the award of any degree.
Date:
A
ACKNOWLEDGEMENT
I wish to express my sincere thanks to our respected Dean Dr. A.EDWIN JOE M.D.,B.L., for having allowed me to conduct this study in our
hospital.
I express my heartfelt thanks and deep gratitude to the Head of the Department of Medicine, Prof. Dr. KUMAR NATARAJAN M.D., for his generous help and guidance in the course of the study.
I owe a great debt of gratitude to our respected Professor and unit chief Prof. Dr. M.RAVEENDRAN M.D., without whose help and advice this work would not have been possible.
I sincerely thank all Professors and Asst. Professor Dr. S. AVUDAIAPPAN M.D., Dr. A. NILAVAN M.D., for their guidance and kind
help.
I am extremely grateful to Dr. PRABAHARAN M.D., D.M.,
(NEPHROLOGY), Dr. SUNDARI M.D., (RADIODIAGNOSIS)., Dr. MANIMEGALAI.N M.D., (BIOCHEMISTRY)., for his valuable help
and cooperation for allowing me to use institutional facilities.
My sincere thank to all my friends and post-graduate colleagues for their whole hearted support and companionship during my studies.
CONTENTS
S. NO. CONTENT PAGE NO.
1 INTRODUCTION 1
2 AIMS AND OBJECTIVES 4
3 REVIEW OF LITERATURE 5
4 MATERIALS AND METHODS 47
5 RESULTS AND ANALYSIS 51
6 DISCUSSION 74
7 CONCLUSION 81
8 SUMMARY 82
9 BIBILIOGRAPHY
10
LIST OF TABLES
SI.
NO TITLE
PAGE NO 1.
DIFFERENCE BETWEEN PRIMARY AND
SECONDARY HYPOTHYROIDISM 10
2.
CONDITIONS CAUSING NON-THYROIDAL
ILLNESS 14
3. CLASSIFICATION OF CKD 21
4.
EFFECT OF THYROID DYSFUNCTION ON THE
KIDNEY 36
5. AGE WISE DISTRIBUTION OF CASES 51
6. SEX WISE DISTRIBUTION OF CASES 52
7. AGE/SEX DISTRIBUTION OF CASES 53
8. DURATION OF CKD SYMPTOMS 54
9.
DISTRIBUTION OF CREATININE CLEARANCE
IN CKD PATIENTS 55
10.
DISTRIBUTION OF BLOOD UREA IN CKD
PATIENTS 56
11.
DISTRIBUTION OF SERUM CREATININE IN
CKD PATIENTS 57
12.
DISTRIBUTION OF SERUM CALCIUM IN CKD
PATIENTS 58
13.
DISTRIBUTION OF SERUM PHOSPHOROUS IN
14.
DISTRIBUTION OF LOW T3 AMONG VARIOUS
LEVELS OF TSH 60
15. DISTRIBUTION OF LOW T4 AMONG VARIOUS LEVELS OF TSH 61
16. ANALYSIS OF T3, T4, TSH EXCLUDING HYPOTHYROIDISM 62
17. ANALYSIS OF HYPOTHYROID SYMPTOMS IN CKD 64
18. ANALYSIS OF THYROID DYSFUNCTION IN THIS STUDY 66
19. DISTRIBUTION OF CREATININE CLEARANCE IN PATIENTS WITH LOW T3 SYNDROME 67
20. DISTRIBUTION OF CREATININE CLEARANCE IN PATIENTS WITH LOW T4 SYNDROME 68
21. AGE INCIDENCE OF LOW T3 SYNDROME 69
22. SEX INCIDENCE OF LOW T3 SYNDROME 70
23. CORRELATION OF THYROID HORMONES
EXCLUDING HYPOTHYROIDISM
71
24.
CORRELATION OF THYROID HORMONES WITH SEVERITY OF RENAL FAILURE EXCLUDING HYPOTHYROIDISM
72
LIST OF CHARTS
SI.
NO. TITLE
PAGE NO
1. AGE WISE DISTRIBUTION OF CASES 51
2. SEX WISE DISTRIBUTION OF CASES 52
3. AGE/SEX DISTRIBUTION OF CASES 53
4. DURATION OF CKD SYMPTOMS 54
5. DISTRIBUTION OF CREATININE CLEARANCE
IN CKD PATIENTS 55
6. DISTRIBUTION OF BLOOD UREA IN CKD
PATIENTS 56
7. DISTRIBUTION OF SERUM CREATININE IN
CKD PATIENTS 57
8. DISTRIBUTION OF SERUM CALCIUM IN CKD
PATIENTS 58
9. DISTRIBUTION OF SERUM PHOSPHOROUS IN
CKD PATIENTS 59
10. DISTRIBUTION OF LOW T3 AMONG VARIOUS
LEVELS OF TSH 60
11. DISTRIBUTION OF LOW T4 AMONG VARIOUS
LEVELS OF TSH 61
12. ANALYSIS OF T3, T4, TSH EXCLUDING
13. ANALYSIS OF HYPOTHYROID SYMPTOMS IN
CKD 64
14. ANALYSIS OF THYROID DYSFUNCTION IN
THIS STUDY 66
15. DISTRIBUTION OF CREATININE CLEARANCE
IN PATIENTS WITH LOW T3 SYNDROME 67
16. DISTRIBUTION OF CREATININE CLEARANCE
IN PATIENTS WITH LOW T4 SYNDROME 68
17. AGE INCIDENCE OF LOW T3 SYNDROME 69
18. SEX INCIDENCE OF LOW T3 SYNDROME 70
LIST OF FIGURE
SI.
NO. TITLE
PAGE NO
1.
TSH STIMULATES IODIDE TRAP,
THYROID HORMONE SYNTHESIS AND RELEASE
6
2. BIOSYNTHESIS AND SECRETION OF
THYROID HORMONE 7
3. KIDNEY 15
4. GLOMERULAS AND BOWMANS
CAPSULE 16
5. STAGES OF CKD 20
6. CLASSIFICATION OF CKD 20
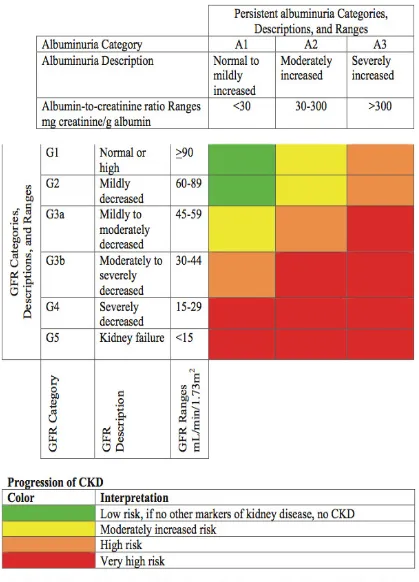
7. GFR CATEGORIES, DESCRIPTIONS, AND
RANGES 23
8. TYPES OF RENAL OSTEODYSTROPHY 29
9. COMPLICATION OF CKD 33
10. EFFECT OF THYROID HORMONES ON
THE KIDNEY 35
11.
EFFECTS OF CHRONIC RENAL FAILURE ON HYPOTHALAMUS – PITUITARY – THYROID - AXIS
L
LIST OF ABBREVIATIONS
CKD - Chronic Kidney Disease ESRD - End stage renal disease GFR - Glomerular Filtration Rate DIT - Diiodotyrosine
MIT - Monoiodotyrosine
T3 - Triiodothyronine
T4 - Thyroxine
rT3 - Reverse T3
TRH - Thyrotropin Releasing Hormone TSH - Thyroid Stimulating Hormone TBG - Thyroxine Binding Globulin
HD - Hemodialysis
ACEI - Angiotensin converting enzyme inhibitors ARB’s - Angiotensin receptor blockers
I
1
INTRODUCTION
Chronic kidney disease includes a spectrum of distinct pathophysiological processes which is associated with abnormal kidney function and a progressive reduction in glomerular filtration rate1, 2.
CKD is a clinical syndrome which occurs due to irreversible loss of renal function leading to metabolic, endocrine, excretory and synthetic function resulting in accumulation of non – protein nitrogenous substances which leads to metabolic derangements and ends up with distinct clinical manifestations.
End stage renal disease is described as a terminal stage of chronic kidney disease that without any replacement therapy patients could not survive would result in death.
In spite of diverse etiologies, CKD is the final common pathway of irreversible loss of nephrons finally resulting in alteration of “milieu interior” affecting every system in the body including thyroid hormonal system.
The functions of thyroid and kidney are interrelated3-6. The thyroid hormones are essential for growth and development of the kidney and for maintaining electrolyte and water homeostasis. On the other hand, kidney has its vital role in metabolism and elimination of thyroid hormones.
2
The kidney helps in the clearance of iodine mainly by glomerular filtration. So excretion of iodine is reduced in advanced renal failure. Impaired renal clearance of iodine leads to elevated serum levels of inorganic iodide that potentially blocks thyroid hormone production resulting in “Wolff Chaikoff” effect.
Chronic kidney disease is associated with thyroid function abnormalities leading to low levels of serum total and free T3 concentration and normal reverse T3 and free T4 levels. The TSH levels are almost normal in most patients and found to be in euthyroid state.
CKD patients may have various symptoms and signs suggestive of hypothyroidism like cold intolerance, dry coarse skin, sallow complexion, lethargy, fatigue, edema, reduced basal metabolic rate, alopecia, hyporeflexia and asthenia. So it is difficult to exclude thyroid function abnormality in patients with chronic kidney disease merely on clinical background.
Various studies have been conducted to study thyroid function abnormalities in chronic kidney disease patients. All abnormalities like hypothyroidism, hyperthyroidism and euthyroid state have been reported in the studies done previously.
3
A
4
AIMS & OBJECTIVES
AIMS :
To study the prevalence of low T3 Syndrome in Chronic kidney disease patients.
OBJECTIVES :
1. To study thyroid function abnormalities in patients with chronic kidney disease.
2. To correlate the thyroid function abnormalities with severity of renal failure.
R
5
REVIEW OF LITERATURE
ANATOMY OF THYROID GLAND:
The thyroid gland comprises two lobes united by an isthmus. It is situated in front of trachea between the suprasternal notch and cricoid cartilage. The thyroid gland weighs about 12 to 20 grams and is bigger in females than in males. Four parathyroid glands are situated back to each pole of thyroid gland, which secretes parathormone.
PHYSIOLOGY OF THYROID HORMONES:
6
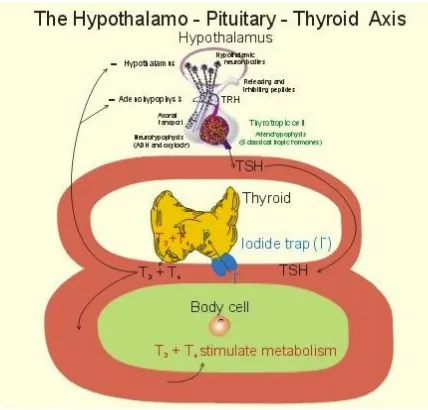
[image:26.595.101.529.57.467.2]
FIGURE-1: TSH STIMULATES IODIDE TRAP, THYROID HORMONE
SYNTHESIS AND RELEASE
The initial step in thyroid hormone synthesis is uptake of iodide. Then iodide trapping occurs by which iodide is actively transferred into thyroid cell, where it is “oxidised” to iodine. It then binds with tyrosine to produce monoiodotyrosine (MIT) and diiodotyrosine (DIT).
7
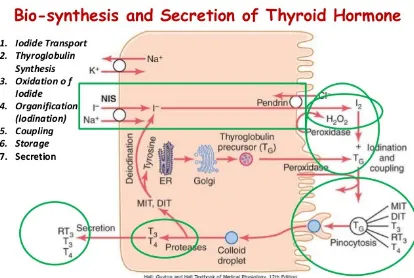
[image:27.595.114.528.142.420.2]thyroglobulin2-7. Thyroid peroxidase enzyme catalyzes oxidation, iodination and coupling reactions.
FIGURE-2: BIOSYNTHESIS AND SECRETION OF THYROID
HORMONE
8
hormones are transported in unbound form as free T3 and free T4. In circulation bound forms are in equilibrium with free forms.6, 7
In the periphery, the enzyme 5’Deiodenase converts one-third of T4 to T3 and 5 deiodenase converts 45% of T4 to rT3. Only 13% of T3 is produced directly from thyroid gland, and the rest 87% is formed from T4.
Half life of T4 is longer than T3, whereas potency of T3 is longer than T4. The half life of T4 is seven days and T3 is 10 to 24 hours.
The rate of secretion of thyroxine is 80 to 90 micrograms/day, tri-iodothyronine is 4 to 5 micrograms/day and reverse T3 is 1 to 2 microgram/day. The plasma level of total T3 is0.12 microgram/dl and T4 is 8 microgram/dl.
HYPOTHYROIDISM
Hypothyroidism is caused by reduced secretion of thyroid hormones. It leads to cretinism in children and myxedema in adults. Hypothyroidism can be either primary or secondary. There is intrinsic defect in thyroid gland in primary hypothyroidism whereas it is secondary to hypothalamic or pituitary defect in secondary hypothyroidism.
9
previous thyroid surgery, and previous treatment with radioactive iodine, injury to hypothalamus or anterior pituitary gland.
The symptoms of hypothyroidism includes8:
Tiredness Weakness Cold intolerance Constipation Dry coarse skin
Poor memory and difficulty in concentrating Loss of hair
Weight gain Breathlessness Hoarseness of voice Paresthesia
Reduced hearing Menorrhagia
Signs
Puffiness of face, hands and feet Bradycardia
Cool peripheral extremities Peripheral edema
10
Delayed tendon reflex relaxation Carpal tunnel syndrome
Serous cavity effusions.
The most important single biochemical parameter for screening hypothyroidism is TSH. TSH measurement in the normal range rules out the possibility of primary hypothyroidism but not the secondary. TSH level of > 20
[image:30.595.103.529.476.737.2]µIU/ml or if there is strong clinical suspicion level > 10 µIU/ml is necessary for diagnosing primary hypothyroidism. Along with raised TSH, there should be low free T4 level for diagnostic confirmation of hypothyroidism. Circulating free T3, though reduced in many, cannot be taken as reliable indicator because it is normal in 25% of hypothyroid patients
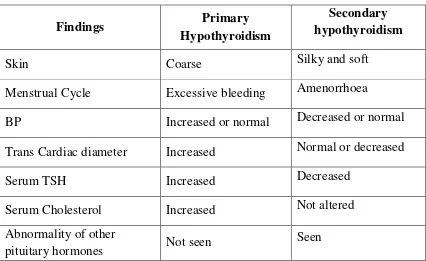
TABLE – 1 DIFFERENCE BETWEEN PRIMARY AND SECONDARY
HYPOTHYROIDISM
Findings Primary
Hypothyroidism
Secondary hypothyroidism
Skin Coarse Silky and soft
Menstrual Cycle Excessive bleeding Amenorrhoea
BP Increased or normal Decreased or normal Trans Cardiac diameter Increased Normal or decreased
Serum TSH Increased Decreased
Serum Cholesterol Increased Not altered Abnormality of other
pituitary hormones Not seen
11
HYPERTHYROIDISM:
Hyperthyroidism is a condition resulting from elevated free thyroid hormone level on the body tissues. The major cause includes Graves Disease, Toxic Multi nodular Goitre, and Solitary thyroid nodule.
Symptoms:
Intolerance to heat Sweating
Hyperactivity, Irritability Dysphonia
Palpitation
Fatigue, Weakness
Weight loss in spite of increased appetite Oligomenorrhoea
Loss of libido Polyuria Diarrhoea
Signs:
Tremors
Warm moist skin Tachycardia
12
Proximal Myopathy Muscle weakness
Apathetic thyrotoxicosis is a condition seen in elderly in whom the features of thyrotoxicosis are subtle or masked, the patients present mainly with weight loss and fatigability.
In hyperthyroidism, TSH level is reduced, total and free T3 T4 levels are increased. 2 to 5 % of patients show isolated T3 increase, a condition called as ‘T3 Thyrotoxicosis’ while total and free T4 increase with normal T3 is called ‘T4 Thyrotoxicosis’
Non Thyroidal Illness: 10-15
Various conditions predominantly affect serum T3 level, with no intrinsic disease of Thyroid gland. This is termed as ‘Low T3 Syndrome’, ‘Non Thyroid Illness syndrome’, ‘Sick euthyroid syndrome’.
The conditions include
Trauma Burns
Acute Critical illness
Acute Febrile Illness and infections, Acute myocardial infarction
13
Diabetes Mellitus Renal Disease Liver Disease Ketogenic Diet Malignancy
Certain Medications 1. Glucocorticoids 2. Beta blockers 3. Dopamine 4. Phenytoin 5. Others Psychiatric illness
14
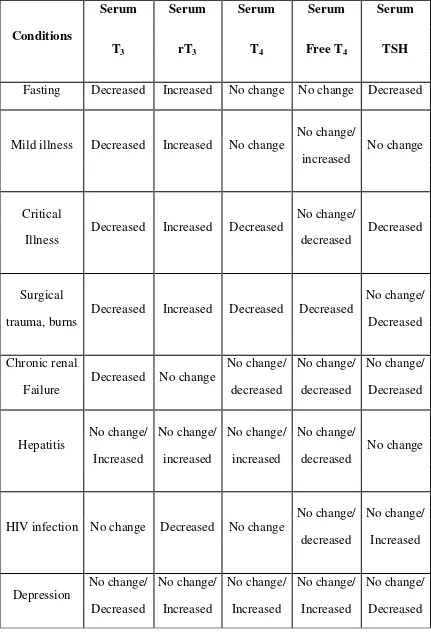
TABLE -2 CONDITIONS CAUSING NON-THYROIDAL ILLNESS
Conditions
Serum Serum Serum Serum Serum
T3 rT3 T4 Free T4 TSH
Fasting Decreased Increased No change No change Decreased
Mild illness Decreased Increased No change
No change/ increased
No change
Critical Illness
Decreased Increased Decreased
No change/ decreased
Decreased
Surgical trauma, burns
Decreased Increased Decreased Decreased
No change/ Decreased
Chronic renal Failure
Decreased No change
No change/ decreased No change/ decreased No change/ Decreased Hepatitis No change/ Increased No change/ increased No change/ increased No change/ decreased No change
HIV infection No change Decreased No change
NORMAL KIDNEY:
The kidneys are bean shaped paired retroperitoneal organs located in the lumbar region in the posterior part of the abdomen on either side of the vertebral column. The upper pole of each kidney lies opposite the 12
vertebra16 and the lower pole of each kidney lies opposite the third lumbar vertebra. The weight of eac
155 grams in females
breadth is about 5.0 to 7.5 cms, and thickness is about 2.5 to 3.0 cms.
15
NORMAL KIDNEY: 33, 34
The kidneys are bean shaped paired retroperitoneal organs located in lumbar region in the posterior part of the abdomen on either side of the vertebral column. The upper pole of each kidney lies opposite the 12
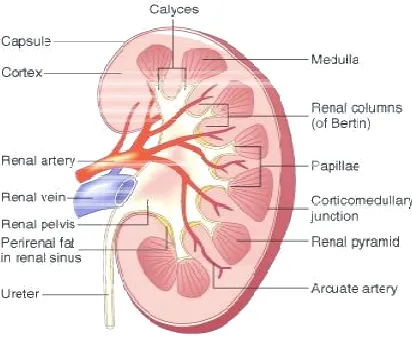
[image:35.595.112.524.342.679.2]and the lower pole of each kidney lies opposite the third lumbar vertebra. The weight of each kidney is about 125 to 170 grams in male 115 to 155 grams in females16. The length of each kidney is about 11 to 12 cms, breadth is about 5.0 to 7.5 cms, and thickness is about 2.5 to 3.0 cms.
FIGURE-3: KIDNEY
16
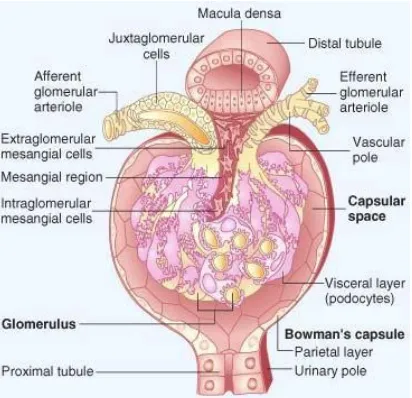
[image:36.595.127.539.239.637.2]Nephrons are the structural and functional unit of the kidney. 0.4 to1.2 million16 nephrons are present in each kidney. The Glomerulus and Bowman’s capsule are the filtering area of nephrons. Glomerulus is a cluster of capillaries formed from afferent arteriole and ends in efferent arteriole. The dilated blind end of the nephrons is Bowman’s capsule.
17
The capillary endothelium and epithelium of Bowman’s capsule which is made of podocytes, separates the blood flowing in glomerulus from bowman’s space.
The pars convoluta and pars recta constitute the proximal segment of the nephrons. The convoluted portion drains into —› straight sinus —› loop of Henle. Henle’s loop comprises the descending limb, thin segment and the ascending limb.
The pars recta (straight portion) constitute the distal segment of the nephrons. The ascending limb of Henle’s loop continues as the distal segment. It then drains into collecting tubules. The collecting tubule finally ends into the collecting duct.
BLOOD SUPPLY
The blood supply of each kidney is derived from renal arteries which arise from abdominal aorta at the level of 2nd lumbar vertebra. The renal arteries before entering the renal hilus, divides into five segmental arteries to supply five vascular segments of kidney.
The segmental arteries then ultimately divide into arcuate arteries which further subdivide into intralobular arteries. The intralobular arteries then give rise to afferent arteriole which forms the glomerular tuft.
18
recta are formed from peritubular capillaries before becoming intralobular veins.
FUNCTIONS OF THE KIDNEY
The major functions of the kidney includes
Excretion of metabolic waste products, toxins and some drugs. Regulation of fluid and electrolyte balance.
Regulation of acid – base balance.
Regulation of body fluid osmolality and electrolyte composition. Regulation of blood pressure.
It also plays a vital role in secretion, metabolism and excretion of hormones. Its major endocrine function includes production of erythropoietin, renin, prostaglandins and endothelins.
The major metabolic function of the kidney includes 1hydroxylation of 25 hydroxy D3 and helps in vitamin D synthesis. It helps in regulation of erythrocyte production by secreting erythropoietin.
DETERMINANTS OF GFR18
Cockcroft and Gault formula is used in estimating GFR.
19
CHRONIC KIDNEY DISEASE17
Definition
Evidence of kidney damage for more than or equal to three months as described by anatomical or physiological abnormalities of the kidney, with or without reduced GFR.
GFR less than 60 ml/min/1.33m2 for more than or equal to three months with or without other signs of kidney damage.
Causes of chronic kidney disease
The most common cause of chronic kidney disease in developed countries is diabetic glomerulosclerosis whereas in developing countries primary glomerulonephritis is the leading cause.
MAJOR ETIOLOGIES OF CKD
Diabetic nephropathy Glomerulonephritis
Hypertension – associated CKD
Autosomal dominant polycystic kidney disease Tubulointerstitial nephropathy
20
[image:40.595.109.517.403.717.2]Stages of CKD17
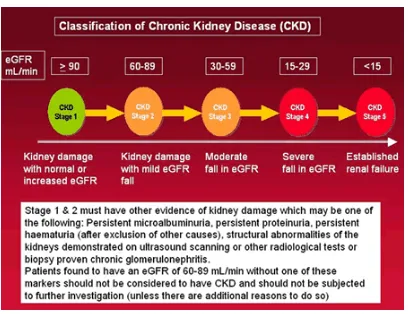
FIGURE-5: STAGES OF CKD
21
TABLE 3. CLASSIFICATION OF CKD
Classification of chronic kidney disease by pathology and etiology
Pathology Etiology
1.Diabetic glomerulosclerosis
2.Glomerular diseases (primary or secondary)
Proliferative glomerulonephritis
Minimal change disease Focal glomerular sclerosis Membranous nephropathy Fibrillary glomerular diseases Hereditary nephritis
Diabetes mellitus (type 1&2) Largely unknown
Systemic lupus erythematous, Vasculitis, hepatitis B or C, human immunodeficiency virus (HIV) bacterial endocarditis
Hodgkin’s disease HIV, heroin toxicity
22
3.Vascular diseases
Diseases of large size vessels Diseases of medium size vessels (nephrosclerosis)
Diseases of small vessels (microangiopathy)
4.Tubulointerstital diseases Tubulointerstitial nephritis Reflux nephropathy
Obstructive nephropathy Myeloma kidney
5. Cystic diseases
Polycystic kidney disease Tuberous sclerosis
Von – Hippel – landau disease Medullary cystic disease
Renal artery stenosis, aortoarteritis Hypertension
Haemolytic uraemic syndrome, vasculitis, sickle cell disease.
Infections, drugs, sarcoidosis Vesico – ureteric reflux
Stones, prostatism, malignancy Multiple myeloma
23
24
PATHOPHYSIOLOGY
The two extents of mechanisms of kidney damage involved in pathophysiology of CKD include:
1. Initiative mechanisms which is definite to the underlying etiology.
2. Progressive mechanisms, involving hyperfiltration and hypertrophy of remaining viable nephrons following long term reduction of renal mass, regardless of underlying etiology.
The mediators for nephron loss are Cytokines
Growth factors Vasoactive hormones
At last, short term adaptations of hypertrophy and hyperfiltration becomes maladaptive as the pressure increases and flow within the nephron susceptible to glomerular architectural distortion, podocyte dysfunction and interruption of filtration barrier which leads to sclerosis and dropout of remaining viable nephrons. Increased renin- angiotensin system contributes to both initiative and subsequent maladaptive hypertrophy and sclerosis.
25
INTACT NEPHRON HYPOTHESIS
In CKD patients, there is progressive loss of functioning nephrons. The remaining few viable nephrons compensate for nephron loss and tends to hypertrophy which results in increased work load, so overall functional loss is reduced. This adaptive mechanism is known as compensatory hyperfiltration.
A study conducted in renal transplant donors, there is 40% increased in glomerular filtration and renal plasma flow in the remaining kidney within weeks after nephrectomy. The GFR increases to about 70% of prenephrectomy value.
Increased perfusion of remaining viable nephrons leads to produce increased volume of filtrate. The tubules respond to these changes by excreting fluids and solutes in amounts which helps in maintaining external balance. This close integration of functions of glomerulus and tubules is known as “glomerulotubular balance” which is preserved till late stages of CKD.
TRADE OFF HYPOTHESIS
26
MIDDLE MOLECULE HYPOTHESIS19
In patients treated with maintenance peritoneal dialysis, there is conflict between the degree of azotemia and severity of symptoms. Inspite of high renal parameters symptoms of uraemia are mild in patients with maintenance peritoneal dialysis and they are less prone for developing features of peripheral neuropathy when compared with patients on hemodialysis.
These above mentioned features suggest that toxicity is mainly related to accumulation of substances with high molecular weight. These toxic substances are cleared more readily with maintenance peritoneal dialysis than by hemodialysis. Comparing to hemodialysis membrane, the peritoneal dialysis membrane are more permeable to solutes of middle molecular weight (50 to 500 daltons).
FLUID, ELECTROLYTES AND ACID BASE DISORDERS
Sodium and water homeostasis
In CKD patients, extracellular fluid volume is maintained in the normal range till the very late stages of CKD. Fractional excretion of sodium increases in patients with CKD so that absolute sodium excretion is not changed until late changes.
27
CKD patients, which is mainly seen with tubulointerstitial diseases (salt losing nephropathies). Volume overload is mainly due to retention of sodium which leads to peripheral edema, arterial hypertension and cardiac failure.
Diuretics are used to force natriuresis in CKD patients. Thiazide diuretics have a little role, higher doses of loop diuretics are recommended in CKD. Loop diuretics can be combined with metalazone, which inhibits sodium chloride co–transporter present in the distal convoluted tubule of the kidney, promoting increased sodium excretion.
Potassium homeostasis
In CKD, potassium excreting capacity of kidneys is reduced which is proportional to loss of glomerular filtration. The adaptive mechanisms are stimulation of aldosterone and increasing extrarenal (intestinal) excretion of potassium to maintain potassium homeostasis until the glomerular filtration 10 ml/minute.
28
Hypokalemia is rare in CKD, if it present it is mainly seen with excessive diuretic therapy, extrarenal (gastrointestinal) loss, reduced intake of potassium.
Metabolic acidosis
In earlier stages of CKD non anion gap metabolic acidosis is mainly seen. In advanced stages of CKD, the net daily total urinary acid excretion is limited to 30 – 40 mmol and anion gap of not more than 20mEq/L is seen generally.
Haematological changes20
In CKD there is reduced renal synthesis of erythropoietin, a hormone involved in stimulation of bone marrow red blood cell production, as a result normocytic normochromic anaemia occurs.
The other causes of anaemia in CKD includes Shortened RBC survival time
Iron deficiency
Vitamin B12 and folate deficiency
Uraemia induced platelet dysfunction and bleeding Aluminium toxicity
Chronic inflammation
Bone Changes21
Disorders of mineral metabolism in CKD
resulting in both skeletal and extraskeletal manifestations. Mineral and bone metabolism disorder in CKD manifests as:
Abnormalities of calcium, phosphorous, parathormone and vitamin D metabolism.
Abnormalities of bone turn
Vascular and soft tissue calcification.
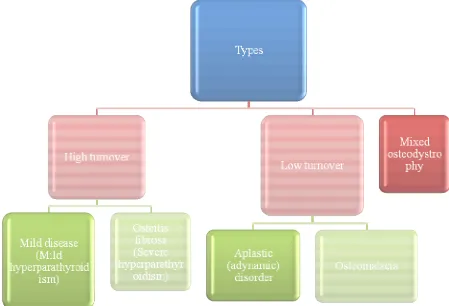
Renal osteodystrophy
FIGURE-29
Disorders of mineral metabolism in CKD lead to metabolic bone disease resulting in both skeletal and extraskeletal manifestations.
Mineral and bone metabolism disorder in CKD manifests as:
Abnormalities of calcium, phosphorous, parathormone and vitamin D
Abnormalities of bone turn over, mineralisation. Vascular and soft tissue calcification.
Renal osteodystrophy
8: TYPES OF RENAL OSTEODYSTROPHY
lead to metabolic bone disease
Abnormalities of calcium, phosphorous, parathormone and vitamin D
[image:49.595.78.527.389.695.2]30
PATHOGENESIS
High turnover bone disease
Secondary hyperparathyroidism in CKD is the cause for high turnover bone disease. In the early stages of CKD, there will be parathyroid gland hyperplasia and increased levels of parathormone in blood. These changes are caused by hypocalcemia, hyperphosphatemia, reduced synthesis of calcitriol, parathormone resistance, and intrinsic alterations in parathyroid gland.
Low turnover bone disease
Low turnover bone disease is characterised by depressed bone formation which is mainly seen in patients on dialysis. Osteomalacia can also occur mainly due to accumulation of aluminium at bone surfaces. Aplastic bone disease can be seen even before dialysis.
Mixed osteodystrophy
It includes features of both high turnover bone disease and low turnover bone disease.
CKD AND HEART
31
Uraemic encephalopathy
It may present as acute or subacute organic brain syndrome when glomerular filtration declined to less than 10% of normal. That clinical presentation of uraemic encephalopathy includes altered consciousness, psychomotor disturbances, and disorders of thinking, memory, speech, perception and emotion.
Peripheral neuropathy
The classical features of peripheral neuropathy are seen in advanced stages (stage IV and V) of CKD. The involvement of sensory neuropathy is more common than motor neuropathy. The lower extremities are more involve than upper extremities and distal part of limb is more involved than proximal part.
Restless leg syndrome
32
Gastrointestinal abnormalities
Uraemic gastritis, peptic ulcer disease and mucosal ulcerations can be seen anywhere in the gastrointestinal tract in patients with chronic kidney disease.
Metabolic disturbances
Fasting hyperinsulinemia and tendency to spontaneous hypoglycemia are seen in patients with end stage renal disease . Insulin requirement may be reduced in late stages of CKD. The other abnormalities seen are impaired glucose tolerance and reduced insulin sensitivity.
Dermatological abnormalities
FIGURE
33
34
THYROID AND KIDNEY
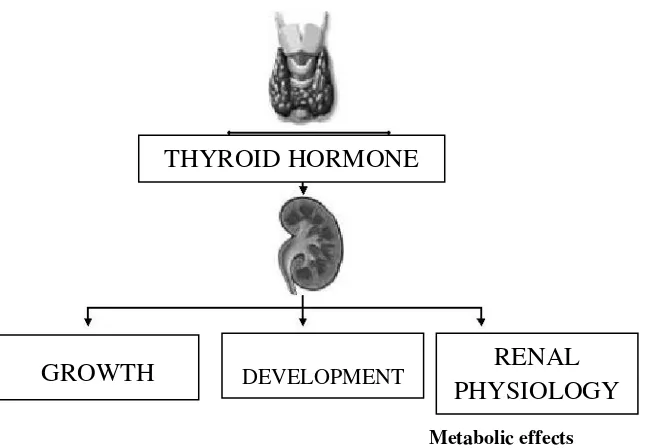
Thyroid hormones play a vital role in renal development and physiology39,40,41,42,43. On the other hand kidney disease can lead to thyroid dysfunction.
Effects of thyroid hormone on renal development:
It helps in protein synthesis and cell growth. The functioning renal mass (kidney to body mass ratio) is affected by thyroid hormone. In hypothyroidism the ratio is reduced, increased in hyperthyroidism whereas protein breakdown and ultimately renal atrophy occurs in severe hyperthyroidism44. Thyroid hormone increases the activity of Na-P co-transporter49, Na-H exchanger50 and Na/K ATPase51 in the proximal convoluted tubule.
Effect of thyroid hormone on renal physiology:
35
FIGURE-10: EFFECTS OF THYROID HORMONES ON
THE KIDNEY.
The thyroid hormone increases the activity of Na/K/ATPase on proximal convoluted tubule and also increases sodium reabsorption. Thyroid hormones also influences on tubular potassium permeability52 and tubular calcium reabsorption53. By adrenergic regulation54 thyroid hormones also affect the renin angiotensin aldosterone axis and helps in renin release55.
THYROID HORMONE
GROWTH DEVELOPMENT RENAL
PHYSIOLOGY
Metabolic effects
Increase sodium tubular reabsorption
Stimulate renin secretion
Control sulfate homeostasis
36
TABLE 4. EFFECT OF THYROID DYSFUNCTION ON THE KIDNEY
Hypothyroidism Hyperthyroidism
Serum creatinine Increased Decreased
Glomerular filtration Decreased Increased
Renal plasma flow Decreased Increased
Sodium reabsorption Decreased Increased
Hypothyroidism and Renal function
In hypothyroidism there will be increases serum creatinine level 45,46,47 reduced glomerular filtration and renal plasma flow. The direct effect of thyroid hormone on cardiovascular system produces increased peripheral vascular resistance, diminished myocardial contractility and stroke volume and its effect on metabolism causes hyperlipidemia. The indirect effects of thyroid hormones are mediated through insulin like growth factor type I and vascular endothelial growth factor63.
37
The proximal tubular reabsorption sodium, chloride and water are reduced65. The pathological changes such as glomerular basement membrane thickening and mesangial matrix expansion are seen in hypothyroidism64 which leads to diminished renal blood flow.
The sensitivity of collecting duct to vasopressin receptor is increased reversibly, thus increasing free water reabsorption. There is diminished production of Cystatin –C, so that serum levels of Cystatin – C is reduced in hypothyroidism62. Most of the above mentioned changes are reversible with treatment of hypothyroidism with levothyroxine.
Hyperthyroidism and renal function
Thyroid hormones have positive chronotrophic57, inotrophic58 effect and also decrease systemic vascular resistance59 which indirectly contributes to increase in renal blood flow.
The other indirect effects of thyroid hormones to increase renal blood flow are by increasing endothelial production of nitric oxide60 along with reduction in endothelin, a renal vasoconstrictor.
38
In hyperthyroidism there is accentuated activity of apical Na-H exchanger50, basolateral Na/K/ ATPase48, Na – Pi co-transporter49.
In hyperthyroidism serum creatinine is significantly reduced due to increased glomerular filtration and reduction in overall muscle mass61. Due to glomerular hyperfiltration there is increase in 24 hour – urinary protein44.
CKD and thyroid function abnormalities
Hyperthyroidism accelerates the CKD by various mechanisms which includes,
• It results in intraglomerular hypertension which produces increased
filtration pressure and consequent hyperfiltration.
• It predisposes to proteinuria which causes direct renal injury66.
• Down regulation of superoxide dismutase and increased mitochondrial
energy metabolism contributes to free radical generation and subsequent renal injury.
• Oxidative stress.
The earliest thyroid dysfunction seen among chronic kidney disease patients is low T3 level (particularly total T3 than Free T3)67. This is known as low T3 syndrome.
Low T3 syndrome occurs in CKD due to 1. Chronic metabolic acidosis
39
3. Protein malnutrition
4. Reduced peripheral conversion of T4 to T3 5. Iodothyronine deiodination
The inflammatory cytokines such as tumor necrosis factor alpha (TNF alpha) interleukin – 1 (IL -1) In CKD patient inhibits the expression' of enzyme type 1 5’ deiodinase, which is necessary for peripheral conversion of T4 to T3.
There is increased serum iodine level due to impaired renal handling, causing a Wolff – Chaikoff effect68.
There is reduced iodide excretion resulting in elevated serum iodide level and iodine content of thyroid gland which consequently produces enlargement of thyroid gland. There is increased prevalence of thyroid nodule, goitre, thyroid carcinoma in chronic kidney disease patients when compared to general population78.
The CKD patients on haemodialysis have low levels of thyroid hormones and elevated TSH. Though there is reduction in total T4 level due to heparin induced impaired protein binding, there will be increased free T4 fractions seen in patients after heparin dialysis69.
40
The CKD mediated thyroid function abnormalities are recovered after renal transplantation71. Within the first three to four months low T3 and low T4 levels recovers after kidney transplantation.
Other renal diseases associated with thyroid dysfunction
Membranous nephropathy72,73. Ig A nephropathy74.
Membranous proliferative glomerular nephritis75. Minimal change disease76.
Tubulointerstitial nephritis and uveitis77.
PATHOPIIYSIOLOGY OF LOW T3 SYNDROME
In CKD patients there is initial decrease in Total T3, later T4 in spite of low or normal TSH.7,22 There areseveral mechanisms that have been proposed for the change in thyroid profile in CKD.
41
FIGURE-11: EFFECTS OF CHRONIC RENAL FAILURE ON
HYPOTHALAMUS-PITUITARY-THYROID AXIS
Normal or High TSH
Altered TSH circadian rhythm Reduced TSH response to TRH Abnormal TSH glycosylation Altered TRH and TSH clearance
Increased thyroid volume
High prevalence of goitre and hypothyroidism
High prevalence of thyroid nodules and thyroid
carcinoma
Low or normal total T3 or total T4
Reduced or normal free T3 and free T4
Reduced T3 conversion from T4
Eleva
tion of free T4 induced by heparin in HD
Normal total rT3 and elevated free rT3
Alteration in binding proteins
Reduced T4 response to exogenous TSH
Reduced iodide renal excretion
42
1. Changes in Hypothalamic — pituitary — thyroid axis
There is decreased sensitivity of TSH secretion in response to low thyroid hormone.
The TSH reserve is limited.13
Reduced nocturnal pulses of TSH secretion Due to changes in thyrotrophs or to decreased secretion of TRH.15,23,26
Tissue concentration of the thyroid hormone may be appropriate, so the patient is in euthyroid state.13
Serum Free T3 and Free T4 appears normal by sensitive methods24,25 .2. Changes in hormonal Transport
The binding of thyroxine with thyroxine binding globulin is prevented by presence of protein and non protein inhibitors. Non esterified unsaturated fatty acid is non protein inhibitor.15,29
There is acquired intrinsic structural alternation in the T4 binding site30 Reduced concentration of thyroxine binding globulin.13,15
3. Changes in metabolism
Decreased activity of lodothyronine 5 — Deiodinase is seen, resulting in low T3.13,15
43
As already mentioned, there is no net increase of reverse T3 in CKD patients due to redistribution of rT3 into extra vascular compartment13,15
4. Changes in plasma membrane Transport
The thyroid hormones T3 and T4 enter cells not only by diffusion but also by active energy dependent transport across plasma membrane.
Accumulation of certain substances in blood of CKD patients prevents uptake and subsequent deiodination.
The substances are
A. 3 — carboxy 4— methyl 5 — propyl 2— Furane (CMPF)
B. Indoxyl sulphate
In uraemia there is no compromise in the action of thyroid hormones at nuclear level. Recent study also shows that there is increased receptor expression to preserve tissue euthyroidism state.31
DIAGNOSIS OF PRIMARY THYROID DISEASES IN
44
The diagnosis of hypothyroidism should be made only if the following criteria exist:
There should be an elevation of basal TSH value of > 20 µIU/m1.
The both total and free T4 level should be distinctly low in the presence of normal TBG31.
Presence of anti thyroid antibodies can provide clue for hypothyroidism.31
Reverse T3 is not so useful because it is reduced in CKD.
In CKD primary hyperthyroidism is very rare. This condition should be diagnosed with
High serum total and free T4 concentration. Low serum TSH values
High serum T4 level with low T3 in the presence of CKD should make the possibility of T4 thyrotoxicosis. This is due to suppression of serum T3 level in low T3 syndrome but serum T4 remains unaffected15.
MANAGEMENT
There are several studies which have been conducted in patients with the Low T3 syndrome in order to correct the thyroid profile by treating with Levothyroxine32 and Triiodothyronine25.
45
jig/Kg of levothyroxine for 2 weeks. There is significant increase in thyroxine level in treated patients.
There is also significant rise in serum T3 levels. But increased mortality was seen in the treatment group on day 5-17.
Carter et al25 studied effects of administration of Triiodothyronine in the patients with CKD. The study showed that there is no change in serum T3 level over a period of 12 weeks. The mean serum T4 and TSH levels were affected significantly. But there was no subjective improvement seen in this group of patients.
Based on above observations, it has been suggested that low serum T3 level in patients with CKD is metabolically protective and it is interpreted as physiological adaptation to a reduced basal metabolic rate (BMR) and to conserve energy in an adverse environment. Because of that, this condition has been renamed as “Thyroid hormone adaptation syndrome”.15
46
PROGNOSIS
M
47
MATERIALS AND METHODS
Source of data
Patients who were on conservative management fulfilling the criteria for chronic kidney disease admitted in Department of Medicine, Coimbatore medical college & hospital, Coimbatore.
Methods of collection of data
Study subjects:
The present study is conducted on 50 patients, who are diagnosed to have chronic kidney disease and on conservative management, being admitted in Department of Medicine, Coimbatore medical college & hospital, Coimbatore, during the period of July 2014 to July 2015. These samples are selected by using simple random sampling method. Statistical parameters such as mean, standard deviation (SD) and correlations are used, and parametric and non parametric tests are used for the analysis.
Informed consent was obtained from all the patients.
Study design: An observational, cross sectional
Inclusion criteria:
Patients with chronic kidney disease.
48
Criteria for Chronic Kidney Disease
1. Presence of uraemic symptoms for 3 months or more
2. Raised blood urea, serum creatinine and reduced creatinine clearance. 3. Ultra sonogram evidence of chronic kidney disease
• Bilateral contracted kidneys — size less than 9 cm. • Poor cortico-medullary differentiation.
• Supportive laboratory evidence of CKD like anaemia, changes in
serum electrolytes, etc.,
Exclusion criteria
1. Patients on peritoneal dialysis or hemodialysis 2. Nephrotic range of proteinuria
3. Hypoalbuminemia 4. Other conditions like
• Acute illness • Diabetes mellitus • Recent surgery • Trauma
• Burns
• Liver diseases
• Drugs altering thyroid profile like amiodarone, phenytoin,
49
Detailed history and clinical examination were undertaken in patients with CKD and who were on conservative management with preference to renal and thyroid diseases. The following investigations were done.
• Urine routine and microscopic examinaition. • Peripheral smear for anaemia
• Blood urea
• Serum Creatinine
• Creatinine clearance (using Cockcroft — Gault formula) • Serum electrolytes
• Serum calcium, phosphorous and uric acid • Serum cholesterol
• 24 hours urinary protein
• Serum protein (Total protein / albumin / globulin) • USG abdomen for evidence of chronic kidney disease
After selection of patients, fulfilling the above criteria, about 5 ml of
blood sample is collected in non-heparinised serum bottle and sent for thyroid profile test.
Components of thyroid profile included in our study Serum Triiodothyronine (T3)
Serum thyroxine (T4)
50
Quantitative determnation of T3, T4 and TSH is done by Enzyme Linked Immunosorbent Assay.
THYROID PROFILE NORMAL RANGE
Total T3 0.6 to 2.1 ng/ml
Total T4 5 to 13 micro gram/dl
TSH 0.4 to 7 micro IU/ml
R
In our study 50 patients of CKD who were on conservative management fulfilling the criteria for CKD were studied, among these 34 were males and 16 were females, their age varied from 20
TABLE
Age(Years)
<30 30 – 60
>60 Total
CHART
Among the 50 patients in our study, patients who were 30 years old and below were 9 constituting 18%, between 31
70% and 60 years of age and above were 6 in number constituting 12%.
51
RESULTS AND ANALYSIS
In our study 50 patients of CKD who were on conservative management fulfilling the criteria for CKD were studied, among these 34 were males and 16 were females, their age varied from 20 - 68 years.
TABLE – 5: AGE DISTRIBUTION OF CASES
Age(Years)
Total
Number Percentage
<30 9 18%
60 35 70%
>60 6 12%
Total 50 100%
CHART – 1 - AGE DISTRIBUTION OF CASES
Among the 50 patients in our study, patients who were 30 years old and below were 9 constituting 18%, between 31 - 60 years were 35
70% and 60 years of age and above were 6 in number constituting 12%.
18%
70% 12%
AGE
<30 30 – 60 >60
In our study 50 patients of CKD who were on conservative management fulfilling the criteria for CKD were studied, among these 34 were males and 16
: AGE DISTRIBUTION OF CASES
Percentage
18% 70% 12% 100%
AGE DISTRIBUTION OF CASES
[image:73.595.149.500.260.572.2]52
TABLE – 6 – SEX DISTRIBUTION OF CASES
CHART – 2 – SEX DISTRIBUTION OF CASES
Among the 50 patients study, 68% of patients were males and 32% patients were females.
68% 32%
0%
Chart Title
MALE FEMALE SEX
TOTAL
MALE FEMALE
34 16 50
53
TABLE – 7 – AGE/ SEX DISTRIBUTION OF CASES
Age(Years)
Sex Total
Male Female Number Percentage
<30 8 1 9 18%
30 – 60 23 12 35 70%
>60 3 3 6 12%
Total 34 16 50
Mean age of males 43.5+13.49 Mean age of females 48+13.47 ‘t’= 1.1, p= >0.05 (Not significant)
CHART – 3 – AGE / SEX DISTRIBUTION OF CASES
0 5 10 15 20 25
<30 30-60 >60
AGE/SEX DISTRIBUTION FEMALE
TABLE
Duration of symptoms
(Months) 0 7-13 19 25 Total CHART
In our study the duration of symptoms of CKD ranges from 4 months to 30 months, while most were in the 7
being 9.84 months.
[image:76.595.124.507.123.538.2] [image:76.595.143.489.456.662.2]54
TABLE-8 DURATION OF CKD SYMPTOMS
Duration of symptoms
(Months)
No. of patients Percentage
0-6 18
-12 24
13-18 4
19-24 1
25-30 3
Total 50
CHART -4 -DURATION OF CKD SYMPTOMS
In our study the duration of symptoms of CKD ranges from 4 months to 30 months, while most were in the 7 – 12 months of duration. Mean duration
36%
48% 8%
2%6%
SYMPTOMS DURATION
0-6 MONTHS 7-12 MONTHS 13-18 MONTHS
19-24 MONTHS 25-30 MONTHS
DURATION OF CKD SYMPTOMS
Percentage 36% 48% 8% 2% 6%
DURATION OF CKD SYMPTOMS
TABLE – 9 – DISTRIBUTION OF CREATININE CLEARANCE IN Creatinine clearance(ml/minute) <15 15-30 >30 Total
CHART – 5 – DISTRIBUTION OF CREATININE CLEARANCE IN
Of the 50 patients, 33
accounting to 66%, 15 patients had GFR ranging from 15
accounting for 30% and 2 patients had GFR ranging from more than ml/minute accounting for 4%. Among the patients studied most were in the range of creatinine clearance <15 ml/minute.
55
DISTRIBUTION OF CREATININE CLEARANCE IN
CKD PATIENTS
Creatinine
clearance(ml/minute) No. of patients
33 15 2 50
DISTRIBUTION OF CREATININE CLEARANCE IN
CKD PATIENTS
Of the 50 patients, 33 patients had GFR of less than 15 ml/minute accounting to 66%, 15 patients had GFR ranging from 15
accounting for 30% and 2 patients had GFR ranging from more than ml/minute accounting for 4%. Among the patients studied most were in the range of creatinine clearance <15 ml/minute.
<15, 33 15 - 30, 15
>30, 2
CREATININE CLEARANCE
DISTRIBUTION OF CREATININE CLEARANCE IN
Percentage
66% 30% 4%
DISTRIBUTION OF CREATININE CLEARANCE IN
TABLE – 10 – DISTRIBUTION OF BLOOD UREA IN CKD PATIENTS
Blood urea(in mg/dl)
40-80
81-120
121-160
161-200
CHART – 6 – DISTRIBUTION OF BLOOD UREA IN CKD PATIENTS
The blood urea
102.12. Among the patients studied most of them have blood urea in the range of 81- 120 mg/dl.
56
DISTRIBUTION OF BLOOD UREA IN CKD PATIENTS
Blood urea(in mg/dl) No of patients
80 14
120 24
160 8
200 4
DISTRIBUTION OF BLOOD UREA IN CKD PATIENTS
The blood urea value varied from 45 – 184 mg/dl, the mean value being 102.12. Among the patients studied most of them have blood urea in the range
28%
48% 16%
8%
BLOOD UREA
40-80 81-120 121-160 161-200
DISTRIBUTION OF BLOOD UREA IN CKD PATIENTS
No of patients
DISTRIBUTION OF BLOOD UREA IN CKD PATIENTS
TABLE – 11- DISTRIBUTION OF SERUM CREATININE IN CKD
Serum creatinine(in mg/dl)
0-4. 4-8. 8-12. 12-16.
CHART – 7- DISTRIBUTION OF SERUM CREATININE IN CKD
The creatinine values varied from 3
7.34. Among the patients study most of them have serum creatinine in the range of 4 – 8 mg/dl.
57
DISTRIBUTION OF SERUM CREATININE IN CKD
PATIENTS
Serum creatinine(in mg/dl) No of patients
4. 6
8. 27
12. 12
16. 5
DISTRIBUTION OF SERUM CREATININE IN CKD
PATIENTS
The creatinine values varied from 3 – 14 mg/dl, the mean value being 7.34. Among the patients study most of them have serum creatinine in the
mg/dl. 12% 54% 24% 10%
SERUM CREATININE
0-4. 4-8. 8-12. 12-16.
DISTRIBUTION OF SERUM CREATININE IN CKD
No of patients
DISTRIBUTION OF SERUM CREATININE IN CKD
TABLE – 12- DISTRIBUTION OF SERUM CALCIUM IN CKD Serum calcium(mg/dl) Low Normal High Total
CHART – 8- DISTRIBUTION OF SERUM CALCIUM IN CKD
Serum calcium values were
for 20%, normal in 28 patients accounting for 56% and high in 12 patients accounting for 24%.
0 5 10 15 20 25 30 LOW 58
DISTRIBUTION OF SERUM CALCIUM IN CKD
PATIENTS
Serum calcium(mg/dl) No. of patients Percentage
10 28 12 50
DISTRIBUTION OF SERUM CALCIUM IN CKD
PATIENTS
Serum calcium values were found to be low in 10 patients accounting for 20%, normal in 28 patients accounting for 56% and high in 12 patients
LOW
NORMAL
HIGH
SERUM CALCIUM
DISTRIBUTION OF SERUM CALCIUM IN CKD
Percentage
20% 56% 24% 100%
DISTRIBUTION OF SERUM CALCIUM IN CKD
TABLE – 13- DISTRIBUTION OF SERUM PHOSPHORUS IN CKD Serum phosphorus (mg/dl) Low Normal High Total
CHART – 9- DISTRIBUTION OF SERUM PHOSPHORUS IN CKD
Serum phosphorus values were found to be high in 12 patients accounting for 24% and the remaining 38 patients were found to be in normal range accounting for 76%.
0 10 20 30 40 59
DISTRIBUTION OF SERUM PHOSPHORUS IN CKD
PATIENTS
Serum phosphorus
No. of patients Percentage
0 38 12
50
DISTRIBUTION OF SERUM PHOSPHORUS IN CKD
PATIENTS
Serum phosphorus values were found to be high in 12 patients accounting for 24% and the remaining 38 patients were found to be in normal
accounting for 76%.
LOW
NORMAL
HIGH
SERUM PHOSPHORUS
SERUM PHOSPHORUS
DISTRIBUTION OF SERUM PHOSPHORUS IN CKD
Percentage
0% 76% 24%
DISTRIBUTION OF SERUM PHOSPHORUS IN CKD
TABLE – 14- DISTRIBUTION OF LOW T3 AMONG VARIOUS
TSH level
Normal High Total
X2- 2.24
p>0.05 (Not significant)
CHART – 10- DISTRIBUTION OF LOW T3 AMONG VARIOUS
In our study out of 50 patients, 33 patients had low serum T3 levels (66%). 4 patients among low serum T3 value, they also had low T4 and high TSH suggesting primary hypothyroidism (8%). So excluding 4 patients of hypothyroidism 29 patients had low T3 syndrome in our study.
60
DISTRIBUTION OF LOW T3 AMONG VARIOUS
LEVELS OF TSH
LOW T3 NORMAL T3
29 4 33
p>0.05 (Not significant)
DISTRIBUTION OF LOW T3 AMONG VARIOUS
LEVELS OF TSH
In our study out of 50 patients, 33 patients had low serum T3 levels (66%). 4 patients among low serum T3 value, they also had low T4 and high TSH suggesting primary hypothyroidism (8%). So excluding 4 patients of
idism 29 patients had low T3 syndrome in our study.
29 17
Low T3 Normal T3
DISTRIBUTION OF LOW T3 AMONG VARIOUS
NORMAL T3
17 0 17
DISTRIBUTION OF LOW T3 AMONG VARIOUS
In our study out of 50 patients, 33 patients had low serum T3 levels (66%). 4 patients among low serum T3 value, they also had low T4 and high TSH suggesting primary hypothyroidism (8%). So excluding 4 patients of
TABLE – 15 - DISTRIBUTION OF LOW T4 AMONG VARIOUS
TSH level
Normal High Total
X2-9.23
p<0.05 (significant)
CHART – 11 - DISTRIBUTION OF LOW T4 AMONG
16 patients had low T4 levels in our study, out of which 4 patients had low T3 and high TSH suggesting primary hypothyroidism. Excluding hypothyroidism 12 (24%) patients had low T4 in our study.
61
DISTRIBUTION OF LOW T4 AMONG VARIOUS
LEVELS OF TSH
LOW T4 NORMAL T4
12 4 16
DISTRIBUTION OF LOW T4 AMONG
LEVELS OF TSH
16 patients had low T4 levels in our study, out of which 4 patients had low T3 and high TSH suggesting primary hypothyroidism. Excluding hypothyroidism 12 (24%) patients had low T4 in our study.
12
34
LOW T4 NORMAL T4
DISTRIBUTION OF LOW T4 AMONG VARIOUS
NORMAL T4
34 0 34
DISTRIBUTION OF LOW T4 AMONG VARIOUS
TABLE Thyroid dysfunction Normal value T3 T4 TSH X2-12.71
p<0.05(significant)
CHART-12: ANALYSIS OF T3, T4, TSH EXCLUDING
[image:84.595.122.519.463.718.2]0 10 20 30 40 50 60 70 80 90 100 62
TABLE-16: ANALYSIS OF T3, T4, TSH EXCLUDING
HYPOTHYROIDISM
No. of patients with
Normal value Low value
17 29
34 12
46 Nil
12: ANALYSIS OF T3, T4, TSH EXCLUDING
HYPOTHYROIDISM. Normal low high 17 29 0 34 12 0 46 0 0 T3 T4 TSH
EXCLUDING
High value
Nil Nil Nil
63
The TSH values in our study ranged from 0.6-38 micro IU/ml, the mean value being 6.494. Among 50 patients, 46 patients were in the normal range and 4 patients had high value of more than 20 micro IU/ ml. In patients who were in the high range 3 were males and 1 was female.
The all four patients with primary hypothyroidism had creatinine clearance of less than 15 ml/min. It indicates the severity of renal failure in hypothyroid patients.
TABLE – 17 - ANALYSIS OF HYPOTHYROID SYMPTOMS IN CKD
X2-2.04
p>0.05(Not significant)
CHART – 13 - ANALYSIS OF HYPOTHYROID SYMPTOMS IN CKD
Out of 50 patients in our study 34 patients (68%) had the symptoms suggestive of hypothyroidism such as tiredness, weakness, cold intolerance, dry coarse skin, constipation, hoarseness of voice, loss of hair, etc.,
Variants
Low T3
Primary hypothyroidism CKD without thyroid dysfunction
Total
Low T3 Primary hypothyroidism CKD without thyroid
dysfunction
64
ANALYSIS OF HYPOTHYROID SYMPTOMS IN CKD
>0.05(Not significant)
ANALYSIS OF HYPOTHYROID SYMPTOMS IN CKD
Out of 50 patients in our study 34 patients (68%) had the symptoms suggestive of hypothyroidism such as tiredness, weakness, cold intolerance, dry coarse skin, constipation, hoarseness of voice, loss of hair, etc.,
Total No. of
patients
No. of patients
with symptoms
29 19
Primary hypothyroidism 4 4
CKD without thyroid dysfunction 17 11
50 34
0 10 20 30 40 50 Low T3
Primary hypothyroidism CKD without thyroid
dysfunction Total
Percentage
No. of patients with symptoms
Total No. of patients
ANALYSIS OF HYPOTHYROID SYMPTOMS IN CKD
ANALYSIS OF HYPOTHYROID SYMPTOMS IN CKD
Out of 50 patients in our study 34 patients (68%) had the symptoms suggestive of hypothyroidism such as tiredness, weakness, cold intolerance, dry coarse skin, constipation, hoarseness of voice, loss of hair, etc.,
No. of patients
with symptoms
Percentage
65.51% 100% 64.7%
No. of patients with
65
Out of 29 patients who had low T3 syndrome, 19 patients had symptoms suggestive of hypothyroidism accounting for 65.5% and 4 patients among the primary hypothyroidism, all four had symptoms of hypothyroidism which accounts for 100%.
Among 50 patients of CKD, 17 patients did not show any thyroid function abnormalities but out of them 11 had symptoms suggestive of hypothyroidism which accounts for 64.7%.
Features of hypothyroidism such as delayed ankle jerk was present in 2 patients, out of which one were hypothyroid. Papilloedema was found in one patient who is a hypothyroid and goitre was found in one patient who is a hypothyroid. 24 hours urinary protein excretion was < 1g/day in all the patients in our study.
Out of 50 patients in our study, 42 patients had anaemia, out of which 34 patients revealing normocytic normochromic anaemia in peripheral smear study and the remaining 8 patients had microcytic hypochromic anaemia.
TABLE – 18 - ANALYSIS OF THYROID DYSFUNCTION IN THIS
Thyroid dysfunction
Low T3 syndrome
Low T4 syndrome
Hypothyroidism
CHART – 14 - ANALYSIS OF THYROID DYSFUNCTION IN THIS
Among the patients study 58% had low T3 syndrome, 24% had low T4 syndrome and 8% had primary
Low T4 syndrome, 12
66
ANALYSIS OF THYROID DYSFUNCTION IN THIS
STUDY
Thyroid dysfunction No. of patients Percentage
Low T3 syndrome 29 58%
Low T4 syndrome 12 24%
4
ANALYSIS OF THYROID DYSFUNCTION IN THIS
STUDY
Among the patients study 58% had low T3 syndrome, 24% had low T4 syndrome and 8% had primary hypothyroidism
Low T3 syndrome, 29 Low T4 syndrome, 12 Hypothyroidism, 4
ANALYSIS OF THYROID DYSFUNCTION IN THIS
Percentage
58%
24%
8%
ANALYSIS OF THYROID DYSFUNCTION IN THIS
Among the patients study 58% had low T3 syndrome, 24% had low T4
0 5 10 15 20 25 30 35
[image:89.595.127.488.434.658.2]Less than 15
TABLE-19: DISTRIBUTION OF CREATININE CLEARANCE IN
PATIENTS WITH LOW T3 SYNDROME.
Creatinine clearance (ml/minute)
Less than 15 15 – 30 More than 30 X2-0.279
p>0.05(Not significant)
CHART-15: DISTRIBUTION OF CREATININE CLEARANCE IN
PATIENTS WITH LOW T3 SYNDROME.
Creatinine clearance were found to be less than 15 ml/minute in 20 patients of low T3 syndrome, 15
ml/minute in 1 patient.
67
15 – 30 More than 30
Total no. of patients
Patients with low T3 syndrome
: DISTRIBUTION OF CREATININE CLEARANCE IN
PATIENTS WITH LOW T3 SYNDROME.
Creatinine clearance Total no. of patients
Patients with low T3 syndrome
33 20
15 8
2 1
(Not significant)
15: DISTRIBUTION OF CREATININE CLEARANCE IN
PATIENTS WITH LOW T3 SYNDROME.
Creatinine clearance were found to be less than 15 ml/minute in 20 patients of low T3 syndrome, 15 – 30 ml/minute in 8 patients
ml/minute in 1 patient.
Total no. of patients
Patients with low T3 syndrome
: DISTRIBUTION OF CREATININE CLEARANCE IN
PATIENTS WITH LOW T3 SYNDROME.
Patients with low
Percentage
60.60% 53.33% 50%
15: DISTRIBUTION OF CREATININE CLEARANCE IN
PATIENTS WITH LOW T3 SYNDROME.