2
About the author
Jon Andrews is Director for School System and Performance and Deputy Head of Research at the Education Policy Institute. Prior to this, Jon worked in the Department for Education from 2003 to 2016. Jon is the principal author of EPI’s ‘The Performance of Local Authorities and Multi Academy Trusts’ report and has co-authored reports on grammar and faith schools, school funding, the disadvantage gap, and world class standards.
Tom Lawrence is Senior Researcher in School Funding at the Education Policy Institute. Prior to this, Tom worked in local government policy on a freelance basis, for LGIU, APSE and LG Futures. His outputs have included briefings, guides, articles, training sessions and spreadsheets used for benchmarking reports. He has also held posts at London Councils and LB Lewisham.
About the Education Policy Institute
The Education Policy Institute is an independent, impartial, and evidence-based research institute that promotes high quality education outcomes, regardless of social background. We achieve this through data-led analysis, innovative research and high-profile events.
Education can have a transformative effect on the life chances of young people, enabling them to fulfil their potential, have successful careers, and grasp opportunities. As well as having a positive impact on the individual, good quality education and child wellbeing also promotes economic productivity and a cohesive society.
Through our research, we provide insight, commentary, and a constructive critique of education policy in England – shedding light on what is working and where further progress needs to be made. Our research and analysis spans a young person's journey from the early years through to entry to the labour market.
Our core research areas include:
Benchmarking English Education
School Performance, Admissions, and Capacity
Early Years Development
Vulnerable Learners and Social Mobility
Accountability, Assessment, and Inspection
Curriculum and Qualifications
Teacher Supply and Quality
Education Funding
Higher Education, Further Education, and Skills
Our experienced and dedicated team works closely with academics, think tanks, and other research foundations and charities to shape the policy agenda
ISBN: 978-1-909274-54-9
3
Contents
Foreword ... 4
Summary ... 5
Background ... 7
The funding landscape ... 7
Technical information ... 10
Part 1: Expenditure on staff ... 13
Part 2: Pay pressures and the schools block ... 16
Part 3: Trends in school balances ... 18
Local authority maintained primary schools ... 18
Local authority maintained secondary schools... 21
Academies ... 24
Part 4: Use of balances to absorb unfunded cost pressures ... 25
Part 5: How cost pressures may be managed ... 28
4
Foreword
The Education Policy Institute is an independent, impartial and evidence-based research institute which aims to promote high quality education outcomes for all, through analysis that both informs and influences the policy debate in England and internationally.
This report looks at recent trends in school funding and school deficits – following up on EPI research last year on the implications of the National Funding Formula for schools and changes in real per pupil spending.
Deficit statistics used in this report are those for local authority maintained primary and secondary schools, because the information for academies is currently not publicly available. However, we intend to look more closely at information for academies in the future, as data becomes available. It is clear from this report and other recent analysis that after a period of significant real rises in school funding under the Blair and Brown governments (from 1997-2010), and protected real budgets under the 2010-2015 Coalition, we are presently in a period where in many schools, annual budget changes are not keeping pace with inflationary pressures. A majority of both primary and secondary maintained schools spent more than they received in income in 2016-17. This would not automatically be a cause for worry – for many years schools built up large reserve balances.
However, what is of greater concern is that some schools have been running such deficits for a number of years – and there has been a significant rise in the number of schools running overall deficits. The move into deficit is particularly notable for maintained secondary schools.
The impact of the funding squeeze being felt by many schools depends on the extent to which efficiency savings can be found, without impacting on the quality of education services being
delivered. Our analysis suggests that schools may struggle to deliver the cost savings needed without making reductions in staffing – if correct, this means that there needs to be close scrutiny on how such staffing reductions are made and whether they can be delivered without an impact on standards.
As ever, we welcome comments on this report, and this will help inform our future work.
Rt. Hon. David Laws
5
Summary
This report looks at the financial sustainability of school budgets. It provides analysis of trends in school balances and cost pressures facing schools.1
For local authority maintained schools, we have a time series of seven years of publicly accessible data on their balances.2 This includes data for 13,404 local authority maintained primary schools and 1,136 local authority maintained secondary schools.3
Our analysis shows that:
The number of local authority maintained secondary schools in deficit reduced from 14.3 per cent in 2010-11 to 8.8 per cent in 2013-14. However, over the four years up to the end of the last financial year, the proportion of local authority maintained secondary schools in deficit nearly trebled – from 8.8 per cent in 2013-14 to 26.1 per cent in 2016-17. The average local authority maintained secondary school deficit rose over this seven year period, from £292,822 in 2010-11 to £374,990 in 2016-17.
The region with the highest percentage of local authority maintained secondary schools in deficit was the South West, with 22.1 per cent of schools in deficit in 2010-11, rising to 34.9 per cent in 2016-17. The region with the lowest percentage throughout the period was the East of England, with 7.5 per cent of schools in deficit in 2010-11, rising to 17.5 per cent in 2016-17.
Over two-thirds of local authority maintained secondary schools spent more than their income in 2016-17, while 40 per cent had done so for at least two years.
The number of local authority maintained primary schools in deficit has also risen. In 2010-11, 5.2 per cent of local authority primary schools were in deficit – this reduced in the following year to 3.7 per cent, before staying at a level of around 4 per cent until 2015-16. However, in 2016-17, the proportion of primary schools in deficit increased significantly, to 7.1 per cent. The average primary school deficit also noticeably increased, from £72,042 in 2010-11, to £107,962 in 2016-17.
The regions with the highest percentage of local authority maintained primary schools in deficit in 2016-17 were the North East (10.1 per cent), London (8.6 per cent) and Yorkshire and the Humber (8.4 per cent). The region with the lowest percentage throughout the period was the East of England, with 2.6 per cent of schools in deficit in 2010-11, rising to 3.4 per cent in 2016-17.
The proportion of local authority maintained primary schools which have spent more than their income rose significantly in 2016-17, to over 60 per cent. A quarter had a falling balance for two years or more.
As around two-thirds of school spending is on education staff, the annual pay settlement represents a major cost pressure for schools. We consider the extent to which this pressure could be met by
1 Note that these figures differ from published statistics on school balances as we restrict analysis in each year
to those schools that had a published balance figure in every year.
2 This data is not publicly available for academies, but we cite analysis on this by the National Audit Office from
2016.
3 In January 2017 there were a total of 16,786 state-funded primary schools and 1,136 state-funded secondary
6
planned increases in the schools block of the Dedicated Schools Grant (DSG), for both local authority maintained schools and academies (in other words, across all state-funded mainstream schools). We find that around 2 in 5 state-funded mainstream schools (around 7,500 schools) are unlikely to receive sufficient additional funding in 2018-19 to meet the single cost pressure of a 1 per cent pay settlement.4 This rises to nearly half in 2019-20 (close to 9,000 schools). This is despite the
announcement of extra funding in July 2017.5
Finally, we combine these two analyses. We look at the effect on local authority maintained school balances if:
the only changes in expenditure between 2017-18 and 2019-20 were those due to pay settlements;
the only changes in income over this period arose from the notional allocations for the NFF for schools.
We find that, even if schools maintained their balances between 2016-17 and 2017-18:
with a 1 per cent pay settlement each year, 253 local authority maintained primary and secondary schools which are currently in surplus would be pushed into deficit;
with a 2 per cent award in 2019-20, this number would rise to 454;6
466 local authority maintained primary and secondary which are already in deficit would be pushed further into deficit in 2018-19 alone.
Expecting schools to meet the cost of annual pay increases from a combination of core
government funding and their reserves does not, for many schools, look feasible even in the short term. So far schools have taken various measures to reduce costs, such as switching suppliers, reducing energy usage and reducing the size of leadership teams.7 However, as around two-thirds of school spending is on education staff, schools are unlikely to be able to achieve the scale of savings necessary without also cutting staff.
4 This includes both academies and local authority maintained schools. We have excluded new and growing
schools and those with incomplete data. Our analysis is therefore based on 92 per cent of all mainstream schools.
5 Department for Education, ‘Justine Greening statement to parliament on school funding’, July 2017
https://www.gov.uk/government/speeches/justine-greening-statement-to-parliament-on-school-funding
6 In reality, pay awards will be made in September 2018 and September 2019. We have made the simplifying
assumption of a 1 per cent increase in April 2019 as explained below.
7 National Audit Office, ‘Financial sustainability in schools’, December 2016
7
Background
Schools funding continues to play a prominent role in the debate over improving educational standards. During the 2017 General Election campaign, it rose from being the fifth most important issue for voters to the third.8,9 Teaching unions and parents’ organisations have raised concerns about ‘underfunding’, while others have argued that the overall quantum of funding is sufficient, but that schools need to spend money more efficiently. 10,11
The debate is further muddied by the opaqueness of the current funding system and the scale of the forthcoming changes as described in our publications, ‘The implications of the National Funding
Formula for schools’ and, ‘Where next on school funding and the National Funding Formula for schools’.12,13
It is too simplistic to suggest that schools are either facing hardship simply as a result of grant cuts or that proposed funding levels are perfectly adequate. In reality, there is a complex interplay between government funding, budget pressures and school balances.
The funding landscape
The long-term picture of school funding was examined in a 2016 report by the Institute for Fiscal Studies (IFS) that looked at state spending per pupil in real terms from 1978 onwards.14 The report found that spending rose for both primary and secondary pupils for most of the period from 1980-81 to 2009-10, with a particularly rapid rise in the early 2000s.
Between 2011-12 and 2015-16, secondary school spending per pupil rose broadly in line with Gross Domestic Product (GDP), while the 5 per cent real-terms rise for primary schools over this period was largely down to the additional £8.5bn invested in the Pupil Premium. However, the intention of the Pupil Premium was to allocate additional funding to disadvantaged pupils, not to supplement the core funding for schools.
The Dedicated Schools Grant (DSG) is the main grant allocated to schools from the government. The current method of distribution is opaque and based on historical data (for example, the amount allocated to each local authority has not kept pace with changes to demographics).
8 Ipsos Mori, ‘Brexit and NHS are the joint top issue for Britons’, May 2017
https://www.ipsos.com/ipsos-mori/en-uk/brexit-and-nhs-are-joint-top-issue-britons
9 Ipsos Mori, ‘Ipsos MORI May Issues Index: Sharp rises in concern about the NHS and education’, May 2017
https://www.ipsos.com/ipsos-mori/en-uk/ipsos-mori-may-issues-index-sharp-rises-concern-about-nhs-and-education
10 National Education Union, ’17,942 Schools face budget cuts say education unions’, December 2017
https://neu.org.uk/latest/17942-schools-face-budget-cuts-say-education-unions
11 The Times, ‘Schools cry wolf when claiming they are underfunded’, November 2017
https://www.thetimes.co.uk/article/schools-cry-wolf-when-claiming-they-are-underfunded-9vt55dmll
12 N. Perera et al, ‘Implications of the National Funding Formula for schools’, March 2017
https://epi.org.uk/publications-and-research/implications-national-funding-formula-schools/
13 P. Sellen & N. Perera ‘Where next on school funding and the National Funding Formula?’, July 2017
https://epi.org.uk/publications-and-research/research-note-next-school-funding-national-funding-formula/
14 C. Belfield & L. Sibieta, Long run trends in school spending in England, April 2016
8
Since 2013-14, the DSG has been split into three notional blocks - schools, high needs and early years. The government consulted on reforming all of these, with a consultation on the principles of a new National Funding Formula (NFF) for schools published in March 2016.15 It launched a second stage consultation in December 2016, which included indicative allocations at both local authority and school levels.16 The proposals included a floor which would have ensured that no school lost more than 3 per cent per pupil in cash terms, at least until 2019-20.
The Education Policy Institute carried out an analysis of these proposals and published its findings in a report in March 2017.17 This analysed the pattern of winners and losers from the policy amongst primary and secondary schools. It also looked at the impact of inflation, and found that once this and other cost pressures are taken into account, “all schools in England are likely to see real terms cuts in
funding per pupil over the next 3 years”.
Subsequent analysis found that “in order to address the inflation pressures faced by schools, the
government would need to allocate an additional £1.3bn in the schools budget by 2021-22, over and above the £4bn commitment made in the Conservative manifesto”.18
The government announced that it would allocate an extra £1.3bn, but rather than an annual amount in the schools budget by 2021-22 as needed to meet pressures, this would be “£1.3 billion
for schools and high needs across 2018-19 and 2019-20 in addition to the schools budget set at spending review 2015”.19
In September 2017 the government published its response to the consultation, including revised allocations which took into account the additional funding.20 These proposals contained a complex set of interacting transitional protections, including a floor mechanism ensuring an increase of at least 0.5 per cent per pupil in 2018-19 and 0.5 per cent per pupil in 2019-20 in cash terms. However, in the absence of legislation removing the role of local authorities in school funding, the allocations received by schools will still be set by local funding formulae. This means that there is no guarantee that individual schools would receive the additional 0.5 per cent, per pupil. Indeed, schools could still lose up to 1.5 per cent per pupil as a result of local formulae.
Even if we assumed every school received its notional allocation as contained in the September release, these increases are, in the main, too small to meet the cost pressures they face. This is at a time when budgets are already under pressure and balances are falling.
15 Department for Education, ‘Schools national funding formula Government consultation – stage one’, March
2016
https://consult.education.gov.uk/funding-policy-unit/schools-national-funding-formula/
16 Department for Education, ‘Schools national funding formula Government consultation – stage 2’, December
2016
https://consult.education.gov.uk/funding-policy-unit/schools-national-funding-formula2/
17 See footnote 12. 18 See footnote 13.
19Department for Education, ‘Justine Greening statement to parliament on school funding’, July 2017
https://www.gov.uk/government/speeches/justine-greening-statement-to-parliament-on-school-funding
20 Department for Education, ‘National funding formula tables for schools and high needs’, September 2017
9
These cost pressures were highlighted in a report by the National Audit Office (NAO) in 2016.21 It considered the pressures facing schools between 2016-17 and 2019-20. The report stated that the Department for Education (DfE) was estimating a total cost pressure of 3.4 per cent on schools in 2016-17, with the cumulative total rising to 8.7 per cent by 2019-20. This latter figure was composed of:
4.4 per cent from the annual pay award and salary increases;
1.8 per cent from National Insurance;22
1.6 per cent from inflationary pressures on non-staff spending;
0.4 per cent from expenditure on the teachers’ pension scheme;23 and 0.4 per cent from the Apprenticeship Levy.
The report also looked at balances – the extent to which schools have built up surpluses or deficits. For local authority maintained schools, it found that, “in general, the financial health of primary
schools has remained relatively unchanged from 2010-11 to 2014-15 but an increasing proportion of secondary schools may be struggling financially”.
For single academy trusts, it found that:
the proportion of primary single academy trusts in deficit decreased from 3.2 per cent (seven trusts) in 2011/12 to 1.6 per cent (13 trusts) in 2014/15 and for those in deficit, the average deficit fell in real terms from £58,000 to £48,000; and
the proportion of secondary single academy trusts in deficit increased from 3.2 per cent (25 trusts) to 6.1 per cent (74 trusts) over the same period, although the average deficit fell from £350,000 to £238,000.
In February 2018, DfE published a paper which partially updated some of the analysis of cost pressures in the NAO report.24 It looked at:
inflationary pressures on non-school funding in 2018-19 and 2019-20;
the effect on pay of increases in National Living Wage and National Minimum Wage rates in 2018-19 and 2019-20; and
cost pressures due to the Apprenticeship Levy in 2017-18 (in an annex to the paper). Some cost pressures were either estimated to be zero for 2018-19 and 2019-20 or were explicitly excluded from the analysis, for the following reasons:
pay awards (subject to future consideration and negotiation);
national Insurance (no planned changes to NI contributions);
21 National Audit Office, ‘Financial sustainability in schools’, December 2016.
https://www.nao.org.uk/report/financial-sustainability-in-schools/
22 Most of the increase in employer National Insurance Contributions was seen in 2016-17, as a result of the
the reduced rate associated with contracting out ceasing – see Institute for Fiscal Studies, ‘English schools will feel the pinch over the next five years’, October 2015
https://www.ifs.org.uk/publications/8027
23 The scheme that came into force in April 2015 saw an increase in employer pension contributions 24 Department for Education, ‘Schools’ costs: technical note’, February 2018
10
teachers’ pensions (uncertainty about any effects of future variations to employer rates for the Local Government Pension Scheme and Teachers’ Pension Scheme); and
Cost pressures due to the Apprenticeship Levy in 2018-19 and 2019-20 (the levy rate remains constant over the period).
A comprehensive analysis on these issues would need to consider the range of budget pressures, all the various grant streams and the interplay between capital and revenue needs and funding. It would need to take into account the expenditure on schools over time and the consequent impact on cohorts of pupils as they progress through their education.
Technical information
Analysis and data
Within this report we consider three dimensions of school finances:
what schools are currently spending their funding (and income from other sources) on;
the cost pressures caused by annual increases in pay for teaching, supply and support staff; and
trends in school revenue balances and their potential role in meeting pressures. The analysis is derived from four data sources:
detailed school income and expenditure data for local authority maintained mainstream schools through the Consistent Financial Reporting (CFR) returns for the 2016-17 financial year;
detailed school income and expenditure data for mainstream academies through the academies Accounts Returns for the 2015/16 academic year;
school balances for local authority maintained mainstream schools open in the 2016-17 financial year and with reported balances back to 2010-11; and
notional allocations at school level under the National Funding Formula. Coverage
The availability of data and coverage of published data affects the coverage of the analysis that we present here. In summary:
when considering patterns of school expenditure, we present analysis for local authority maintained primary and secondary schools and primary and secondary academies. As the patterns are broadly consistent between these two different school types, in most cases we present our findings for one of these in the main body of the report. Further analysis is then provided in the Annex.
in assessing the extent to which the cost pressures arising from the annual pay settlement exceed additional notional funding from the NFF for schools, we present analysis for both local authority maintained schools and academies in the main text.
11
In all cases, analysis is restricted to those schools that were open for the complete financial – or, in the case of academies, academic – year in question. Therefore, it excludes schools that converted to academy status part way through the year, those schools that closed during the year, and those schools that opened part way through the reporting period.
Methodology for comparison between pay pressures and funding increases
The analysis in this paper includes consideration of whether additional funding through the NFF in 2018-19 and 2019-20 is sufficient to cover pay pressures. For 2018-19, we calculate the additional funding by taking the notional allocations for schools block funding in 2018-19 and subtract the baseline funding for 2017-18. We compare this with the effect of increasing the 2016-17 (for local authority maintained schools) or 2015/16 expenditure (for academies) on education staff by 1 per cent. We use the 1 per cent increase to the 2016-17 or 2015/16 expenditure as this is the latest data - figures for 2016/17 and the current financial year, 2017-18, are not currently available. A more rigorous approach might be to calculate a projected expenditure for 2017-18 and apply the 1 per cent to this. However, this would be subject to further methodological considerations and would be unlikely to have any significant impact on the results – because of this, our approach represents a conservative estimate of this cost pressure.
For 2019-20, we take the indicative allocations for schools block funding and subtract the baseline funding for 2017-18, then compare this with a 2 per cent increase in the 2016-17 or 2015/16 expenditure on education staff.
Note that these notional or indicative allocations may not be what the schools actually receive. Firstly, local authorities will use their own local formula for allocating funding, in consultation with schools in the area. Secondly, the calculations are on the basis of existing pupil numbers. The actual allocations to local authorities will rise (or in some cases fall) with pupil numbers. For academies, the calculations use pupil data taken from the General Annual Grant. This may not be the direct
equivalent of pupil data that will be used for the final allocations. We are assuming that the increase in funding due to changing pupil numbers will be offset by an equal increase in staffing costs. An alternative approach might be to utilise pupil projections and “teacher need” figures from DfE’s Teacher Supply Model.25 However, the assumption that most costs follow pupil numbers is a common one and underlies the NFF for schools.
For this analysis, we use the same schools as for the expenditure analysis with the additional exclusion of the following:
new and growing schools: as DfE points out in the illustrative allocations, "these are schools
that will see a substantial pupil number change so illustrating funding based on the 2017-18 pupil count will not be meaningful";
schools for which DfE have not provided projected allocations for funding in 2018-19 and 2019-20; and
schools for which total expenditure on areas other than teaching, support and supply staff is recorded as zero.
25 Department for Education, ‘Teacher supply model: 2017 to 2018’, May 2017
12
13
Part 1: Expenditure on staff
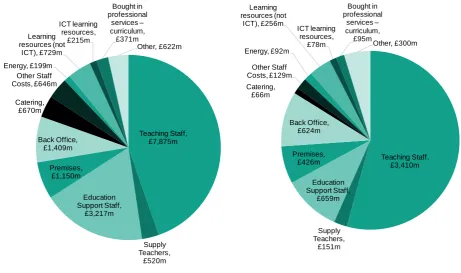
[image:13.595.60.522.228.501.2]Expenditure on teaching staff is the single biggest cost for local authority maintained schools, as shown in Figure 1. The patterns are similar for academies.26 For secondary schools, teaching staff account for more than half of school revenue expenditure across England. Primary schools tend to make greater use of support staff, but if expenditure on them and supply teachers is added in, this accounts for about two thirds of expenditure for both primary and secondary schools.
Figure 1: Breakdown of total England school expenditure, 2016-17 – local authority maintained primary schools (left) and local authority maintained secondary schools (right)
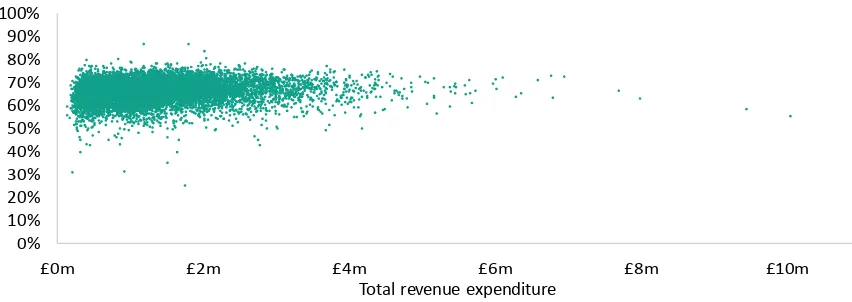
Naturally, the exact proportions vary between schools. Figures 2 and 3 show how the proportion of spending on teaching staff, supply staff and education support staff – referred to collectively as “education staff” elsewhere in this analysis – varied between local authority maintained primary and secondary schools, plotted against their overall expenditure.27
26 See Annex.
27The charts are based on CFR data for the financial year 2016-17 (which does not include data for schools that
opened or closed during the year, for example to become an academy). We have included all-through schools with the secondary schools.
Teaching Staff, £7,875m Supply Teachers, £520m Education Support Staff, £3,217m Premises, £1,150m Back Office, £1,409m Catering, £670m Other Staff Costs, £646m Energy, £199m Learning resources (not ICT), £729m ICT learning resources, £215m Bought in professional services – curriculum, £371m Other, £622m Teaching Staff, £3,410m Supply Teachers, £151m Education Support Staff, £659m Premises, £426m Back Office, £624m Catering, £66m Other Staff Costs, £129m Energy, £92m Learning resources (not ICT), £256m ICT learning resources, £78m Bought in professional
services – curriculum,
£95m
14
Figure 2: Total teaching, supply and support staff as percentage of total revenue expenditure – local authority maintained primary schools 2016-17
Figure 3: Total teaching, supply and support staff as percentage of total revenue expenditure – local authority maintained secondary schools 2016-17
For schools in single-academy trusts and multi-academy trusts, the patterns are similar.28
These charts show no obvious relation between the proportion of funding spent on education staff costs and the total revenue expenditure. This suggests that larger schools (or more precisely, higher-spending schools) are not achieving (or are unable to achieve) economies of scale in relation to non-staffing costs.
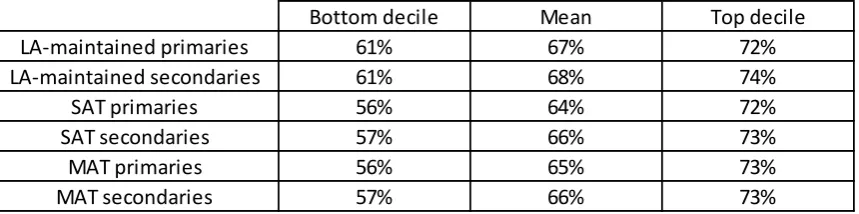
Moreover, apart from a relatively small number of outliers, the variation in this proportion is fairly limited. For example, only 10 per cent of local authority maintained primary schools spend less than 61 per cent and only 10 per cent spend more than 72 per cent of their revenue expenditure on education staff. Comparable figures for the other types of school are given in Figure 4 below.29
28 See Annex.
29For schools in single-academy trusts, we have excluded four individual schools (one primary and three
secondary) for which either teaching staff expenditure or total revenue expenditure has been recorded as zero or negative, or (in one case) the learning resources expenditure data appears to have been incorrectly
recorded. For schools in multi-academy trusts, we have excluded 12 individual schools (seven primary and five secondary) for which either teaching staff expenditure or total revenue expenditure has been recorded as zero
0% 10% 20% 30% 40% 50% 60% 70% 80% 90% 100%
£0m £2m £4m £6m £8m £10m
Total revenue expenditure
Total teaching, supply and support staff as % of total expenditure
0% 10% 20% 30% 40% 50% 60% 70% 80% 90% 100%
£0m £2m £4m £6m £8m £10m £12m £14m
Total revenue expenditure
[image:14.595.75.520.304.458.2]15
Figure 4: Proportion of revenue expenditure on education staff by school type
or negative. We have carried out no other verification of the underlying data. For both, we have only considered schools which provided a return covering the full academic year.
56% 64% 72%
74% 68%
Bottom decile Mean Top decile
67% 72%
LA-maintained primaries LA-maintained secondaries
SAT primaries SAT secondaries
61% 57% 61%
66% 73%
MAT secondaries
56% 65% 73%
MAT primaries
16
Part 2: Pay pressures and the schools block
Given that expenditure on staff is such a large proportion of total spend for the overwhelming majority of schools, pay rises can add considerably to costs. We consider just one element of pay pressures, namely the 1 per cent annual pay settlement. We compare the impact of a 1 per cent rise in education staff costs to the increase in notional school funding under the indicative NFF
allocations.30
The annual pay awards are made at the start of the school year in September. These are determined by the government, following recommendations from the School Teachers Review Body (STRB). School staff pay was subject to a 1 per cent annual pay cap from 2011. The latest increment, applied in September 2017, was based on the STRB report in July 2017. 31 This again recommended a 1 per cent basic increase; however, there would also be “a 2 per cent uplift to the minimum and maximum
of the main pay range (MPR)” which would affect the pay of some staff. The government accepted
these recommendations.
The increment for September 2018 will not be known until after the government has considered the next STRB report. For most of the analysis presented here, we consider the impact of a 1 per cent annual increment continuing. However, there are signs that the pay award could be higher in future years. For example, the July 2017 STRB report stated that:
“Economic uncertainty means that it is difficult to predict the future state of the labour market. However, we consider it likely that further uplifts of more than 1 per cent will be required to elements of the pay framework in the coming years to make pay more competitive for teachers at all stages of their careers”.
The remit for the STRB’s 2018 report was set out in a letter from the Secretary of State in December 2017.32 It states that
“.. the government has adopted a more flexible approach to public sector pay, to address any areas of skills shortages and in return for improvements to public sector productivity.”
Our assumption of 1 per cent for this cost pressure in each of 2018-19 and 2019-20 therefore represents a conservative estimate. Indeed, there may additionally be pressures on schools budgets resulting from pay progression. We also have not sought to take into account the pressures caused by increases in the National Living Wage and the National Minimum Wage rates.
A full explanation of the methodology we have used can be found above in the section “Technical information”.
30 See ‘Background – technical information’ for further details of this calculation. 31 School Teachers Review Body, ‘School Teachers Review Body 27th report’, July 2017
https://www.gov.uk/government/publications/school-teachers-review-body-27th-report-2017
32 Department for Education, ‘School Teachers Review Body (STRB) remit letter for 2018)’, December 2017
17
For local authority maintained schools, we find that of the schools included in the analysis, 5,811 schools, or 42 per cent, would have cost increases from this one factor which exceed their notional additional funding in 2018-19. For 2019-20, this rises to 6,687 schools, or 48 per cent.
For schools in single-academy trusts included in the analysis, 654 schools, or 36 per cent, would have cost increases from this one factor which exceed their notional additional funding in 2018-19, under our assumptions. For 2019-20, this rises to 774 schools, or 43 per cent.
For schools in multi-academy trusts, 1150 schools, or 40 per cent, would have cost increases from this one factor which exceed their notional additional funding in 2018-19. For 2019-20, this rises to 1319 schools, or 46 per cent.
This means on our assumptions, a total of 7,615 state-funded mainstream schools, or 41%, would not receive sufficient additional funding in 2018-19 to meet the single cost pressure of a 1 per cent pay settlement. This rises to 8,780 schools in 2019-20, or 47%.
18
Part 3: Trends in school balances
Schools may carry over a balance – deficit or surplus – on their accounts from one year to the next, taking into account what is prudent given expected future circumstances. 33 From an analysis of these figures alone, we cannot accurately deduce the reasoning they have used in their financial planning – this would need to be supplemented by taking evidence from schools. However, it can give a picture of schools’ ability to absorb cost pressures.
Data on the balances of local authority maintained schools over the period from the financial year 2010-11 until 2016-17 is publicly accessible from the DfE website. Therefore, we examine school balances over a seven-year period. We consider only those which provided figures throughout this period - it therefore excludes schools which became academies before April 2017.
Local authority maintained primary schools
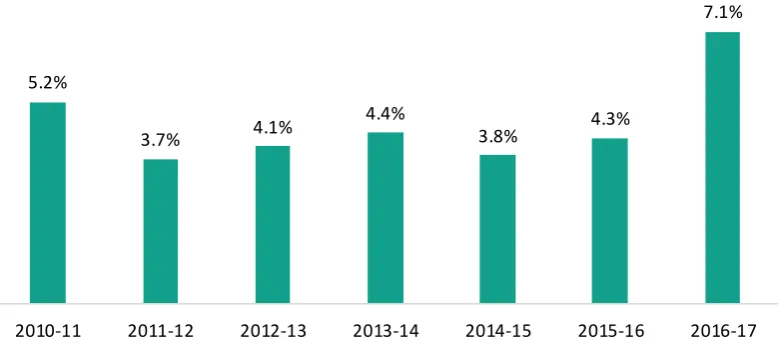
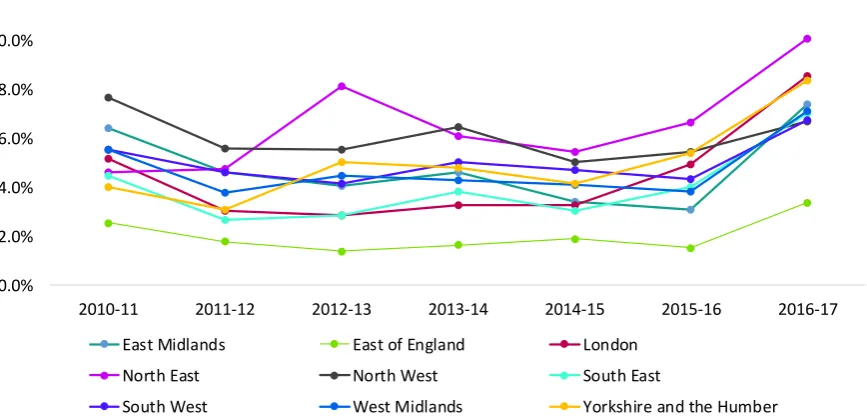
[image:18.595.87.478.386.560.2]There are 13,404 local authority maintained primary schools with data. In 2010-11, 5.2 per cent of these were in deficit as shown in Figure 5. This reduced in the following year to 3.7 per cent and then stayed at a level of around 4 per cent until 2015-16. However, in 2016-17, the proportion of local authority maintained primary schools in deficit increased significantly, to 7.1 per cent.
Figure 5: Percentage of local authority maintained primary schools in deficit
Figure 6 shows this broken down at regional level.34 Throughout the period, the region with the lowest percentage of schools in deficit has been the East of England, with 2.6 per cent of schools in deficit in 2010-11, rising to 3.4 per cent in 2016-17. The regions with the highest percentage in deficit have varied over the period. In 2010-11, these were the North West, at 7.7 per cent, followed by East Midlands, at 6.4 per cent. By 2016-17, three regions had more than 8 per cent of their maintained primary schools in deficit: the North East (10.1 per cent), London (8.6 per cent) and Yorkshire and the Humber (8.4 per cent).
33Some local authority maintained schools have their own bank accounts, while for others the banking is
carried out by the local authority, which maintains the ‘prime accounting records for the school’. LA
maintained schools operate within a regulatory structure which includes accountability to the local authority on financial matters. Academy trusts manage their own bank accounts.
34 This data is also presented in a table in the Annex.
5.2%
3.7% 4.1%
4.4%
3.8% 4.3%
7.1%
19
Figure 6: Percentage of local authority maintained primary schools in deficit, by region
The average deficit amongst local authority maintained primary schools also increased over the observed period, from £72,042 to £107,962 (in cash terms – no adjustment made for inflation). There has been a widening in the variation between schools over this period, as shown in Figure 7. Each box represents the range between the lowest quartile of schools and the highest quartile, i.e. the middle 50 per cent of schools. The horizontal line in the middle of each box shows the median balance. In 2010-11, a quarter of local authority maintained primary schools (including all of those in deficit) had a balance below £27,594, while a quarter had a balance above £86,626. By 2016-17, the bottom quartile had not changed much, now lying at £31,527. However, the top quartile had increased significantly – a quarter of schools now had a surplus of over £127,630 (again, all figures are in cash terms).
Figure 7: Local authority maintained primary school balances – middle 50 per cent of schools
Perhaps more important to a school’s ongoing financial health is whether their balances are rising or falling over time – whether they are maintaining a prudent surplus or whether this is reducing year
0.0% 2.0% 4.0% 6.0% 8.0% 10.0% 12.0%
2010-11 2011-12 2012-13 2013-14 2014-15 2015-16 2016-17
East Midlands East of England London
North East North West South East
South West West Midlands Yorkshire and the Humber
top quartile
[image:19.595.74.511.508.718.2]20
by year. In Figure 8 we examine for how many years primary school balances have been rising or falling.
[image:20.595.83.462.204.509.2]For most local authority maintained primary schools, the balance in 2016-17 had fallen from the previous year: only 39 per cent had had a rising balance for 1 year or more, while another 36 per cent had seen their balance fall (or stay constant), but only for one year. The remainder, 25 per cent, had experienced a falling balance for at least two years – that is, they had spent more than their income in each of the least two years.
Figure 8: Trends in local authority maintained primary school balances
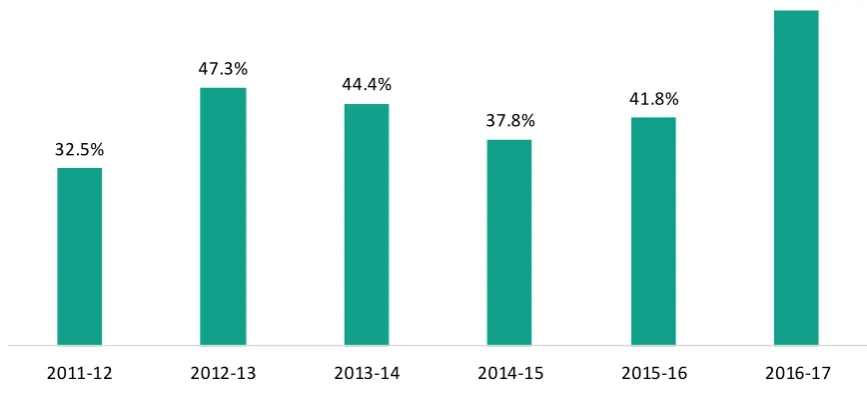
By considering the changes in the balances from one year to the next, we can find the percentage of schools spending more than their income for each year from 2011-12 onwards. Figure 9 shows that for local authority maintained primary schools, for most of this period, this percentage has varied between 32.5 per cent and 47.3 per cent. However, in 2016-17, the percentage of local authority maintained primary schools spending more than their income rose significantly to 61.4 per cent.
1.6% 1.0% 3.4% 6.5%
9.5% 16.5%
36.2%
17.2%
5.1% 2.0%
21
Figure 9: Percentage of local authority maintained primary schools spending more than their income
Local authority maintained secondary schools
The position for local authority maintained secondary schools looks more precarious.
[image:21.595.86.456.492.665.2]There are 1,136 secondary schools which provided figures throughout the period. The proportion in deficit reduced gradually from 14.3 per cent in 2010-11 down to 8.8 per cent in 2013-14, as shown in Figure 10. However, over the four years up to the end of the last financial year, 2016-17, the proportion of local authority maintained secondary schools in deficit nearly trebled, rising to 26.1 per cent.
Figure 10: Percentage of local authority maintained secondary schools in deficit
It is unclear why the proportion of local authority maintained secondary schools in deficit is higher for secondary schools than for primary schools. The above charts show that this is the case
throughout the period, so there may be historical reasons behind this. However, the rise in this percentage has also been faster in recent years for secondary schools. This may be a result of some cost categories rising faster for secondary schools than for primary schools – for example,
expenditure by local authority maintained secondary schools on energy rose by 17 per cent between 32.5%
47.3%
44.4%
37.8%
41.8%
61.4%
2011-12 2012-13 2013-14 2014-15 2015-16 2016-17
14.3%
11.1%
9.1% 8.8%
13.9%
17.6%
26.1%
22
2015-16 and 2016-17, whereas the increase for local authority maintained primary schools was lower at 5 per cent.
Another potential explanation we have considered is whether staffing levels in secondary schools have increased in response to rising pupil numbers, while remaining relatively steady in primary schools. If this were the case, one would expect class sizes to have risen in primary schools, but not in secondary schools. Department for Education statistics show that average class sizes in primary schools did increase over the period – from 26.6 in January 2011 to 27.1 in January 2017.35 However, there was a similar increase in secondary schools (from 20.4 to 20.8) over the same period.
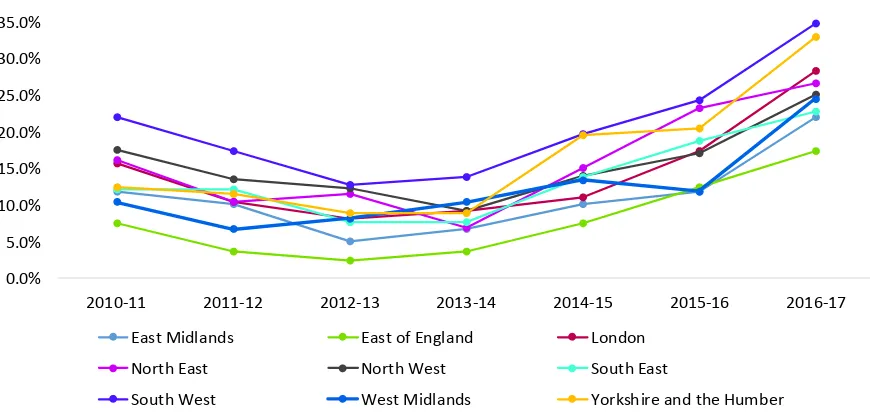
[image:22.595.79.514.342.550.2]A regional breakdown of the percentages of schools in deficit is given below in Figure 11.36 Again, the region with the lowest percentage of schools in deficit throughout the period has been the East of England, with 7.5 per cent of schools in deficit in 2010-11, rising to 17.5 per cent in 2016-17. The region with the highest percentage in deficit throughout the period has been the South West, with 22.1 per cent of schools in deficit in 2010-11, rising to 34.9 per cent in 2016-17. In six out of ten regions, at least a quarter of local authority maintained secondary schools were in deficit in 2016-17. Figure 11: Percentage of local authority maintained secondary schools in deficit, by region
The average local authority maintained secondary school deficit also rose over the period, from £292,822 to £374,990. Again, the interquartile range of balances has widened over this period, although less markedly than for primary schools, as shown in Figure 12. In 2010-11, a quarter of schools (including all of those in deficit) had a balance below £67,483, while a quarter had a surplus of over £344,794. Over the period, the bottom quartile and the top quartile both rose then fell again. At the end of the period, in 2016-17, a quarter of schools had a surplus of over £369,544, while a quarter had a deficit of over £9,689. (All figures in cash terms.)
35 Department for Education, ‘Schools, pupils and their characteristics: January 2017’, June 2017
https://www.gov.uk/government/statistics/schools-pupils-and-their-characteristics-january-2017
36 It is also presented in a table in the Annex. 0.0%
5.0% 10.0% 15.0% 20.0% 25.0% 30.0% 35.0% 40.0%
2010-11 2011-12 2012-13 2013-14 2014-15 2015-16 2016-17
East Midlands East of England London
North East North West South East
23
Figure 12: Local authority maintained secondary school balances – middle 50 per cent of schools
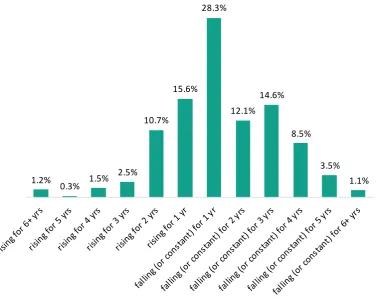
[image:23.595.98.476.395.694.2]Less than a third of secondary schools have had a rising balance for 1 year or more. Twenty-eight per cent had seen their balance fall (or stay constant) but only for one year, while 40 per cent had experienced a falling balance for at least two years (Figure 13).
Figure 13: Trends in local authority maintained secondary school balances
Again, in 2016-17, the percentage of schools spending more than their income was the highest in the period from 2011-12, slightly exceeding its previous peak in 2014-15. More than two thirds of local authority maintained secondary schools spent more than their income in 2016-17, as shown in Figure 14.
top quartile
median
bottom quartile
1.2%
0.3% 1.5% 2.5%
10.7% 15.6%
28.3%
12.1% 14.6%
8.5%
24
Figure 14: Percentage of local authority maintained secondary schools spending more than their income
Academies
Data on the balances of academies is not available on the DfE website. However, the NAO report described above has some analysis of academies’ balances over the academic years 2011/12 to 2015/16.
Its main findings include:
the proportion of primary single academy trusts in deficit decreased from 3.2 per cent (seven trusts) in 2011/12 to 1.6 per cent (13 trusts) in 2014/15. In contrast, the proportion of secondary single academy trusts in deficit increased from 3.2 per cent (25 trusts) to 6.1 per cent (74 trusts) over the same period;
for those single academy trusts in deficit, the average deficit fell in real terms from £58,000 to £48,000 for primary academy trusts, and from £350,000 to £238,000 for secondary academy trusts; and
the proportion of primary academies spending more than their income rose from 32.1 per cent in 2012/13 to 44.1 per cent in 2014/15; and of secondary academies spending more than their income from 38.8 per cent to 60.6 per cent.
It is difficult to make direct comparisons between the two analyses since the NAO results are a snapshot in a particular year rather than examining the same schools over a period of time. In the earliest years this was based on a small number of trusts. Also, the academies data ends at a point before we saw the largest rises in the proportions of local authority maintained schools that were in deficit or had expenditure that exceeded income.
However, it would appear that academies are also seeing an increase in the propensity to have expenditure that exceeded income. Secondary academies also saw an increase in the propensity to be in deficit (though this was still relatively low.) Further analysis is required of more recent data to explore fully whether academies are seeing the same pattern of results as local authority maintained schools.
30.3%
37.9%
49.0%
65.8%
55.5%
68.3%
25
Part 4: Use of balances to absorb unfunded cost pressures
For schools which do not have sufficient additional funding in 2018-19 to cover the 1 per cent pay settlement, we now ask whether they can cover the shortfall from their balances and for how long. To consider whether this is a reasonable proposition, we combine the analysis on balances with that on cost pressures.
In this section, we focus on schools which:
have data on balances throughout the period;
have provided data on expenditure on teaching, support and supply staff;
are not growing schools (those schools that are filling up from lower year groups); and
have insufficient additional notional funding to meet the 1 per cent increase in spending on education staff.
[image:25.595.92.477.424.716.2]Again, the available data on balances limits us to looking at local authority maintained schools only. There are 5,348 such primary schools and 406 such secondary schools. The pattern of rising deficits and falling balances described above is very similar for these schools. For example, the proportions of these schools with balances rising and falling for each number of years are similar to those for local authority maintained schools as a whole, as shown in Figures 15 and 16.
Figure 15: Trends in balances of local authority maintained primary schools which will not have enough extra funding in 2018-19 to meet the 1 per cent pay pressure
1.5% 1.0% 3.4% 6.2%
10.4% 17.6%
34.5%
17.4%
5.1% 2.0%
26
Figure 16: Trends in balances of local authority maintained secondary schools which will not have enough extra funding in 2018-19 to meet the 1 per cent pay pressure
Data relating to average balances and average shortfalls for those schools that have seen reductions in their balances for at least the last two years are given in the Annex.
We look at the effect on the balances of these schools if:
the only changes in expenditure between 2017-18 and 2018-19 were those due to pay settlements;
the only changes in income over this period arose from the notional allocations for the NFF for schools.
As expenditure and income data for 2017-18 will not be available until after the end of the current financial year, we make the simplifying assumption that all of these schools’ balances remain constant between 2016-17 and 2017-18. Given the trends in balances described above, this seems a very conservative assumption.
The primary schools can be broken into three groups:
72 schools which are currently in surplus but which would be pushed into deficit in 2018-19;
358 which are already in deficit and would be pushed further into deficit; and
4918 which are in surplus and would see that surplus fall.
For this last group, we consider the impact of the notional allocations for 2019-20 and a further 1 per cent pay award for that year. This would push a further 156 schools into deficit. Therefore, a total of 228 local authority maintained primary schools would be pushed into deficit over the two-year period.
1.2% 0.5% 1.5% 3.2%
9.1% 15.5%
27.1%
11.1% 18.5%
7.6%
3.9%
27
As described above, there are signs that future pay awards could exceed 1 per cent for most teachers. This can be modelled too. A higher settlement could take effect from either September 2018 or September 2019. We make the simplifying assumption that a 2 per cent uplift is applied to all expenditure on education staff from April 2019. Using the notional allocations in the NFF for schools for 2019-20, we find that instead of 156 schools being pushed into deficit, this would rise to 340 schools. The total over the two-year period would then be 41358+2 schools.
Applying the same methodology to the 406 secondary schools,
11 schools are currently in surplus but would be pushed into deficit in 2018-19;
108 are already in deficit and would be pushed further into deficit; and
287 are in surplus and would see that surplus fall.
A further 1 per cent pay award in 2019-20 would push 14 more schools into deficit. Therefore, a total of 25 local authority maintained secondary schools would be pushed into deficit over the two-year period.
A 2 per cent pay award in 2019-20 would push 31 schools into deficit, meaning a total of 42 local authority maintained secondary schools would be pushed into deficit over the two-year period.
This analysis has looked at one cost pressure, but there are many others. These include those quantified in the NAO report, listed above, as well as the following:
rising costs of replacing staff;37
costs of curriculum-related policies, for example changes to GCSEs and A-levels and targets for increasing EBacc subjects;38,39
additional costs resulting from cuts to LA funding, such as providing more support to
vulnerable pupils;40
potential costs of delivering universal infant free school meals, if funding does not keep pace with the rising costs of delivering this policy.41
Expecting schools to meet pressures from a combination of core government funding and their reserves does not, for many schools, look feasible even in the short term.
37 NAHT, ‘The Leaky Pipeline’, November 2017
http://www.naht.org.uk/news-and-opinion/news/pay-and-conditions-news/the-leaky-pipeline/
38 P. Sellen, ‘The challenge of navigating teacher recruitment, pay and curriculum choices’, August 2017
https://epi.org.uk/publications-and-research/analysis-challenge-navigating-teacher-recruitment-pay-curriculum-choices/
39 See evidence from Liam Collins, Q6-7 in Public Accounts Committee, ‘Oral evidence: Financial sustainability of schools, HC 890’, January 2017
http://data.parliament.uk/writtenevidence/committeeevidence.svc/evidencedocument/public-accounts-committee/the-financial-sustainability-of-schools/oral/45997.pdf
40 Public Accounts Committee, ‘Financial sustainability of schools’, March 2018
https://publications.parliament.uk/pa/cm201617/cmselect/cmpubacc/890/89002.htm
41 P. Sellen & H. Huda , ‘Evaluation of Universal Infant Free School Meals’, January 2018
28
Part 5: How cost pressures may be managed
To date, schools have taken various approaches to dealing with cost pressures. The NAO spoke to a small sample of headteachers and found several approaches they had used. They had increased teachers’ contact time, class sizes and the amount of teaching undertaken by senior staff, and reduced supply teacher costs, the size of leadership teams and numbers of teaching assistants. They have also found ways to collaborate with other schools to benefit from economies of scale,
renegotiated contracts, switched suppliers, and reduced use of energy and consumables.42
The schools visited by the NAO stated that to reduce costs in forthcoming years, they are planning to replace more experienced, higher-paid teachers with younger, less expensive recruits, recruit staff on temporary contracts, encourage staff to teach outside of their specialism, and rely more on unqualified staff.
However, there are constraints on using these measures. The government has also said that savings on staffing budgets should not lead to a reduction in quality.43 It also does not want the curriculum limited for financial reasons.44 Other constraints include difficulties recruiting staff, (for which they can be in competition with each other), committed expenditure such as PFI and other contracts, and physical constraints such as classroom sizes and available land.
To help to identify ways schools could handle cost pressures, the government conducted a review of efficiency in 2013.45 This identified seven “characteristics of the most efficient schools” and seven “drivers of efficiency”, and made six proposals to improve efficiency. Several of these revolved round (or included) benchmarking which DfE proposed to develop, in consultation with schools. The
resulting analysis aimed to identify the scope for savings and resulted in estimates for savings from procurement and from workforce deployment. However, the Public Accounts Committee has questioned whether these are achievable, and the extent to which the government has explored this.
The government has also provided guidance, advice and similar resources for schools on good practice in procurement.46 Another approach to increasing efficiency which the government may
42 National Audit Office, ‘Financial sustainability in schools’, December 2016
https://www.nao.org.uk/report/financial-sustainability-in-schools/
43 Department for Education, ‘Educational excellence everywhere’, March 2016
https://www.gov.uk/government/publications/educational-excellence-everywhere
44 See evidence from Jonathan Slater, Q44 in Public Accounts Committee, ‘Oral evidence: Financial sustainability of schools, HC 890’, January 2017
http://data.parliament.uk/writtenevidence/committeeevidence.svc/evidencedocument/public-accounts-committee/the-financial-sustainability-of-schools/oral/45997.pdf
45 Department for Education, ‘Review of efficiency in the schools system’, June 2013
https://www.gov.uk/government/uploads/system/uploads/attachment_data/file/209114/Review_of_efficienc y_in_the_schools_system.pdf
46 Department for Education, ‘School procurement’, live (beta) site
29
continue to promote is for more schools to join MATs. In some circumstances, joining or establishing a MAT may enable schools to find economies of scale.47
The extent to which these resources will help schools to manage forthcoming cost pressures is currently unclear. Both the government and schools will have to draw on all the available research to find the best ways to manage in a very tight financial environment without having an adverse impact on the quality of education.
47 J. Townsley & J. Andrews ,‘The Economic Benefits of Joining, Establishing and Growing a Multi-Academy Trust’, January 2017
30
Annex: Additional breakdowns for academies
This annex presents additional charts, as explained in the main text.
Figures A1.1 and A1.2 show the breakdown of revenue expenditure in schools in single-academy trusts and in multi-academy trusts in 2015/16 by phase. These show very similar proportions to those we found for both local authority maintained primary schools and local authority maintained secondary schools in 2016-17. Just as for local authority maintained schools, primary academies tend to make greater use of support staff, but if expenditure on them and supply teachers is added in, this accounts for about two thirds of expenditure for both primary and secondary academies.
Figures A1.3, A1.4, A1.5 and A1.6 show total expenditure on education staff as a percentage of total revenue expenditure for academies. Again, these show no obvious relation between the proportion of funding spent on education staff costs and the total revenue expenditure and follow a similar pattern to local authority maintained schools.
Figures A1.7 and A1.8 contain tables of the data behind Figures 6 and 11 – the percentages of local authority maintained schools in deficit by region, from 2010-11 to 2016-17.
Figure A1.9 provides further details on the 1,360 primary and 170 secondary local authority maintained schools for which:
balances which have fallen for more than one year; and
whose notional NFF allocations do not cover a 1 per cent rise in education staff spending in 2018-19.
31
Figure A1.1: Breakdown of total England school revenue expenditure, 2015/16 – schools in single-academy trusts – primary (left) and secondary (right)
Figure A1.2: Breakdown of total England school revenue expenditure, 2015/16 – schools in multi-academy trusts – primary (left) and secondary (right)
Teaching Staff, £547m Supply Teachers, £26m Education Support Staff, £202m Premises, £84m Back Office, £125m Catering, £49m Other Staff Costs, £53m Energy, £14m Learning resources (not ICT), £54m ICT learning resources, £10m Bought in professional services – curriculum,
£10m Other, £36m
Teaching Staff, £3,661m Supply Teachers, £131m Education Support Staff, £615m Premises, £453m Back Office, £752m Catering, £78m Other Staff Costs, £162m Energy, £99m Learning resources (not ICT), £357m ICT learning resources, £57m Bought in professional services – curriculum,
£41m Other, £305m
Teaching Staff, £1,275m Supply Teachers, £83m Education Support Staff, £508m Premises, £190m Back Office, £288m Catering, £114m Other Staff Costs, £113m Energy, £33m Learning resources (not ICT), £122m ICT learning resources, £23m Bought in professional
services – curriculum,
£35m Other, £77m
[image:31.595.66.515.412.673.2]32
[image:32.595.78.516.319.464.2]Figure A1.3: Total teaching, supply and support staff as a percentage of total revenue expenditure - SAT primary schools 2015/16 (full year)
Figure A1.4: Total teaching, supply and support staff as a percentage of total revenue expenditure - SAT secondary schools 2015/16 (full year)
Figure A1.5: Total teaching, supply and support staff as a percentage of total revenue expenditure - MAT primary schools 2015/16 (full year)
0% 20% 40% 60% 80% 100% 120%
£0m £2m £4m £6m £8m £10m £12m £14m
Total revenue expenditure
Total teaching, supply and support staff as % of total expenditure
0% 20% 40% 60% 80% 100% 120%
£0m £2m £4m £6m £8m £10m £12m £14m £16m £18m
Total revenue expenditure
Total teaching, supply and support staff as % of total expenditure x
0% 20% 40% 60% 80% 100%
£0m £2m £4m £6m £8m £10m £12m £14m
Total revenue expenditure
[image:32.595.76.515.532.670.2]33
[image:33.595.77.472.295.445.2]Figure A1.6: Total teaching, supply and support staff as a percentage of total revenue expenditure - MAT secondary schools 2015/16 (full year)
Figure A1.7: Percentage of local authority maintained primary schools in deficit, by region
Figure A1.8: Percentage of local authority maintained secondary schools in deficit, by region 0%
20% 40% 60% 80% 100%
£0m £2m £4m £6m £8m £10m £12m £14m £16m £18m
Total revenue expenditure
Total teaching, supply and support staff as % of total expenditure
2010-11 2011-12 2012-13 2013-14 2014-15 2015-16 2016-17
East Midlands 6.4% 4.7% 4.1% 4.7% 3.4% 3.1% 7.4%
East of England 2.6% 1.8% 1.4% 1.7% 1.9% 1.5% 3.4%
London 5.2% 3.1% 2.9% 3.3% 3.3% 5.0% 8.6%
North East 4.6% 4.8% 8.2% 6.1% 5.4% 6.7% 10.1%
North West 7.7% 5.6% 5.5% 6.5% 5.0% 5.5% 6.7%
South East 4.5% 2.7% 2.9% 3.8% 3.1% 4.0% 7.0%
South West 5.6% 4.7% 4.2% 5.0% 4.7% 4.3% 6.7%
West Midlands 5.6% 3.8% 4.5% 4.3% 4.1% 3.9% 7.1%
Yorkshire and the Humber 4.0% 3.1% 5.1% 4.8% 4.2% 5.4% 8.4%
England total 5.2% 3.7% 4.1% 4.4% 3.8% 4.3% 7.1%
2010-11 2011-12 2012-13 2013-14 2014-15 2015-16 2016-17
East Midlands 11.9% 10.2% 5.1% 6.8% 10.2% 11.9% 22.0%
East of England 7.5% 3.8% 2.5% 3.8% 7.5% 12.5% 17.5%
London 15.7% 10.5% 8.1% 9.3% 11.0% 17.4% 28.5%
North East 16.3% 10.5% 11.6% 7.0% 15.1% 23.3% 26.7%
North West 17.6% 13.7% 12.3% 9.3% 14.1% 17.2% 25.1%
South East 12.2% 12.2% 7.8% 7.8% 13.9% 18.9% 22.8%
South West 22.1% 17.4% 12.8% 14.0% 19.8% 24.4% 34.9%
West Midlands 10.4% 6.7% 8.2% 10.4% 13.4% 11.9% 24.6%
Yorkshire and the Humber 12.5% 11.6% 8.9% 8.9% 19.6% 20.5% 33.0%
[image:33.595.79.472.487.637.2]34
Figure A1.9: Details of the local authority maintained schools with consistently falling balances and a funding shortfall
falling (or constant)
for 2 yrs
falling (or constant)
for 3 yrs
falling (or constant)
for 4 yrs
falling (or constant)
for 5 yrs
falling (or constant) for 6+ yrs
Total additional funding in 2018-19 £4.7m £1.5m £0.6m £0.2m £0.1m
Cost of 1% increase in exp on teachers etc £8.9m £2.7m £1.1m £0.4m £0.1m
Shortfall -£4.2m -£1.3m -£0.5m -£0.2m -£0.1m
Number of schools 929 274 105 38 14
Shortfall per school -£4,474 -£4,615 -£4,924 -£5,333 -£4,526
Average balance per school £79,576 £38,571 £30,370 £9,763 -£4,329
Total additional funding in 2018-19 £1.0m £1.6m £0.6m £0.4m £0.1m
Cost of 1% increase in exp on teachers etc £1.7m £2.8m £1.1m £0.7m £0.1m
Shortfall -£0.7m -£1.2m -£0.4m -£0.3m -£0.1m
Number of schools 45 75 31 16 3
Shortfall per school -£15,929 -£15,621 -£13,999 -£19,049 -£16,941
Average balance per school £122,957 £39,442 -£227,884 -£483,678 -£596,079
Primary