School Workforce in
England: November
2015
Quality and methodology information
document
2
Contents
1. Summary 3
2. Data sources 4
3. Data collection, processing and cleaning 5
4. Production of the statistical first release 9
Size of the schools’ workforce 9
Characteristics of the school workforce 10
Teacher flow data 11
Teacher retention data 12
Teachers’ average salaries 12
Teacher’s qualifications and curriculum 13
Teacher vacancies and temporarily filled posts 14
Teacher sickness absence 15
Pupil teacher and pupil adult ratios 16
Definitions and general notes 16
How the Department uses the School Workforce Census 17
3
1. Summary
The Statistical First Release (SFR): ‘School Workforce in England: November 2015’ provides the latest information at national and local level on the numbers and characteristics of teachers and other school staff that work in state funded schools in England.
The SFR summarises the information that was collected via the November 2015 School Workforce Census – the sixth running of the ‘census’ – and data from other sources. It covers the following broad themes.
Teacher numbers, characteristics and deployment.
The SFR shows the time series of teacher numbers in all state funded schools in England. It provides various breakdowns of teacher numbers; by post held, school type and phase, gender, age, ethnicity, whether they work full/part-time, have Qualified Teacher Status or not etc.
Teacher flows, turnover and retention.
The SFR shows the number of qualified entrants to teaching (and whether they are new teachers or returners), their propensity to stay, and the numbers of qualified teachers leaving the teaching profession (e.g. through retirments or leaving early).
Teacher pay. The SFR shows the salaries received (in £5/10 thousand bands) for all teachers and separately for classroom teachers, leadership group teachers, and head teachers. The statistics also provide an age, gender and school type/phase breakdown. Where appropriate average and median salaries are provided for comparison purposes.
Teacher qualifications and curriculum taught.
The SFR provides information on the highest post-A-level qualification held by teachers (by teacher grade and school type/phase).
Estimates are also provided, based on a large sample of secondary
schools only, that show the number of teachers by subject, teaching at Key
Stage 3-5 and the relevant number of hours taught.
The SFR also provides estimates of the number/percentage of teachers teaching each subject that have relevant post-A-level qualifications in the subject. Similar data is produced showing the number of hours taught by teachers with relevant post-A-level qualifications in the subject.
Teacher vacancies. The SFR shows the number of advertised teaching posts that were either temporarily filled or still vacant in November (start of the academic year). It provides subject level estimates for these posts for secondary schools only. Teacher sickness
absence.
The SFR shows the number of teachers that have taken sickness absence in the previous year and in doing so the number of days they were absent. Pupil teacher ratios. Pupil data from the January 2016 school census is used to produce pupil
4
Statistics on support staff.
Time series data are also published which show the number of teaching assistants and school support staff employed by all state funded schools. This data shows the numbers by post held and has some limited characteristics data e.g. gender and ethnicity.
The latest release updates and supercedes the last SFR which was published on July 2nd 2015. The full series can be found here:
https://www.gov.uk/government/collections/statistics-school-workforce
The census is the main source of information on the numbers, characteristics and deployment of school staff and it is used to inform policy decisions to improve the standard of education in schools. It is also used extensively by other organisations interested in this subject.
This document aims to provide information on the methodology involved in the production of this data – from collection through to publication – and information relating to the quality of the statistics.
2. Data sources
The statistics in this SFR are based on information provided by schools and local authorities as part of the annual School Workforce Census; which was introuduced in 2010.
Prior to 2010 some school workforce data was provided by local authorities as part of the Form 618g return and some by schools as part of the pupil level School Census. In addition, data on teacher pay (for example) was collected separately as part of the administration of the Teachers’ Pension Scheme. The School Workforce Census was introduced to replace these (and other) collections and designed to ensure data was collected consistency and comprehensively by having all key data items in one single, harmonised exercise. This helped improve the quality and consistency of key school workforce statistics vital for monitoring and evaluating the school workforce; and as a benefit helped reduced the data collection/provision burden on schools.
The census collects information on school staff from all state funded schools in England; including local authority (LA) maintained primary, secondary and special schools, all academy schools (including free schools) and Pupil Referral Units (PRU). It also collects information from LAs on their centrally employed teachers. The census does not collect data from independent schools, sixth form and other further education colleges.
5
or role, qualifications data and (for teachers) salary data. It also collects contract information on the weekly hours worked and pay details of those whose individual level data is collected. The hours worked, together with the full-time weekly hours, are used to calculate whether staff are full or part-time and for part-time staff their full-time equivalence. This calculation takes into account where school staff members have more than one open contract.
The census collects data at the individual level for all types of staff in schools. In particular, for school teachers, it collects individual level data on teachers in regular employment i.e. those with a contract of 28 days or longer. This includes contracts that were open on the census date and also those that were open but ended during the previous academic year. School teachers that did not have an open contract on the census date are not included in the in-service figures in the SFR however their information is used in the calculation of teacher sickness absence rates (as these releate to the previous 12 months). Teachers that were employed in schools during the census period that do not have a contract of employment that lasts/will last 28 days or longer are included in an aggregate headcount of occasional teachers.
Individual sickness absence records are also collected for all teachers in service during the 12 months prior to the census date. These records are linked to construct the number of incidences of sickness absence and estimate the total number of days lost to teacher sickness absence.
In addition, for a sample of secondary schools (including secondary academy schools), the census collects information on the curriculum taught by teachers to pupils in years 7-13. In the latest SFR the curriculum data is only available for around 85 per cent of secondary schools that have the necessary management information systems in place to supply it. The curriculum data is combined with the qualifications data to estimate the percentage of lessons in a subject that are delivered by a teacher qualified in that subject. The combination of qualifications and curriculum data available means that these tables are based on sample of 74 per cent of secondary school teachers.
The census also collects school level aggregate counts of teacher vacancies, occasional teachers and support staff employed through an Agency/third party service provider. Local authorities also supply data on the number of educational psychologists they employ.
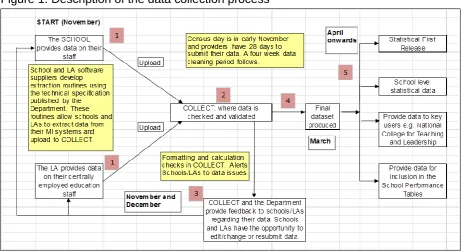
3. Data collection, processing and cleaning
6
[image:6.595.56.519.145.397.2]through and how the Department supports schools and local authorities in their task of providing high quality data. The first four stages are all internal processes. The census data is not used publicly until the final, fifth stage when it is formally published within the SFR.
Figure 1: Description of the data collection process
The school workforce data required from both schools and local authorities is determined in advance of the census in such a way that schools and LAs can engage the suppliers of their management information systems (MIS) with sufficient time to incorporate any new data items (or changes to existing data items) into their local systems. The software suppliers build data extraction routines based on the data requirements set out in the technical specification published by the Department. Typically a near final version of the technical specification is shared with software suppliers around a year before the next census date. This allows software suppliers the opportunity to see and comment on the data requirement and any changes from the previous year. Their comments and views are taken into account to ensure the Department is asking for data in a way that is straightforward to deliver. A final version of the technical specification is then published for local authorities and software suppliers to see and use. The November 2015 technical specification is published here.
7
out the quality of their data and the data extraction routines provided by their software suppliers by using the familiarisation version of the Department’s data collection system, COLLECT. The full list of data items collected by the census can be found in the guides provided to schools and LAs.
Stage 2: Once schools and local authorities have successfully loaded their data onto COLLECT they can review and inspect their data. The COLLECT system has a range of checks that it runs on the data: e.g. simple formatting checks, arithmetic checks and validations rules that specific data items must meet. The checks made within COLLECT are contained within the published guides and specifications.
Software suppliers often build these checks into their data extraction routines and/or MIS system upgrades. The checks within COLLECT will flag up where the data provided has either failed (an error) to meet the standards required or doesn’t conform (a warning) to what was expected. For example, an error would result if no contract information was provided and a warning would result if the date of birth placed the teacher’s age as less than 21 or over 90. The validation checks are reviewed and improved each year, for example, checks to identify schools with very large changes in teacher numbers and an opportunity to say whether the change was real rather than a data input error. This process helps identify where schools initial returns need attention. Checks and guidance have been updated and improved since November 2014 to help schools provide better quality data on the pay of teachers (especially part-time teachers) and whether the data submitted includes a pay award for the current year.
Schools and local authorities then check their data - especially the errors and warnings - to ensure the data is correct and accurately reflects the staffing levels at their school at the time of the census. Changes and/or corrections to the data provided can either be done on-line in COLLECT or within the local MIS system (preferred). If the changes are done locally then the data has to be resubmitted to the Department. Once schools and local authorities have resolved their errors and warnings they approve their data – which signals to the Department that the data can move to the next stage.
Stage 3: Once the data has been approved for use by schools and local authorities the Department runs a further set of checks on the data. These checks look within the data to spot any problem areas, for example, where schools have provided substantial numbers of records that are missing particular data items e.g. staff with no contract information and staff whose pay rate is not credible. The results of these checks are provided as feedback to local authorities to help them work with their schools to ensure a complete set of data exists for all schools in their area.
8
use to discuss their queries regarding the data they are submitting. The helpdesk operated throughout the census period, November to December, and throughout the period immediately afterwards when the majority of the data cleaning takes place – typically December into January. When this process is completed and schools and LAs are happy with their data (i.e. after they have resolved all the issues raised in the feedback) they authorise the data.
Stage 4: Once all the school and local authority data has been authorised a database is created which allows the Department’s statisticians to prepare the data for publication. At this stage any data that has been provided and deemed to be out of scope is removed from the dataset e.g. teaching staff on zero hour contracts (likely to be a pool of supply teachers that are regularly used by the school but were not actually in service during the time of the census). This database is used to create a standalone 2015 dataset for all staff working in all schools and an updated version of the linked teacher dataset which is the source of data used for publishing statistics on teacher entrants, teachers leaving state funded schools and teacher retention.
The linking of teacher data across years allows for the better identification of poor quality or inconsistent school data. The linked dataset has helped with the identification and removal of duplicate teacher contracts - where they were provided by both a school and a local authority. It has also supported the identification of individual teachers working in multiple schools. A process of merging their contract data has been developed and one consequence of this is to allow a small number of teachers to have a full-time equivalence of up to 1.2.
The linked teacher dataset can also be matched to other data held by the Department. In particular to the administrative data held on the attainment of Qualified Teacher Status. Where teacher records without QTS have been supplied in error then their QTS flag can be overwritten with the correct information.
9 constituency.
4. Production of the statistical first release
The data collected in the 2015 census has been used to update the time series data in the SFR and to create the latest snapshot data. The SFR uses both linked teacher data as well as single year teacher and support staff data. The information contained in this statistical release is deemed to be final data and no further data is expected to be received from schools and local authorities.
Size of the schools’ workforce
In the SFR Tables 1-3 focus on the size of the workforce in schools; the number of teachers, teaching assistants, school support staff and other staff (e.g. short-term ‘occasional’ teachers).
For teachers the counts in the SFR show the number who were in service in a state funded school on census day and who had a contract lasting (or will last) longer than 28 days. Teachers in schools on census day with a contract lasting less than 28 days are recorded as ‘occasional’ teachers.
Full-time and part-time school staff are defined by the proportion of the full-time hours they are employed to work. The preferred measure for the total number of teachers in schools is the full-time equivalent (FTE) number of teachers. For example, one full-time teacher and one part-time teacher (that works 50% of a standard year) would be classed as 1.5 FTEs.
The information contained in these tables, for 2010 onwards, is derived in the following way:
Teacher data are derived from the linked teacher dataset which covers teachers in service between 2010 and 2015.
All support staff data are derived from the dataset for the individual year (support staff data are not linked across years).
10
The data for teaching assistants and school support staff are not linked across years and therefore the published figures show the total number of people in these groups with open contracts on census day across all schools.
The total number of teachers, teaching assistants and other school support staff are calculated from the data provided to the Department by schools and local authorities. However, in each year there are a small number of schools and local authorities that do not provide a usable census return. To ensure the total number of staff reported in schools is not unduly affected by these missing schools estimates of their impact are made.
In 2015, there were 150 schools (0.7% of the expected 22,063 schools) that did not provide usuable data. For these schools it was estimated they employed 3,960 teachers. To produce this estimate a scaling factor is derived. The scaling factor takes into account the total number of schools per phase, the average number of staff (by type) per phase and the number of missing schools by school phase. The scaling factor is then used to gross up the totals based on received data to produce national estimates. For example in 2015 there were 16 missing LA maintained primary schools that did not provide information. The average school of this type had an average of 10.01 FTE teachers in service. Therefore an additional 10.0 teachers were added to account for each missing school. A total of 160.2 teachers.
Characteristics of the school workforce
Tables 3 to 6 provide deployment and characteristics data for school staff e.g. full/part-time status, age, gender and ethnicity information for teachers (by grade) and support staff (by role) by school phase. Again the teacher data is derived from the linked teacher dataset and the support staff data is derived from the single year dataset.
Tables 5 and 6 provide statistics based on the headcount of staff; rather than the FTE. For Table 5 where teachers have more than one post in a school, they are counted once under their highest graded post. The post of head teacher is ranked highest and classroom teacher lowest. If the teacher has more than one post at the same grade then only one is counted. There is no natural hierarchy of posts for school support staff and therefore where staff have more than one post they are counted once under each post. Around 10 per cent of support staff have more than one role. These are the first tables where estimates for missing schools are not included. As the overall percentage of staff missing is very small, the missing characteristics data should not affect the distributions presented in these and later tables.
11
The staff breakdown by type of post, including the grade of teacher, is taken from the information in the post description provided in the contract and not from the additional role information which provides greater detail. The further information available in the role has not been used to decide the post held except for teaching assistants where they were recorded as support staff in the ‘Post description’ field in error. The further breakdown of the role for teaching assistants and support staff provided in Table 2 is provided by the first role descriptor supplied for the contract.
Teacher flow data
The teacher flow data (new entrants, retention data, and leavers) published in Table 7a and Table 7b has been produced from the linked teacher dataset. This has brought together the teacher data present in each of the six completed censuses (from 2010 to 2015) to produce a longitudinal teacher dataset. The longitudinal nature of the teacher data makes it possible to track teachers over time. It helps to identify teachers entering and leaving the profession and those remaining in post.
The statistics published show the time series for the number of entrants to, and the number of leavers from, teaching in state-funded schools in each year.
The total number of teacher entrants includes the following groups which are separately identified:
Newly qualified teachers in their first post.
Teachers who have previously worked in the state-funded sector and are returning to work after a break of more than one year e.g. maternity leave, career breaks.
Teachers working in a state-funded school for the first time who have previously worked elsewhere; this may include employment in the independent or further education sector, elsewhere in the UK or overseas.
The total number of teachers leaving the profession in a year includes the following groups which are separately identified:
Teachers retiring; including teachers taking early retirement or who are retiring through ill-health.
Teachers leaving the profession. This group will include those leaving the profession entirely but could also include those moving to other UK education sectors and those leaving on career breaks e.g. maternity leave or secondments outside of the school sector. Some of these teachers may rejoin a state funded school in England at a later date.
12
Teachers present in both years are those who have remained in-service (this will include those teachers who have moved between state-funded schools).
Teachers present in the first year but not the second year are teachers who are no longer working in state-funded schools.
Teachers present in the second year but who were not present in the first year are teachers who have started working in state-funded schools (which includes new starts and returners).
The teacher entrants rate is then calculated by dividing the number of entrants by the stock of teachers in the year when they are in service. Similarly, the teacher leavers rate (often known as the teacher wastage rate) is calculated by dividing the number of leavers by the stock of teachers in the year they were in service.
Teacher retention data
The teacher retention matrix is published in Table 8. This shows the percentage of qualified teachers that enter service in the year after qualifying and that remain in service in each year afterwards. This information is produced from a combined version of the linked teacher dataset and information held in the Database of Teacher Records, (DTR), (data available as part of the administration of the Teachers’ Pension Scheme).
The table gives the position for each teacher in this group in each year after they first entered. A proportion will re-enter service or leave each year. They are included in the calculation irrespective of this movement if they are in service in the year in question. Some teacher may have been in a state funded school particularly in the earlier years of the series which is based on the DTR. The DTR is known to exclude some teachers each year. No estimates have been included to account for this and the table only includes teacher where a definite record of their being in service is present.
Teachers’ average salaries
The statistics on teachers’ salaries have been derived from the single year teacher contracts dataset. Linked data has not been used as this aggregated teacher’s with multiple contracts to a main contract based on the highest grade. This aggregation would affect the accuracy of the figures published.
For information on school teachers’ pay and conditions (STPCD) please refer to the statutory guidance at the following link:
https://www.gov.uk/government/publications/school-teachers-pay-and-conditions-2015
13
whose salary lies below the lower limit of the lowest point on the relevant pay scale are shown as misreported. This category also includes teachers with missing salary details. Additional allowances have been included in the gross salary and noted once for each contract for each type of allowance. Where two or more allowances of the same type are noted then the higher amount is taken as the allowance in payment on the census date and included in the gross salary. The only exception is unspecified allowances where the sum of all these is included as representing the amount included in the salary over the course of a year as these are likely to be one-off rather than continuous monthly payments.
When making comparisons of teacher salaries by school phase or type there will be several factors that affect pay to consider. For example, the published data do not take into account factors such as: size of school, location of the school (London has higher pay scales) and the teachers’ experience and the size of school. In addition, in previous years the location of the growing number of academy schools affected the distribution of average pay statistics. Many of the first group of academy schools were in London and the south east where the pay bands are higher and this was inflating the average pay statistics - making comparisons difficult. A change to a larger more geographically spread group of academies and lower numbers of local authority schools will continue to affect this comparison,
It is possible that not all schools provided the most up to date pay data that took account of any pay awards due at the start of the 2015/16 academic year. This timetable is very close to the School Workforce Census collection period and not every school manages to update their management information systems before providing a census return.
Teacher’s qualifications and curriculum
Table 10 provides information on teachers’ highest level of post A level qualification. Qualifications information was received for 97 per cent of teachers. The percentage of teachers holding a particular level of qualification was derived using a baseline of the total teachers for whom qualifications information was provided. Where a teacher was reported as holding more than one post A level qualification, the qualification level was determined by the highest level, from degree or higher to other qualification at National Qualifications Framework (NQF) level 4 and non-UK qualifications for which an equivalent NQF level was not provided.
14
curriculum information had qualifications information as well, the percentage of teachers included in the sample for Tables 12 and 13 is reduced to 76 per cent of teachers. The data have been weighted and grossed so that all totals presented in the tables provide a representative, national picture. Investigations have revealed that there is some bias in the sample when the average pay of the schools providing data is analysed and some regions provide a higher percentage of their schools to the sample than others. These differences may be caused by the different characteristics of schools that can provide information compared with those that can’t.
Tables 12 and 13 provide information on the percentage of teachers, and of hours taught by teachers, holding relevant post A level qualifications by subject taught. The tables record the highest qualification gained in each subject taught, rather than each qualification. A teacher’s qualification was deemed as ‘relevant’ to the subject taught if the subject of their qualification, reported using the Joint Academic Coding System (JACS), appeared in the list of JACS codes in the Department’s subject mapping. The full mapping used is available on the same web page as this statistical release.
The subject of a qualification was not received for all the qualifications data submitted and in a small number of other cases the information was incomplete or incorrect. Overall, useable qualifications data was received from 95 per cent of teachers in schools submitting curriculum returns, and this was consistent across subjects. Confidence intervals have been calculated around the percentages to show the statistical accuracy of the data, and give a range within which we can be reasonably sure (95 per cent certain) that the true value actually lies.
A change was made, after the November 2011 collection, to the methodology that creates the percentage of qualifications by subject in Tables 12 and 13. This change applies to tables using the November 2012 data and for future tables. Where a teacher is recorded as having a PGCE they must also have a first degree recorded as well to be included in the table as their record of qualifications is not complete without both records. This change might slightly raise the percentage of teachers with a degree in the subject.
Teacher vacancies and temporarily filled posts
Tables 14 and 15 show the total number of vacancies and temporarly filled posts reported by schools. Schools that did not make a return for the vacancy module are judged to have no vacancies. No estimates were made for schools that did not make a census return for November 2015. The small number of these means this will not have a significant impact.
15
those filled on a temporary basis unless filled by someone with a fixed term contract of one term or more.
A temporarily filled post is one where a permanent vacancy is available but it is being filled by a teacher with a contract of at least a term but less than one year’s duration. This is irrespective of whether the post has been advertised.
The teacher vacancy rate is the number of vacancies expressed as a percentage of qualified teachers in post e.g. full (or head count number of part-time) regular teachers in (or on secondment from) the relevant phase.
To calculate the secondary school vacancy rates by subject, the percentage of the secondary school curriculum that each subject taught contributes is calculated from the information provided in Table 12. The total number of full-time qualified classroom teachers in service is multiplied by this percentage to find the total number of teachers in post teaching each subject.
Teacher sickness absence
Teacher sickness absence information was received for around 98 per cent of local authority maintained schools. A local authority was deemed to have made a full return where 95 per cent of schools or more had supplied sickness absence information because small schools may not have had any sickness absence to report. 47 local authorities had less than the required 95 per cent return rate and in these cases estimates based on the national rate were added (to the statistics in Table 16) to account for the schools with missing information. Missing sickness absence data for teachers in schools that did not have a usable return was estimated as the average sickness absence days lost per teacher for schools that made a return.
24 per cent of academy schools did not have a complete teacher sickness absence return because they were not open as an academy school for the full academic year. Teacher sickness absence statistics are based on the absences taken by teachers in the 12 months up to the census date. It did not prove possible to accurately estimate the teacher sickness absences missing for these schools. An estimate based on the average sickness days taken for all schools where a absence return was made including local authority schools where information for an academy school was not available.
16
working days in a single academic year. Non-working days are not included in the figures. Days absence that can be recorded for a part-time teacher are limited to those that they are contracted to teach.
Pupil teacher and pupil adult ratios
The pupil numbers used to calculate the pupil teacher ratio (PTR) and the pupil adult ratio (PAR) are from the January 2016 School Census. It is not thought that the difference in the timing of the two censuses affects the accuracy of the PTR data. Only those schools that provided both pupil and workforce information are included in the figures. The pupil numbers used in the calculation of the PTR statistics include dual registered pupils. An overall PTR/PAR for academ and Free Schools is provided. Comparisons between this and earlier years are difficult because the proportion of primary academies, which have a higher PTR than secondary schools, is rising.
The overall PTR is based on the total FTE number of pupils on roll in all local authority maintained nursery, and all primary and secondary schools and the FTE of all teachers in these schools (including: occasional teachers; those on employment based routes to QTS; others without QTS, those on paid absence and any replacements). Special schools are excluded. Prior to 2010 the teacher numbers are from the Form 618g survey. The overall PAR also includes support staff excluding administrative, clerical and auxiliary staff.
Definitions and general notes
The tables in this SFR generally show school staff in five groups, teachers, teaching assistants, school support staff, school auxiliary staff and local authority centrally employed staff. The definitions used with the SWF data published in this SFR are described here:
Notes for teachers and teaching statistics
a) Statistics for teachers include all full and part-time, qualified and unqualified, classroom teachers and school leadership group teachers (Head teachers, Deputy and Assistant Head teachers) unless specified within the tables.
b) The number and characteristics of Leading Practitioners have been incorporated into the statistics on classroom teachers.
c) Advisory Teachers have been included in teacher totals for 2010 to 2012 to be consistent with 2013 to 2014.
d) Teachers in occasional service are those with a contract of less than one month, 28 days for SWF, and are employed on census day. e) Teachers provided by teacher employment agencies are included in
the main count or as in occasional service depending on the length of their contract.
Notes on school support staff
17
b) Statistics for school support staff refer to non-classroom based school staff such as school secretaries and other clerical staff, bursars, technicians and childcare staff (e.g. a school nurse).
c) Statistics for auxiliary staff (roles which were not collected by the Department prior to November 2010) include catering and school maintenance staff.
d) Third party support staff are not directly employed by the school and are in service on the census date.
e) Centrally employed staff are those employed by the local authority and include the following types of employee: peripatetic teachers; home tutors; and teachers who are employed by education authorities to provide education in institutions other than schools (e.g. hospitals, home tuition, assessment centres and pupil referral units).
Notes for teacher sickness absence data
a) Sickness absence periods, and days taken, include all periods of sickness absence leave taken in the academic year (1 September 2014 to 31 August 2015). They include any that were ongoing on the 1 September 2014 and exclude any that were ongoing after the 31 August 2015.
Notes on schools a) Middle schools are classed as deemed, i.e. as either primary or secondary and City Technology Colleges and free schools are included with academy schools.
In addition, when reviewing the tables, please note the following:
We preserve confidentiality.
The Code of Practice for Official Statistics requires we take reasonable steps to ensure that our published or disseminated statistics protect confidentiality.
We round the numbers.
We suppress cell counts and totals below 50. Because of this rounding, totals in text and in tables may not always equal the sum of their component parts. Similarly, differences quoted in text may not always be the same as differences shown in tables. This suppression is consistent with the Departmental statistical policy.
We have adopted the following symbols to help with identification.
Symbols are used in the tables as follows: . not applicable
.. not available - nil or negligible
How the Department uses the School Workforce Census
The school workforce census data are used in many ways within the Department for Education and its agencies. The main uses are as follows:
Production of statistical briefing and analysis on various topics such as…
a) The deployment and qualifications of teachers in schools.
b) Analysis of the percentages of lessons taught by teachers with relevant qualifications.
c) Analysis of teaching vacancies by subject and region.
d) Assessment of the number of teachers without qualified teacher status. Teacher demand
modelling to estimate
a) Demographic pressures and churn in the workforce.
18
changes due to various policies or demographic changes.
qualifications etc.
c) Informs the annual target setting for initial teacher training places via the Teacher Supply Modell; helps to ensure a sufficient supply of teachers to schools.
d) Modelling the number of potential school leadership teachers; to help ensure there are enough school leaders in the system.
Analysis of Teacher Pay Costs
a) Provides evidence to support the independent pay review body recommendations.
b) Assess impact of proposals for pay and estimate future costs. Transparency through
publication
a) Through the publication of the annual Statistical First Releases and school level data and through the Performance Tables.
b) The data is used to reply to a substantial volume of official correspondence, including Parliamentary Questions and Freedom of Information requests.
School Workforce Census data is
sometimes shared with external researchers…. …under strict controls. Some examples have been …
a) Research into the new institutions that are admitting pupils at age 14, including, but not limited to University Technical Colleges and Studio Schools etc., profiling them in terms location, who works in them and which pupils attend them.
b) The costs and benefits of different teacher training routes in England. c) Modelling teacher supply and retention over time.
d) Research into differentials in levels of appointment and salary level by demographic sub-groups of the teacher population.
e) Better understanding of the impact of specialist teachers on the uptake of subjects and achievement in subjects.
5. Further information
Further information on the school workforce census is made available via the SFR and during year. The Department for Education is only responsible for schools in England.
School, local authority and regional figures.
School level school workforce data is available within the additional tables published alongside this statistical release. The school data contains a range of information for each school following the same themes as set out in this document. It also includes both local authority and regional level summaries. The total number of teachers in schools will not sum to the LA, region or national total. This is because the LA and region totals include those employed directly by LAs and the national totals include estimates for missing schools.
Want these figures, related to Performance Tables?
8 school level school workforce indicators are included as part of each year’s School Performance Tables. The indicators include FTE and headcount statistics for the number of teachers, teaching assistants and school support staff, the average salary of teachers and the pupil teacher ratio.
School level school workforce data from November 2015 will be included in the next set of tables to be published at the end of 2016. For the latest of School Performance Tables visit:
http://www.education.gov.uk/schools/performance/ Want previously
published figures?
19
https://www.gov.uk/government/collections/statistics-school-workforce Want data for Wales,
Scotland or Northern Ireland?
The School Workforce Census only collects information from schools in England. Education in Wales, Scotland and Northern Ireland is a devolved matter for the Welsh, Scottish and Northern Irish Governments.
For information for Wales, Scotland and Northern Ireland, contact the departments below or access their statistics at the following links:
Wales: [email protected] or
http://gov.wales/statistics-and-research/schools-census/?lang=en
Scotland: [email protected] or
http://www.gov.scot/Topics/Statistics/Browse/School-Education
Northern Ireland: [email protected] or
https://www.education-ni.gov.uk/articles/education-workforce
For related publications see:
Statistics on teacher training and the annual survey newly qualified teachers can be found at the following link:
20 © Crown copyright [2016]
You may re-use this document/publication (not including logos) free of charge in any format or medium, under the terms of the Open Government Licence v2.0. Where we have identified any third party copyright information you will need to obtain permission from the copyright holders concerned.
To view this licence:
visit www.nationalarchives.gov.uk/doc/open-government-licence/version/2
email [email protected]
About this publication:
enquiries www.education.gov.uk/contactus download www.gov.uk/government/publications Reference: [000-000-000]
Follow us on Twitter:
@educationgovuk
Like us on Facebook: