University of Southern Queensland
Faculty of Engineering and Surveying
Investigates the effect of surface shear on pavements
near road intersection
A dissertation submitted by
Ryan Jay Kemp
In fulfilment of the requirements of
Courses ENG4111 and ENG4112 Research projects
Towards the degree of
Bachelor of Engineering and Bachelor of Business (Civil/ Management
and Leadership major)
Abstract
The objective of the project was to study the effect of surface shear on the performance
of pavements. This was achieved through the collection and analysis of three data sets.
Firstly, background information was reviewed providing information on tyre-pavement
interaction, pavements design and failure mechanisms. Secondly, field data was
collected from four roads and comprised photos of vertical deformation taken regular
intervals, assessment of ride quality and movies of vehicles braking and accelerating on
the roads. Lastly, a parametric study was carried out using the finite element analysis
program SIGMA/W.
The findings confirm that vehicles accelerating and decelerating impose additional
stresses within the pavement and consequently result in additional vertical deformation
subject on the level of horizontal stress. However, at the investigated intersection the
total vertical deformation was within limits specified in Austroads demonstrating that,
current design methods are suitable for the design of pavement in areas that experience
high surface shear.
University of Southern Queensland
Faculty of Engineering and Surveying
ENG4111 Research Project Part 1 &
ENG4112 Research Project Part 2
Limitations of Use
The Council of the University of Southern Queensland, its Faculty of Engineering and
Surveying, and the staff of the University of Southern Queensland, do not accept any
responsibility for the truth, accuracy or completeness of material contained within or
associated with this dissertation.
Persons using all or any part of this material do so at their own risk, and not at the risk
of the Council of the University of Southern Queensland, its Faculty of Engineering
and Surveying or the staff of the University of Southern Queensland.
This dissertation reports an educational exercise and has no purpose or validity beyond
this exercise. The sole purpose of the course pair entitled “Research Project” is to
contribute to the overall education within the student's chosen degree program. This
document, the associated hardware, software, drawings, and other material set out in
the associated appendices should not be used for any other purpose: if they are so used,
it is entirely at the risk of the user.
Professor Frank Bullen
Dean
Certification
I certify that the ideas, designs and experimental work, results, analyses and
conclusions set out in this dissertation are entirely my own effort, except where
otherwise indicated and acknowledged.
I further certify that the work is original and has not been previously submitted for
assessment in any other course or institution, except where specifically stated.
Ryan Jay Kemp
Student Number: 0050039489
Signature
Acknowledgements
Firstly, I would like to thank my supervisor Dr Jim Shiau for the opportunity to study
under his guidance and the continued technical support and direction offered
throughout the project.
I would also like to thank my family for their ongoing support and encouragement.
Without their support all this would not have been possible.
Lastly, I would also like to thank Trevor Herlihy for volunteering his time and assisting
Research 4111/4112
1
Table of Contents
Chapter 1... 7
Introduction ... 7
1.1 Overview ... 8
1.2 Goals... 9
1.3 Objectives ... 10
1.4 Methodology ... 10
1.5 Conclusion ... 11
Chapter 2... 13
Background ... 13
2.1 Pavements ... 13
2.2 Overview of shear force on pavement design... 18
2.3 Identifying Areas of High surface Shear ... 20
2.4 Vehicle Stresses Imposed on the Pavement ... 21
2.5 Vertical Tyre Contact Stress ... 23
2.6 Longitudinal tyre pressure ... 26
2.7 Tyre Contact Shape ... 28
2.8 Tyre Load Conclusion ... 29
2.9 Pavement Damage ... 30
Chapter 3... 32
Research Design and Methodology ... 32
3.1 Literature Review ... 33
3.1.1 Rational ... 33
3.1.2 Limitation ... 34
3.1.3 Literature Review Summary ... 35
3.2 Field Data and Observation ... 36
3.2.1 Rational ... 36
3.2.2 Methodology ... 37
3.4 Selected Roads ... 42
Research 4111/4112
2
3.4.2 Acanthus Street, Darra ... 45
3.4.3 Beaufighter Avenue, Archerfield ... 46
3.4.4 Lavarack Avenue, Eagle Farm ... 47
3.2.3 Limitation ... 48
3.1 Pavement Design... 49
3.1.1 Rational ... 50
3.1.1 Methodology ... 50
3.1.1 Limitation ... 53
3.3 Parametric Study ... 54
3.3.1 Rational ... 55
3.3.1 Methodology ... 55
3.2.4 Limitation ... 62
Chapter 4... 64
Results and Discussion ... 64
4.1 Interpretation ... 64
4.2 Interpretation Ride Quality Assessment ... 65
4.2 Data Manipulation ... 66
4.3 Mica Street, Wacol ... 69
4.3.1 Vehicle count... 69
4.3.2 Design ... 70
4.3.3 Vertical Deformation ... 70
4.4 Acanthus Street, Darra ... 74
4.4.1 Vehicle count... 74
4.4.2 Design ... 74
4.4.3 Vertical Deformation ... 75
4.5 Lavarack Avenue, Eagle Farm... 78
4.5.1 Vehicle count... 78
4.5.2 Design ... 79
4.5.3 Vertical Deformation ... 80
Research 4111/4112
3
4.6.1 Vehicle count... 84
4.6.2 Design ... 84
4.6.3 Vertical Deformation ... 85
4.7 Parametric Study Results ... 87
Chapter 5... 92
Conclusion ... 92
Chapter 6... 94
Further Study ... 94
5.1 Additional Field Studies ... 94
5.2 Parametric Studies ... 95
5.3 Literature Review ... 96
List of Figures
Figure 2-1: Typical Pavement Profile with Stress Distribution ... 13Figure 2-2: Gravel Mix Types and Use (Ausroads Asphalt, pg. 10) ... 14
Figure 2-3: Typical Vertical Contact Stress ... 24
Figure 2-4: Vertical contact stress... 24
Figure 2-5: Longitudinal Stress with 650kPa pressure ... 27
Figure 2-6: Longitudinal Stress with 650kPa pressure ... 27
Figure 2-7: Tyre contact shape ... 28
Figure 2-8: Tyre Contact Shape ... 29
Figure 2-9: Example Relationships Between Permanent Strain and Loading Cycles ... 31
Figure 3-1: Straight edge showing vertical deformation ... 38
Figure 3-2 Ausroads vehicle class (pg. 85) ... 41
Figure 3-3: Road location plan ... 43
Figure 3-4: Mica Street and Cobalt Street, Wacol ... 44
Figure 3-5: Acanthus Street and Boundary Road, Darra ... 45
Figure 3-6: the corner of Beaufighter Avenue and Boundary Road, Archerfield ... 47
Research 4111/4112
4
Figure 3-8: Bowlers Pressure Bulb ... 57
Figure 3-9: SIGMA/W pressure vertical stress contours ... 58
Figure 4-1: Wheel track labelling scheme ... 65
Figure 4-2: Pothole at Wacol ... 67
Figure 4-3: Longitudinal cracking at Darra ... 68
Figure 4-4: Wacol: Graph of Distance form Intersection (m) Lane 1 Vs Vertical Deformation (mm) ... 71
Figure 4-5 Wacol: Graph of Distance from Intersection (m) Lane 2 Vs Vertical Deformation (mm) ... 71
Figure 4-6: Wacol: Graph of Distance From Intersection (m) Lane 3 Vs Vertical Deformation (mm) ... 73
Figure 4-7: Darra Graph of Distance from Intersection (m) Lane 1 Vs Vertical Deformation (mm) ... 76
Figure 4-8: Darra: Graph of Distance from Intersection (m) Lane 2 Vs Vertical Deformation (mm) ... 77
Figure 4-9:Eagle Farm: Graph of Distance From Intersection (m) Lane 1 Vs Vertical Deformation (mm) ... 81
Figure 4-10:Eagle Farm: Graph of Distance From Intersection (m) Lane 2 Vs Vertical Deformation (mm) ... 83
Figure 4-11:Eagle Farm: Graph of Distance From Intersection (m) Lane 1 Vs Vertical Deformation (mm) ... 85
Figure 4-12:Eagle Farm: Graph of Distance from Intersection (m) Lane 2 Vs Vertical Deformation (mm) ... 86
Figure 4-13: Graph of % Increase in Shear Stress Verses Surface Stress ... 88
Figure 4-14: 276 kPa Vertical Stress and 0 kPa Horizontal Stress ... 90
Research 4111/4112
5
List of Tables
Table 2-1: Elastic properties of thin asphalt wearing surfaces ... 15
Table 2-2: Typical base and subbase design parameters ... 16
Table 2-3: Elastic properties of typical subgrade materials ... 18
Table 2-4: Typical heavy truck tyre contact stresses ... 30
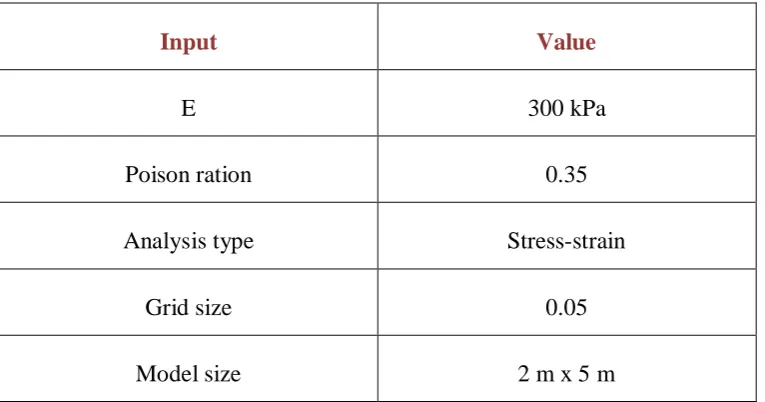
Table 3-1: Indicative heavy vehicle group volumes for lightly-trafficked urban streets 53 Table 3-2: Parameters used in the homogenous material model ... 56
Table 3-3: Vertical stress and Mu scenarios analysed in SIGMA/W ... 60
Table 3-4: Parameters used in idealised pavement model ... 61
Table 3-5: Vertical stress and Mu scenarios analyzed in idealized SIGMA/W model .. 61
Table 3-6: SIGMA/W simplification ... 62
Table 4-1: Ride-ability of roads ... 66
Table 4-2: Manipulated data points ... 69
Table 4-3: Vehicle count for Mica Street, Wacol ... 70
Table 4-4: Vehicle count for Acanthus Street, Darra ... 74
Table 4-5: Vehicle count for Lavarack Avenue, Eagle Farm ... 79
List of Appendices
Appendix A – Project Specification ... 99Appendix B - Archerfield Lane 1-L Photos ... 101
Appendix C - Archerfield Lane 1-R Photos ... 103
Appendix D - Archerfield Lane 2-L Photos ... 105
Appendix E - Archerfield Lane 2-R Photos ... 107
Appendix F - Darra Lane 1-L Photos ... 109
Appendix G - Darra Lane 1-R Photos ... 111
Appendix H - Darra Lane 2-L Photos ... 111
Appendix I - Darra Lane 2-R Photos ... 115
Research 4111/4112
6
Appendix K – Eagle Farm Lane 1-R Photos ... 119
Appendix L – Eagle Farm Lane 2-L Photos ... 121
Appendix M – Eagle Farm Lane 2-R Photos ... 123
Appendix N – Wacol Lane 1-L Photos ... 125
Appendix O – Wacol Lane 1-R Photos ... 127
Appendix P – Wacol Lane 2-L Photos ... 129
Appendix Q – Wacol Lane 2-R Photos ... 131
Appendix R – Wacol Lane 2-R Photos ... 133
Appendix S – Wacol Lane 2-R Photos ... 135
Appendix T – Project Plan ... 137
Research 4111/4112
7
Chapter 1
Introduction
This project studies the effects that surface shears, caused by the acceleration and
deceleration of vehicles, have on the performance on flexible pavements. The
development of these forces are well recognised in current design and pavement
documentation however, little information on the magnitude and there consequential
effect on pavement performances exists. There is also little written in current design
documentation on how to calculate surface shears and specifically how to detail the
entire pavement profile in areas that experience high surface shear.
Research in this area has been carried out to understand and model the complexity of
the stresses developed at the tyre-pavement interface. Vertical pavement response and
layer interfaces responses to surface stresses has also be studies to some depth.
However, one area that requires further research is the effect that surface shears have
on pavement performance. No field studies could be found identifying deformation
patterns in flexible pavement within areas of high surface shears. The following
section provides an overview of the project aim, objectives, methodology and
Research 4111/4112
8
1.1
Overview
The project aim is to study the effect of surface shear on the performance of flexible
sealed pavements in the Brisbane area by looking at the appropriateness of current
design methods through the collection of pavement data and theoretical analysis.
Heavy vehicles accelerating and decelerating are recognised as generating the largest
surface shears at the pavement-tyre interface and as such the magnitude of these forces
are determined and investigated throughout the study. The study looks at surface
shears developed at the tyre-pavement interface in an attempt to expand on the
knowledge of the effect that surface shears have on pavement performance. Pavement
data is collected from a number of sites by identifying crack and defect patterns within
the investigated area.
Background information on pavement and pavement material will be discussed
followed by a literature review of tyre-pavement interaction with a focus on vertical
and horizontal stress imposed onto the pavement from heavy vehicles changing speed,
pavement response to repetitive loading and likely deterioration mechanisms. Review
of pavement design looks at the consideration of shear forces, caused by the
acceleration and deceleration of vehicles, at intersections and the consequential detailed
design procedures to accommodate for these forces ensuring satisfactory performance
over the pavement design life. Vertical and horizontal stress state levels at the interface
are predicted by reviewing theoretical and experimental research, and the values
imputed in a developed FEA model using the program SIGMA/W. Pavement response
to fatigue and the shakedown effect from long term loading is discussed as the primary
Research 4111/4112
9
1.2
Goals
The goal of the project is to collect field data in areas where high surface shears are
generated and to investigate the effect of resulting shear stress on pavement
performance. Field data include a collection of short video clips of vehicles
approaching and going away from each intersection, photographic records along the
horizontal alignment within each wheel track and crack and defect assessment along
over the pavement surface. General site photos are also taken identifying site features.
Traffic counts carried out note the type and frequency of vehicles. Pavement design
information from Main Roads and Brisbane City Council (BCC) is also included.
The next goal was to undertake a parametric study using the Finite Element Analysis
(FEA) program SIGMA/W analysing the linear response to a range of surface stresses
identified above. By inputting different vertical, and ratios of horizontal to vertical tyre
pressure into SIGMA/W the stress distribution and consequential effect that the surface
shears have on the pavement was examined.
The final goal is to composed and examined both field and theoretical information to
identify the effect that surface shears have on pavement performance. One of the
strengths of the project is that it draws on both practical and theoretical data when
analysing and concluding the findings.
The project is also aimed at establishing if sufficient consideration and design detailing
is included in current design documentation and to provide recommendations on
pavement design regarding shear forces and the improved detailing of pavement
profiles.
The project is constrained by time, meaning that only a limited number of intersections
have been examined. Considering the huge number of intersection in Australia of all
different ages and designs the confidence level of the findings are debatable, however
Research 4111/4112
10
1.3
Objectives
There is a need in current design documentation to consider the effect that high surface
shears have on the entire profile, not just in the wearing surface. Current design
documentation (i.e. Austroads) identifies that areas of high surface shear do exist and
explicitly design the wearing surface to resist these forces. However, no design
recommendations are provided for the lower pavement layers. This means that current
design does not account for the effects of high surface shears on the pavements
unbound layers, or the base, sub-base and subgrade materials. Project objectives
include recommendations to optimise current pavement design in areas of high surface
shear in order for the pavement to reach the design life with tolerable deterioration
requiring only standard planned maintenance and restoration at the end of life.
Recommendations will be easy to adapt to current design procedures making any
implementation simple and attractive.
1.4
Methodology
In order to study the effect that surface shear have on pavements four sites were chosen
in areas that experience high surface shears and exhibited some degree of pavement
deterioration. Areas where a high percentage of heavy trucks travels on the road (i.e.
industrial subdivisions) were selected, and design and performance information
collected from a combination of local government resources and site investigations.
RoadTek and Main Roads Queensland (MR) were contacted to obtain pavement
construction, design and maintenance records. Design procedures were reviewed and
comparisons made with current practice, identifying if designers followed current
practice and if any consideration were given the high surface shears likely to be
Research 4111/4112
11
Literature on pavement design, the interaction at the tyre-pavement interface and
pavement performance was reviewed in order to identify stress levels and deterioration
mechanisms in areas of high stress. Reviewing pavement design was needed to identify
the extent that the documentation considers horizontal stresses in current design
practice and also the assumptions it makes regarding the tyre-pavement contact area
and stress. It was important to identify likely stress levels at the tyre-pavement
interface in order to conduct relevant parametric studies. Finally the literature review
identified likely deterioration mechanisms with areas of high surface stresses and
helped in analysing field data.
Following the literature review a parametric study looks at different combinations of
vertical and horizontal stress on a homogenous soil and the effect that increasing the
horizontal component has on the soil. The analysis uses a 2D static, linear elastic
model using a roller traveling in the Y direction. An idealised pavement model is also
built and analysed.
Lastly, the results of the fieldwork, research and parametric study are used to assess the
effects of surface shear on the selected pavements. Cumulating the practical and
theoretical data, an attempt is made to identify patterns in areas of high surface shears
assessing the effects of high surface shears on pavements. Based on the finding of the
above mentioned, recommendations are provided on the suitability of current design
practice and construction methods.
1.5
Conclusion
Material and loading simplification adopted in current pavement design provides the
designer with a simple recipe to follow for specifying materials and profiles for all
types of condition. It is suggested that the simple recipe may be lacking where
Research 4111/4112
12
The project offers an insight into the extreme surface stress experienced by pavements
Research 4111/4112
13
Chapter 2
Background
2.1
Pavements
The following section provides a brief introduction to pavements. A typical flexible
pavement structure generally comprise an asphalt surface layer underlain by unbound
granular material, typically comprising of base and sub-base gravel layers, which are
placed on top of a weaker subgrade strata. A typical pavement profile with stress
distribution is shown in Figure 2-1 below. The main purpose of the pavement material
is to provide a bridging layer (or protection) over the weaker subgrade strata and to
provide a long term trafficable profile satisfying serviceability requirements, structural
integrity, ride quality, skid resistance, surface noise and low maintenance.
Research 4111/4112
14
Higher quality material is placed at the upper pavement layers providing protection, or
bridging, to the lower weaker layers. The higher quality materials have a higher shear
strength and modulus of elasticity helping to dissipate the surface loads as they travels
through the pavement providing some protection to the lower weaker layers.
Permanent strain can in theory be limited under repetitive traffic loads.
Asphalt is used as the pavement wearing surface with aggregates typically occupying
85% of the total volume with 10% bituminous binder, 5% filler and 5%air voids
making up the mix. The mix is designed on likely traffic conditions with differing
proportion and particle size distributions of aggregate, binder and filler providing
different levels of structural stiffness, deformation resistance, permeability, surface
texture and durability. Commonly used gravel mixes, as shown in Figure 2-2 below
(including usage), include Dense Graded Asphalt (DGA), Open Graded Asphalt
(OGA), Stone Masonic Asphalt (SMA) and Fine Graded Asphalt (FGGA) (Austroads
guide to pavement technology: Ashphalt 2007, p. 10).
Research 4111/4112
15
Engineering properties of the asphalt used in design are principally stiffness under
moving loads (transient), resistance to fatigue and excessive deformation under
repeated loading. According to Austroads, elastic response of asphalt under loading is
dependent on the stiffness of the binder, inter-particle friction of the aggregate and
volumetric composition of the compacted mix. However, other factors that influence
performance are temperature, load cycles and frequency of loading, recovery
(dependant on temperature), rate of loading and construction technique (Thom 2008, p.
136).
This means that asphalt properties can change on a daily (even hourly) basis, making it
difficult if not impossible to model providing a sound reason for simplifying material
properties in the design process. Typical asphalt design parameters for elastic analysis
taken from Austroads: Guide to Pavement Technology is shown in Table 2-1 below:
Table 2-1: Elastic properties of thin asphalt wearing surfaces
Elastic Properties Thin asphalt layer
Range of Poisson ratio (v) 0.25 - 0.45
Modulus of elasticity MPa (E) 2500 - 50001
Typical Poisson ratio (v) values used 0.4
Typical Modulus of elasticity (E) values 35001
1
At 25oC
Gravel is used under the asphalt wearing surface providing additional protection to the
subgrade. The main function of the gravel layers is to provide sufficient stiffness to
Research 4111/4112
16
where excessive permanent deformation is avoided. This gravel is manufactured from
crushed rock and is often used for both the base and sub-base pavement strata. Higher
quality material is placed closer to the surface. Specifications such as particle size
distribution (or grading), durability, soundness and texture requirements ensure that the
material in-service behaviour and performance can be somewhat predicted.
In the Brisbane region, the base and sub-base materials typically comprise of quarried
basaltic gravel material. Sealed base course Californian Bearing Ratio (CBR)
minimum values of 80% are used while typically CBR values of between 25% to 45%
are used at the sub-base level (Austroads guide to pavement technology: Structural
design 2007, pp. 57, 64). Layer thickness is dependent on subgrade strength but
usually has a maximum box of around 500 mm (Austroads: Pavement Structural
Design pg. 161). The engineering properties of gravel used in design are principally
stiffness under moving loads (transient) and resistance to deformation under repeated
loading. Similar to asphalt gravel properties are dependent on external and internal
factors such as rate and magnitude of loading, material properties and moisture content.
Simplified parameters make design and modelling of gravel easier. Typical base and
sub-base design parameters under thin asphalts surfaces for elastic analysis taken from
AusRoads: Guide to Pavement Technology (Austroads guide to pavement technology:
Structural design 2007, p. 51) is shown in Table 2-2 below:
Research 4111/4112
17
Underlying the gravel layers is the weaker (protected) subgrade generally comprising
of natural or fill material with CBR values less than 15%. Subgrade performance is
mostly a function of vertical loading factors such as frequency, rate of loading and
loading magnitude. If the pavement performs as designed, the subgrade is protected
from significant stresses both in the vertical and horizontal direction. Surface shears
generated at the tyre/pavement interface are typically considered neglectable between
300 mm and 500 mm depth at the sub-base/subgrade interface. This is due to the
stiffness of the full depth of pavement materials allowing stress to dissipate throughout
the pavement. Consequently it is thought by designers that surface shears have little
impact at the subgrade level.
The subgrade play a major role in pavement design and proper evaluation of the
material is critical to the performance of the pavement. The subgrade strength in
Australian design procedures is the determining factor for determining the thickness,
composition and performance of the pavement material (Austroads guide to pavement
technology: Structural design 2007, p. 46). In most cases this strata is complex and
variable. The use of simplified subgrade design parameters, from imperial tests such as
the California Bearing Ration test (CBR), allow designers to make decisions on the
upper pavement layers using these results in conjunction with estimated traffic loading.
Knowledge of subgrade materials should include stiffness parameters, variations from
moisture content (MC), reaction to loading and limiting values (Austroads guide to
pavement technology: Structural design 2007, p. 85). Understanding subgrade
material properties are therefore critical in the pavement design process. It is worth
mentioning again that in pavement design high surface shears are not considered to
significantly increase the stress levels at this layer and consequently do not contribute
Research 4111/4112
18
however, some typical pavement design parameters taken from the AusRoads Guide to
Pavement Technology are shown in Table 2-3 below:
Table 2-3: Elastic properties of typical subgrade materials
Material Typical young’s modulus values
Typical Poisson ratio (v)
Clay Soils 35 - 100 0.45
Sandy Soils 50 - 1000 0.45
In summary two fundamental areas in which soil behaviour affects pavement
performance are stiffness under moving loads (transient) and resistance to deformation
under repeated loading. Bitumen-bound materials have the added property required for
design of fatigue characteristics (Thom 2008, p. 5). Stresses are dissipated through the
stronger surface material (asphalt and base courses) protecting the subgrade from
stresses exceeding that which could cause excessive deformation. Flexible pavements
are therefore generally constructed over a weaker subgrade material using selected
granular material sealed by a high quality wearing asphalt cover.
2.2
Overview of shear force on pavement design
Once subgrade properties have been identified pavement cross sections are designed
based on the anticipated cumulative traffic loading over the design life of the pavement.
Design is simplified by using a single design load and the number of passes of an
equivalent standard axil. The design process considers all types of vehicles and speeds
Research 4111/4112
19
Pavements must confirm to strict geometry and serviceability requirements. Pavements
must be strong enough to cater for the heaviest vehicles and the cumulative effect of all
vehicles over the design life. Austroads ‘guide to pavement technology part 2:
pavement structural design’ details clearly how to design moderate to heavy trafficked
pavements considering standard axils, heavy vehicles and failure mechanisms
(including fatigue). While the development of shear force between the tyre and
pavement interface is recognised, design procedures provides no explicit details and it
is consequently left up to the designer to design for. The effects of shear forces are
again mentioned in section 8 however, states that these forces are only concentrated in
the upper layers and should only be considered when designing the wearing course.
This assertion that shear forces developed at the tyre-pavement interface is only
concentrated in the upper layers and has no significant effect at lower levels is
highlighted in all Austroads publications and most other design (book standards)
publications. Mention of the development of shear forces can be found through the
Austroads publications and comments that they should be considered in the design
process but gives no specific guidance on how to estimate these forces or provides
specific design guidance. However, ‘Ausroads: Guide to Pavement Technology Part
B: Asphalt’ document provides a general guide for the selection of the type of asphalt
mix, nominal size and type of aggregate mix, layer thickness and type of binder based
on traffic loading and conditions. Traffic factors include estimating commercial
vehicle volume, loading, speed and amount of acceleration and braking.
In areas where higher loading and adverse conditions are likely to be encountered, such
as intersection, stiffer mixes with higher air voids are recommended to resist traffic
stress. Stiffer binders, such as types of polymer-modified binders, are recommended to
improved deformation and fatigue resistance (Austroads guide to pavement technology:
Ashphalt 2007, p. 53). The designer of the mix may also specify low binder contents
Research 4111/4112
20
In summary, design of the wearing surface to resist surface shears is covered in most
design procedures. On the other hand design, the effect of high surface shears is
neglected when designing the full depth of gravel and subgrade evaluation.
2.3
Identifying Areas of High surface Shear
In order to identify where the maximum damage is likely to occur as a result of high
surface shears it was important to know where the point of maximum acceleration and
deceleration of the vehicle occurs. One of the difficulties is differentiating between
deterioration caused by slow rates of loading (vehicles traveling at slow speeds or
stopped) and that caused by the acceleration and deceleration of the vehicle. While the
cause of deterioration is different, it is unknown if the type damage would appear
similar. This is why identification of areas of maximum changes of speed is important
when analysing the effects of surface shears on pavements.
Akcelik and Besley (2001) have look at different methods of predicting acceleration
and deceleration patterns including sinusoidal, polynomial and straight-line methods
and conclude that the real life pattern follows an S-shape and best predicted by the
polynomial model. Akçelik and Besley use a polynomial model calibrated to real life
driving to describe the acceleration and deceleration patterns (Akcelik & Besley 2001)
over a 100 m length with beginning and end speeds of 0 m/s, 30 m/s and 60 m/s. Their
research identifies that deceleration rates are generally greater than acceleration and
this gap is even more amplified for heavier vehicles. Observation made, particularly at
the Darra site, confirmed the findings that deceleration of heavy vehicles is larger
(significant larger at the Darra site) than vehicles accelerating.
Hammoum et al (2010) on the other hand argues that the maximum horizontal force is
attained during the first 10 m of acceleration with the rest of the stop start patterns
Research 4111/4112
21
acceleration from a stop occasional jolting forward before acceleration smooths out,
confirming this finding. With the exception of the first 10 m both authors point out that
there can be large variations in real life driving scenarios and that further research in
this area is needed to more accurately predict real life acceleration and deceleration
patterns. However, both authors indicate that the largest change of speed is considered
to be in the approach lane (left), decelerating to a stop and the first 10 m when a vehicle
accelerates from a stop.
It was observations that the distance it takes vehicles to accelerate to the design speeds
or decelerates to a stop increase with increasing vehicle size. Lighter vehicles ,cars and
light trucks (type 1 to 4), generally achieved the design speed between within 100 m of
accelerating while class 9 and 10 vehicles may take up to 150 m or more to reach the
design speed. Similarly, light vehicles may take only 60 m to come to a stop whereas
larger vehicles may take a distance of 150 m or more to come to a complete stop. If we
calculate a heavy vehicle accelerating (or decelerate) linearly at 1.5 m/s2 then it would take 167 m to reach the design speed.
It seems reasonable to conclude the greatest amount of damage resulting from the shear
forces developed from accelerating, decelerating would occur within areas of the great
shear. Comparing pavement damage at different distances in the braking, and
accelerating lane should provide some insight into the likely damage caused by high
surface shears. Using the polynomial model it is expected that the area of highest shear
should be between (say) 30 m and 70 m from the intersection.
2.4
Vehicle Stresses Imposed on the Pavement
Design in Australia (and overseas) use simplified circular tyre contact shape and
uniform vertical pressure for pavement structural analysis. The main reasons for the
Research 4111/4112
22
modelling is made significantly easier and allows designers to design a pavement
considering the loading of a single vehicle type. Accepted confidence levels for
pavement design are generally between 95% and 98%. Meaning that the estimated
performance criteria will be met 95% to 98% of the time.
Austroads generally uses a simplified uniformly loaded circular tyre-pavement contact
area of 750 kPa to design pavements, with the option to vary pressure in extreme
conditions (Austroads guide to pavement technology: Structural design 2007, p. 99).
For the purposes of general design, this method has proved to be a reasonable
assumption with roads in Australia generally performing well. However, while most
roads perform satisfactorily high rates of damage has been observed at intersection
within areas of high surface shear. Indicating that the current simplified assumption
used for most roads may not be appropriate for areas of high surface shear and design
inputs may require revising when designing pavements within these areas of high
surface shear.
From field observation Type 10 vehicles generally have the highest inflation pressure
of around 850 kPa with tyre pressures generally decreasing with decreasing vehicles
size. An exception is in the case of a super single tyre which may have inflation
pressures of up to 1350 kPa. This project will study the effect of conventional sized
vehicles (maximum type 10 vehicles) on pavements.
To propose revisions on current design (if required) understanding the actual stresses at
the tyre-pavement interface is required. Data supports that the contact shape, stress
levels and pressure distribution for heavy vehicles do not match closely with the
simplified assumption used for the standard axil. In fact the variability of stresses
developed for heavy vehicles at the tyre-pavement interface is significant and the
addition of breaking and accelerating only adds to the dynamics. Heavy vehicles in
Research 4111/4112
23
distribution. The following sections discuss the dynamic stresses developed by heavy
vehicles at the tyre pavement interface.
2.5
Vertical Tyre Contact Stress
Actual tyre loading is typically transmitted to the pavement through the tyre ribs and
has a maximum value at the centre of the contact area (Yoo et al. 2006, p. 80).
Research suggests that the maximum stress value for heavy vehicles is at the centre of
the contact area and can be between 20% and 60% higher that the tyre inflation
pressure (Kim 2008, p. 850). If a truck tyre with an inflation pressure of 850kPa is
loaded normally then local stress at the centre of the tyre can theoretically be as high as
1360kPa. However, there are some exceptions like in the case of an
overloaded/underinflated tyre that can have a peak value at the tyre edge of 2 to 3 times
the inflation pressure (M de beer et al. 1999, p. 4). Stress levels are also dependant on
tyre type, age, tread pattern and tyre pressure. Figure 3 and 4 below shows two
examples of measured tyre contact pressure distribution from de Beer et al (1996).
Figure 2-3 is an example of a typical vertical pressure shape. Figure 2-4 is a vertical
tyre pressure with another tyre type (de Beer et al. 1996). It should be noted that peak
Research 4111/4112
[image:29.595.119.483.100.363.2]24
[image:29.595.112.469.409.687.2]Figure 2-3: Typical Vertical Contact Stress
Research 4111/4112
25
Yue and Svec (1995) suggests that provided the surface material is sufficiently stiff
peak stress values will dissipate relatively quickly through the wearing surface and the
response to stress in the lower layer depends mainly on the overall load. The peak
vertical stresses is considered to predominantly affect the performance of the wearing
course provided it is not less than about 40 mm thick. If the wearing course is greater
than about 40 mm, peak values nearly dissipated by the time they reach the
asphalt-base interface and the stress distribution become similar to a normal stress
distribution shape (Yue & Svec 1995, p. 858).
An interesting finding found, was that stress levels at the asphalt-base interface were in
fact lower when using the actual tyre stress distribution patterns then when compared
with using a uniform contact pressure (Siddharthan et al. 2002, p. 140). Indicating that
the use of the conventional even stress distribution pattern is slightly conservative.
Simplifying pressure distribution is therefor considered to be a suitable assumption and
no coefficient increasing the model stress would be needed to compensate this
simplification.
Another factor affecting vertical contact force is changing load distribution between
axils as a result of changing speed. This dynamic force increase with increasing
changes in velocity, and with low rates of changes in speed the peak values are more
pronounced and maintain the peak value for longer (Zuo et al. 2006, p. 8). When a
truck changes speed the load redistributes between the axils creating a peak value (this
is actually quite dynamic) at the rear wheel in the case of accelerating and at the front
wheels when decelerating. If we assume a maximum acceleration and braking of
between 1.5m/s2 and 3 m/s2, then interpolating the graph of force vs. deceleration (Zuo et al. 2006, p. 11) and using measured changes in vertical force from Hammoum et al
(Hammoum et al. 2010, p. 1261) peak vertical forces can be 5% to 10% of the vertical
force compared to when the vehicle is static. For example, a static tyre contact force of
35,000 kN may peak at between 36750 kN and 38750kN when the vehicle changes
Research 4111/4112
26
It‟s assumed that this increase in axil load would cause a corresponding increase in the
tyre contact area resulting in the contact pressure staying relatively similar with
possibly only minor increase in the peak value.
Travelling at a constant speed also imposes a degree of dynamics in the loading.
Papagiannakis and Masad (2008) use a coefficient of (vertical) variation (CV)
depending on suspension type to account for the dynamic variation at a constant speed.
With a vehicle traveling at 60 km/hr CV is in the range of 5.7% for (air-spring
suspension) and 8.7 (rubber spring suspension) while variation of tyre loads from
changing speed vary between 0.5% and 6.5% (Papagiannakis & Masad 2008). Vertical
pressures are dynamic and may range between 0.5% and 10% of the static load when
the vehicle changes speed.
The relatively high and dynamic truck loads may in fact give reason to modify the
design vehicle in areas where these vehicles are likely to traffic the pavement. Perhaps
an extreme design (truck) vehicle load could be developed with consideration to
increase the force by 5% to 10%.
2.6
Longitudinal tyre pressure
The longitudinal (along the vehicle travel direction) tyre contact pressure is dependent
on factors similar to the vertical contact pressure (Hu & Walubita 2011, p. 253).
Traditionally the longitudinal tyre pressure is considered small in comparison to
vertical tyre pressure and consequently it is assumed to not have a significant influence
on pavement performance (Hu & Walubita 2011, p. 251). This assumption is clearly
evident in the Austroads Guide to Pavement Technology and other design documents
Research 4111/4112
27
A vehicle travelling approximately 60 km/h exhibits a maximum longitudinal force of
about 12 % of the maximum vertical force (Siddharthan et al. 2002, p. 5). While this
value may not have a significant impact on pavement performance, it has been shown
that shear forces resulting from vehicles accelerating and decelerating with a tyre
pressure of 850kPa can in fact reach up to 39 % of maximum vertical force at the
braking wheels (Hammoum et al. 2010, p. 1261). A typically loaded truck, in theory,
could therefore apply a longitudinal force of 332 kPa or more (0.39 x 850 kPa) to the
pavement surface. Figure 2-5 and 2-6 below shows two examples of measured
longitudinal contact pressure from vehicles travelling at a constant speed (de Beer et al
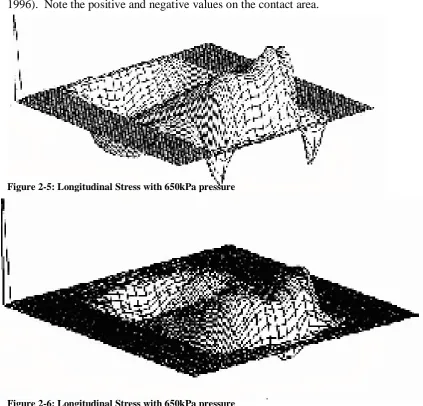
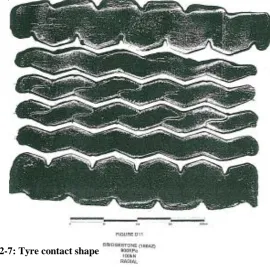
1996). Note the positive and negative values on the contact area.
[image:32.595.108.532.299.705.2]Figure 2-5: Longitudinal Stress with 650kPa pressure
Research 4111/4112
28
Considering the relatively large vertical tyre pressure of trucks and the shear stresses of
up to 39% (figures above show 10% -12% ) of the vertical force it seems reasonable to
assume that this increase in surface stress could affect pavement response below the
asphalt. The purpose of this project is to study the effect that different rations of
surface shear have on the performance of pavements.
2.7
Tyre Contact Shape
Tyre-pavement contact shape for truck tyres has been shown to be more rectangular
that circular (Kim 2008). Once again, the contact area is dependent upon axil load, tyre
inflation pressure, tyre type, age of tyre etc. The consequence in the structural analysis
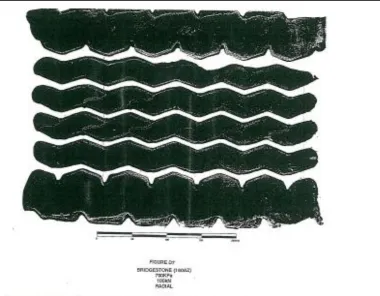
of the pavement between a rectangular and circular contact shape is minimal. Figure
2-7 and 2-8 below show two examples of the tyre contact shape measured by de Beer et
[image:33.595.147.418.418.685.2]al (1996):
Research 4111/4112
[image:34.595.126.507.92.388.2]29
Figure 2-8: Tyre Contact Shape
2.8
Tyre Load Conclusion
The tyre stresses applied to the pavements surface are complex and vary depending on
factors such as type of tyre, age of tyre, tread pattern etc. Pavement response to the
stresses is also complex and dependant on many factors such as construction techniques
and material properties. Theoretical tyre stresses imposed onto the pavement surface
Research 4111/4112
30
Table 2-4: Typical heavy truck tyre contact stresses
Typical Vertical Truck Tyre Contact Pressure (kPa)
Maximum Longitudinal (shear) stress (kPa)
450 - 850 175 - 332
Super single tyre loads can be up to 1350kPa but infrequently travel on roads and
consequently are not considered in this project.
2.9
Pavement Damage
Types of damage that can occur in pavement material include cracking of asphalt and
vertical and horizontal displacement of the pavement layers. As discussed above the
wearing surface should be designed with surface shear in mind and hence be somewhat
resilient to shear damage. Any premature damage to occur in the asphalt will likely be
from poor design, mixing or construction. Furthermore, any displacement in the
asphalt is likely to be relative to the layer thickness. For example, a 40 mm compacted
asphalt layer if put under extreme condition may settle 0.5 % to 1%, or 2 mm to 4 mm.
Lower gravel materials on the other hand are designed for repetitions loading of the
standard axial.
Displacement under repetitive loading is helped explained by „shakedown theory‟.
This considers the initial stress state of the material and repetitive loading. Under small
repetitive loads, the pavement is likely to have an elastic response and have no
permanent horizontal displacement. If loads are increased the pavement material
develops small levels of permanent strain, but movement soon settles down and no
Research 4111/4112
31
limited slipping. If loads increase further the shakedown limit may occur and usually
results in continual movement followed by racketing.
Plastic shake down is predicted for most roads and is considered to be the likely failure
mechanism in the investigated pavements. An example of strain from under repetitive
loading can be seen in Figure 2-9 below (Austroads A Guide to Pavement Technology:
[image:36.595.94.490.282.498.2]Structural Design pg. 53).
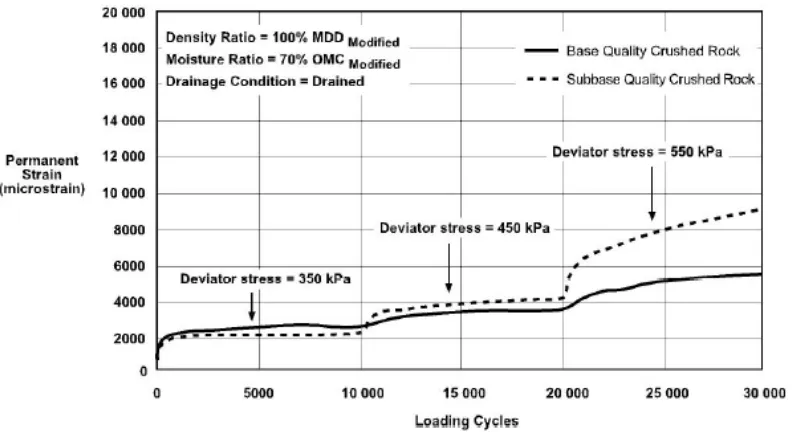
Figure 2-9: Example Relationships Between Permanent Strain and Loading Cycles
Strain in the first two stages of testing would be considered in the plastic shakedown
range. In the third stage, 550kPa the shakedown limit is reached and the strain
Research 4111/4112
32
Chapter 3
Research Design and Methodology
The design and methodology component of the research project was shaped so that the
information collect would come from different sources and could be compiled to
provide a moderate degree of certainty in the results. Chapter three describes the three
sets of data that were collected for the project. The data sets include a literature review,
field measurements and observations, and a parametric study. The chapter begins by
describing the rationale and limitations behind the literature review and discussing the
need for the background study, the need to obtain realistic parameters subsequently
used in the parametric study and likely failure mechanisms for increases in pavement
traffic and loads. The next section describes the rational, limitation and methodology
used for the collection of field data and observations. Locations and details of site
specific features of the roads are included in this subsection. Following is a description
of the parametric study using the finite element analysis program SIGMA/W. This
includes verification of the model, model inputs and parameters used. Finally, the
research design and methodology chapter is concluded.
Research 4111/4112
33
3.1
Literature Review
3.1.1 Rational
The purpose of the literature review was to study the complex interaction between the
tyre and pavement, to identify likely pavement failure mechanisms and to obtain real
life pavement parameters consequently used in the SIGMA/W model. Pavements are
designed based upon certain simplified assumptions, mostly conservative, that are used
to model the tyre pavement contact stress distribution and shape. Considering, that the
actual stress behaviour and pavement characteristics are considerably complex and
dynamic, the adoption of a simple model to base pavement design on seems reasonable
and in the most part has performed well.
However, there are some exceptions where these assumptions have proven to be
lacking. One example is in the approaches to bridges where roads are usually
moderately sloped, have slower loading rates and trafficked by all types of vehicles
(Class 1 to Class 10 typically). Under these conditions the likelihood of pavement
failure has been observed to increase and consequently different design assumptions
and considerations are now adopted for the design of bridge approaches.
It could be argued that pavements at signalised intersections undergo the same set of
external conditions. Namely relatively large surface shear and lower rates of loading
then conventional roads. Austroads do in fact recognise that relatively higher surface
shears are developed when vehicles accelerate/decelerate at signalised intersection and
within areas that are trafficked by heavy vehicles. However, Ausroads also assume that
these forces are quickly dissipated in the surface asphalt material and consequently do
not significantly increases stresses within the pavement gravel or subgrade and
Research 4111/4112
34
In cases where the design engineer considers that large surface shears are likely to
occur higher quality asphalt (or asphalt constitutes and thickness), with no
improvement to the gravel base material or increase in box depth, is recommended.
One of the focuses of the project is to investigate the assumption that surface shears are
dissipated within the asphalt and high surface shears do not affect that pavement
performance.
Another objective of the literature review was to collect information regarding the
tyre-pavement interaction and to obtain tyre-pavement material parameters subsequently use in
the parametric study. In order to develop a relevant FE model the characteristic of the
tire-pavement interaction needed to be known. Actual surface stress developed
between the tyre, pavements were determined from previous research carried out by
DeBeer (1996), and included direct stress measurements imposed by the tyre onto the
pavement and pavement reaction stresses. By identifying the pavement response to
increase in both horizontal and vertical stresses it was hoped that the effect (from a
theoretical perspective) of high surface shears could be revealed and the values
obtained would consequently be used in the parametric study.
3.1.2 Limitation
The main objective of the literature review was to obtain information relevant to the
project and in turn add confidence to the findings. Limitation of the literature review
comprised time constraints and restrictions to relevant research.
Regarding time constraints, the literature review and fieldwork needed to be almost
completed within one semester. Only a limited amount of research could be completed
within this time frame. While the allocated 90 hours may seem like a long period of
time, it is considered to be inadequate to comprehensively research the topic. As any
Research 4111/4112
35
journals and papers trying to find nuggets of information to support an idea or theory.
Once one finds the answer they are looking for, this commonly leads to another
question equally important and opens up ideas to other important research avenues.
To help offset the limitations imposed by the time constraints, the literature review
scope was narrowed down to a few defining topics that would provide the most
worthwhile information relevant to the project. By concentrating on a select number of
topics directly related to the project topic it is considered that the findings in the
literature review provides some level of confidence.
Another limitation was the restricted access to relevant journals. Some research
pertaining to the effects of surface shear on pavements could only be accessed through
purchasing the articles at full price, and as this project has no direct funding the option
to not purchase the articles was made. While other research very closely related to the
topic were carried out in China, and in turn were written in Chinese. While access to
these articles and the ability to read Chinese may have slightly to moderately improved
the quality of the literature review, access to many other peer reviewed articles equally
as important were found to lessen the effect of the restrictive access to a limited number
of articles.
3.1.3 Literature Review Summary
The background information collected is considered to have a moderate level of
significance to the project resulting in a moderate level of confidence in the findings.
While certain limitations such as time constraints and restrictions to certain articles may
have reduced the value of the information, each limitation was partially offset by
Research 4111/4112
36
3.2
Field Data and Observation
The object of collecting field data was to gather uncontrolled data in areas that
experience high surface shear and to inturn identify patterns, if any, of pavement
deformation and / or failures within these areas. Five types of field data were collected;
these were 1) photographs of vertical deformation, 2) short movies that record vehicles
travelling along the length of road, 3) defect assessment, 4) vehicle counts and 5) the
collection of pavement design data.
3.2.1 Rational
The objective of the project is to study the effects of surface shear on pavements. To
achieve a higher level of confidence in the conclusion three data sets were collected.
One data set, and probably the most relevant, was the field data. Much has been
written about the interaction between the tire and pavement under a moving load and
equally, the amount of theoretical research papers and controlled experiments found
during research was large. However, no real life evaluation of pavements could be
found directly relating to the project topic. This is not to say that the studies do not
exist, but rather that the number is limited.
For example De Beer et al has done extensive research on tyre pavement contact stress
and has developed measuring devices within the pavement and on tyre suspension, to
achieve the highest level of confidence in his results. Evidence of his research can be
found in many scholarly journals. Hammoum‟s et al work was an excellent field study
measuring vertical and horizontal stresses of accelerating and decelerating tramways
(rubber tyres and asphalt roads). A final example of relevant research was that found in
the Ausroads publication between permanent strain and loading cycles. While each of
Research 4111/4112
37
real life data was found on the performance of pavements under non-controlled
conditions.
Clearly one of the strengths of the research project is the comparison of non-controlled
field data to both parametric and theoretical data. The project was able to compare the
results of what is supposed to happen (theoretical) to what actually happens in the field
(practical). The parametric study confirms that an increase in surface shear results in
an increase in shear stress developed within the pavement. The literature review reveal
that stress at a certain limit may cause elastic shakedown and the result of and the field
study shows that areas of high surface shear have greater vertical deformation when
compared to areas that experience normal loading conditions.
The below section describes the fieldwork methodology used to collect the field data.
3.2.2 Methodology
Field data comprised a collection of photographs along a length of pavement, a series
of short movies of vehicles trafficking the road, pavement defect mapping and the
collection of pavement design data from the relevant council. As identified in the
background study, the area‟s most likely to be effected by high surface shears are the
areas where acceleration/deceleration is highest. In the case of a vehicle traveling at a
speed of 60km/hr this area is likely to occur between 30 m and 70 m from a signalised
intersection. To focus on areas that experience the highest surface shear the field data
was collected from approximately 0 m to 120 m from each chosen intersection.
Photographic data was collected at 4 m to 5 m intervals along this length of road with
distances measured by stepping. Prior to taking the photographs the most frequent
wheel paths were identified by observing vehicles driving on the length of road and
Research 4111/4112
38
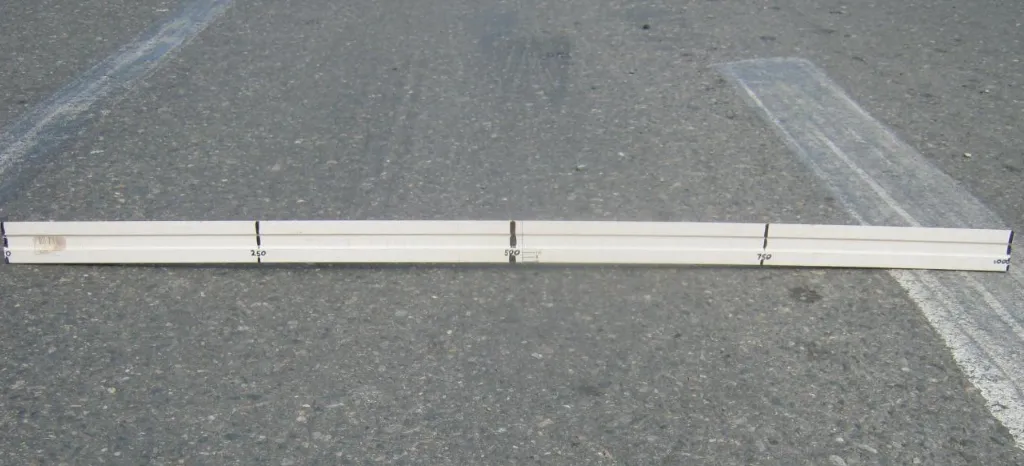
The photographs were taken of a 1 m long straight edge paced horizontally at each
interval along the wheel tracks. Once taken the photographs were examined for
deterioration patterns and the vertical deformation measured.
Vertical deformation was, to some degree, estimated from the markings on the straight
edge. Different lighting conditions and angles (that the photos were taken at) made it
difficult to accurately determine the vertical deformation between the straight edge and
the pavement surface. However, this inadequacy was offset through consistency in the
readings by using the same analyser to interpret all results. To help partially offset this
limitation, the zoom function was used to measure deformation at each location.
Although measurement would have been more accurate if recorded in the field, this
would have meant that the time spent on the road recording data needed to be increased
considerable. This in turn would have increased the risk to an unacceptable level.
Figure 3-1 below shows a typical photograph taken from the field investigation. All
[image:43.595.58.570.435.668.2]other photos can be seen in Appendix A to R.
Research 4111/4112
39
Next, movies of vehicles trafficking the site were recorded. In the approach direction
the camera was set up near the intersection. Recordings commence prior to the
vehicles initial deceleration (usually when the vehicle come in the line of sight) and
continue until passing the camera or in some occasions the camera follows the vehicle
around the corner. In the away direction, the camera was set up approximately 150 m
from the intersection to capture the vehicle accelerating up to the design speed of
60 km/h. Most recordings are less than one minute in length while longer recording
show consecutive vehicles travel the road. The movies were then examined to
determine braking and acceleration patterns and in conjunction with the photographs
and pavement analysis used to determine if a link exists between areas that experience
relatively high surface shears and additional deformation.
One of the interesting points to note is that when changing up a gear the vehicle is in
angel gear between changes, and when the next gear is engaged there is a brief point
where acceleration is relatively dynamic. Also, when the vehicles first disengage gears
there tends to be a brief redistribute of load to the front axil, as identified in the
literature review. A good example of this pattern of acceleration can be seen in Movie
M2O00461. This response to gear changes was the most dynamic action the vehicles
experienced.
Observed traffic braking and accelerating patterns were used to determine if the
patterns identified in the background study hold true. The level of accuracy in
determining braking patterns is wholly dependent on the competency of the observer
and as such would have a varying degree of confidence based on the experience of the
observer. It is considered however, that while speeds may be somewhat difficult to
estimate with any degree of certainty, patterns of heavy vehicles accelerating and
decelerating can be easily recognised. Visual observation included the estimation of
the braking including noticing when braking starts and finishes by observing the brake
Research 4111/4112
40
Determining the braking patterns of patterns of heavy vehicles was also made easier as
„engine brakes‟ are used during moderate to heavy braking. For example, when the
engine brake is engaged, the „roar‟ of the engine indicates the level to which the brake
is being applied. The louder the noise the heavier the brake is being applied. This
allowed not just visual assessment of braking but also hearing assessment, and in turn
made the assessment of braking patterns considerably easier and more accurate.
Vehicle counts and classification were then carried out in accordance with „AusRoads:
Pavement Structural Design‟. This data was then used to calculate the annual average
daily traffic for each road. It should be noted that when estimating the AADT, counts
were only taken over a time period of approximately 1 hour and correction for daily
and seasonal variations have been estimated and consequently, should be considered as
a very rough estimate only. The vehicle classification system adopted was taken from
Ausroads „Guide to Pavement Structural Design 2010‟ and is shown in Figure 3-2
Research 4111/4112
[image:46.595.156.453.123.494.2]41
Figure 3-2 Ausroads vehicle class (pg. 85)
An additional assessment of the roads included defect assessment and a drive-through
to assess drivability. Visual assessment of the pavement defects helps to explain
irregularities in the field results and to provide justification for the manipulation of
data. The visual assessment involved visually identifying defects, taking measurements
and photographing the defect and was carried out in accordance with Ausroads ‘guide
to pavement technology part 5: pavement evaluation and treatment design‟. The
Research 4111/4112
42
incoming and outgoing lanes. A simple rating assessing the ride quality was given to
each road. The rating was between 1 and 5 with 1 being the worst indicating a bumpy
ride and 5 being a relatively smooth ride. It was also based on the consideration that all
industrial roads should perform adequately, and so a rating of 1 does not indicate that
vehicles bounce uncontrollable like when four-wheel driving. But that the ride is
relatively bouncy.
3.4
Selected Roads
Four signalised intersections were chosen for the research project. Each road had a
60 km/hr speed limit. The main criteria for selecting the intersections were that they
needed to have a high percentage of heavy vehicles. Consequently, all intersections
were selected within industrial subdivision within and around the Brisbane area. Each
site had different features (i.e. slopes, approaches and signalisation) resulting in
different braking patterns and braking intensities subsequently providing different
ranges of horizontal to vertical tyre pressures (Mu).
While the ranges of Mu cannot be estimated with any degree of certainty each road has
been comparatively ranked (with each other) to indicate the likely level of Mu acting as
an aid when analysing the results. Further, it is considered that increasing Mu values
indicate increases in the peaks of stresses during dynamic loading. Thus the selection
of roads provides a range of site conditions that are able to be compared to the different
scenarios considered in the parametric study.
Figure 3-3 below shows where the sites are located in relation to each other and within
Research 4111/4112
[image:48.595.116.532.99.475.2]43
Figure 3-3: Road location plan
The below subsection describes the main features of each road with an aerial picture of
the investigated shown.
3.4.1 Mica Street, Wacol
The corner Mica and Cobalt Streets is located within the Wacol industrial subdivision
approximately 18.5 km southwest of Brisbane. The intersection is controlled by
untimed traffic lights with Mica Street being relatively level in both the investigated
Mica Street
Lavarack Avenue
Acanthus Street
Research 4111/4112
44
area and the approach. As shown in Figure 3-4 below the approach to the intersect