The Longer Term Impact of
Capacity Building in ESF
Evaluation of Objective 3
Priority 4
R
E S E A RC H
Helen Judge and Haris Martinos - LRDP
Kevin Maton - UK Research Partnership
Research Report No 287
The Longer Term Impact of
Capacity Building in ESF
Evaluation of Objective 3 Priority 4
Helen Judge and Haris Martinos – LRDP Kevin Maton - UK Research Partnership
The views expressed in this report are the authors' and do not necessarily reflect those of the Department for Education and Skills.
© Queen’s Printer 2001. Published with the permission of DfES on behalf of the Controller of Her Majesty's Stationery Office. Applications for reproduction should be made in writing to The Crown Copyright Unit, Her Majesty's Stationery Office, St Clements House, 2-16 Colegate, Norwich NR3 1BQ.
TABLE OF CONTENTS
Executive Summary
1. INTRODUCTION ... 1
1.1 Background and aims of Priority 4 ... 1
1.2 Rationale and beneficiaries ... 1
1.3 Orientation and implementation... 2
1.4 Interim evaluation... 3
1.5 Specific questions for the current evaluation... 4
1.6 The 2000-2006 Objective 3 Programme ... 4
2. EVALUATION METHODOLOGY ... 6
2.1 Introduction ... 6
2.2 Key tasks... 6
3. ORIENTATION TO THE REMAINDER OF THE REPORT ... 10
4. BENEFICIARIES, ACTIVITIES AND OUTPUTS OF PRIORITY 4 PROJECTS... 13
5. OUTCOMES AND IMPACT... 19
5.1 Internal capacity building for voluntary and community organisations... 19
5.1.1 Client groups reached... 19
5.1.2 Understanding clients better... 24
5.1.3 Economic development and labour market orientation... 25
5.2 Improved capacity to work with ultimate beneficiaries... 27
5.2.1 The role of Priority 4 in increasing access to ESF ... 27
5.2.2 Access to ESF among Priority 4 IBOs ... 27
5.2.3 Capacity to access other funding ... 32
5.2.4 access to ESF for ultimate beneficiaries... 33
5.2.5 Addressing gaps identified at the start ... 35
5.3 Has the capacity of IBOs improved in other ways? ... 37
5.3.1 Internal capacity building for voluntary and community organisations ... 38
5.3.2 Voluntary sector Infrastructure ... 39
5.4 Has capacity building led to improved outcomes for ultimate
beneficiaries ... 42
5.4.1 Final claims analysis of outcomes... 42
5.4.2 Questionnaire and case study analysis of outcomes ... 49
5.4.3 What outcomes for the most disadvantaged people: ... 50
5.4.4 A long-term pathway to the labour market and building social capital ... 51
6. SUSTAINABILITY OF PRIORITY 4 BENEFITS... 53
7. CAPACITY BUILDING IN THE NEW PROGRAMME AND ACCESS TO ESF... 57
7.1 Introduction ... 57
7.2 Measurement of capacity building... 57
7.3 Global grants and co-financing... 58
8. CONCLUSIONS AND RECOMMENDATIONS ... 59
8.1 Conclusions... 56
8.2 Recommendations ... 61
1 1. INTRODUCTION
1.1 Background and aims of Priority 4
The 1997-1999 European Social Fund Objective 3 Programme in Great Britain introduced a new priority – Priority 4 – called Enhancing the Capacity for Community Development.
This is the report of a longer term impact evaluation of Priority 4 which has been carried out by Local and Regional Development Planning (LRDP) and the UK Research Partnership (UKRP) between December 2000 and April 2001.
The aim of Priority 4 was to build the capacity of organisations that could reach and deliver support to the client groups of the Objective 3 programme.
Broadly speaking, these clients were young and adult unemployed people who were known as the Objective 3 target groups. Several sub-target groups were listed in the programme. They included the following:
♦ people with no up to date, relevant qualifications;
♦ young people with no work experience at all;
♦ school leavers aged under 18 who are not in employment or education;
♦ the long-term and very long-term unemployed;
♦ those aged over 50;
♦ disabled people (including those with health or learning difficulties);
♦ minority ethnic groups;
♦ people who need training in English or Welsh as a second language;
♦ homeless people;
♦ ex-prisoners and offenders;
♦ single parents and those with caring responsibilities;
♦ returners who have been out of the labour market for at least two years;
♦ people living in rural areas;
♦ people with literacy and numeracy problems;
♦ people who have lost their jobs in large scale redundancies.
In the long term, Priority 4 was intended to contribute to a process of addressing labour market disadvantage among these groups.
1.2 Rationale and beneficiaries
The rationale for introducing Priority 4 was twofold:
1. some among the disadvantaged target and sub-target groups of the Objective 3
2
2. some of those organisations that could reach and deliver to the target groups were not
themselves gaining access to the Objective 3 programme. These organisations required capacity building in order that they could more effectively reach and deliver to the target groups; and in order that they could access ESF.
The Single Programming Document (SPD) for Objective 3 in Great Britain 1997-1999 stated that Priority 4 would develop “the appropriate structures to guarantee effective delivery of projects for the target groups listed under Priorities 1, 2 and 3” (the priorities that directly deliver training and other employment related support to the target or sub-target groups).
It makes clear that the immediate beneficiary organisations (IBOs) will be “the regionally
and locally-based organisations delivering support to target groups” and that “capacity building involves assisting [these] organisations to develop their own capacity to deliver projects for the target groups. This involves providing support to develop the skills of individuals within these organisations as well as improving organisational structures and processes themselves”.
These IBOs could themselves be the applicants for funding, but in many cases they were not. In other words, many projects involved a large voluntary sector organisation or local authority, for example, building the capacity of a range of smaller – typically – voluntary and community organisations.
Applicants and IBOs could be from the public or voluntary and community sectors, but particular importance was attached to securing the involvement of those that are “close” to the target and sub-target groups. Closeness implies understanding, representativeness and participation.
The ultimate beneficiaries of Objective 3 Priority 4 were to be the target and sub-target groups themselves – those individuals that are disadvantaged in the labour market.
1.3 Orientation and implementation
In 1996 the DFEE, on behalf of the Objective 3 Monitoring Committee, commissioned a Study to inform the implementation of Priority 4 which considered further the meaning of capacity building in the context of Priority 4. The main output of this Study, the Orientation
Report1, defines capacity building as “an enabling and empowering process that seeks to
improve the effectiveness of responses to economic, employment and social problems by the people and communities experiencing, or closest to those experiencing these problems”.
The report makes clear that capacity building is not a synonym for community development, but is additional to it. It also states that: “since [Priority 4] forms part of the Objective 3 programme, its ultimate objective is to enhance capacity such that it leads to labour market
1 Enhancing the Capacity for Community Development under the GB Objective 3 SPD 1997-1999: Orientation
3
integration. Its more immediate objective is to facilitate a route to labour market integration
by guaranteeing support for the most disadvantaged individuals under the first three priorities of the SPD”. Priority 4 is thus not about community development or regeneration in its general sense.
A range of capacity building needs and potential types of action were identified in the Orientation Report and set out in the guidance notes. They included: training; advice and information; organisational mentoring; study visits and exchanges; employment of new staff or secondments; facilitating or resourcing of networks and partnerships; auditing, profiling, research and analysis; publicity, guides and manuals; establishment of new systems; small grants; and development work.
Implementation of Priority 4 began towards the end of 1997, although many projects did not get off the ground until well into 1998. In 1997/98, 498 projects were funded, several of which continued in 1999. In 1999, 413 projects were funded.
1.4 Interim evaluation
In 1999, an interim evaluation of Priority 4 was carried out2. Its principal focus was the
experience of Priority 4 in 1998 although it also examined some developments in 1999. This evaluation identified, among other things, that:
1. Priority 4 was engaging organisations that could work with the most disadvantaged and
was starting to improve their capacity;
2. there was often at least another level of organisations between the IBOs and the ultimate
beneficiaries. These could be described as the indirect, or secondary beneficiary
organisations (SBOs). Capacity was starting to flow to these organisations;
3. it was not clear whether capacity building was having a positive impact on the ultimate
beneficiaries – the unemployed people. This was partly because capacity building is a long-term process, but also because the link between projects and labour market disadvantage was commonly more implicit than explicit;
4. there was confusion about the extent to which capacity building was intended to increase
access to ESF among those organisations working with the target and sub-target groups.
The evaluation concluded that there should be some increase in access.
2 Capacity Building in ESF: Evaluation of Objective 3 Priority 4. Helen Judge and Haris Martinos, LRDP, and
4
1.5 Specific questions for the current evaluation
Following on from this, the specific questions that have been identified for this evaluation are:
1. has the capacity of IBOs increased such that they are able to work better with ultimate
beneficiaries?
2. has the capacity of IBOs improved such that they are able to apply for ESF to work
directly with ultimate beneficiaries (as opposed to capacity building for their organisation)?
3. has the capacity of IBOs improved in other ways?
4. have the above factors led to improved labour market outcomes for the ultimate
beneficiaries?
As well as enabling us to look back at the experience and achievements of Priority 4, the evaluation also has considerable potential use in the future, not least in the new Objective 3 programme.
1.6 The 2000-2006 Objective 3 Programme
A new Objective 3 programme commenced in the year 2000, which will run until 2006. This programme does not include an explicit capacity building priority or measure but does
provide for capacity building action.
The 2000-2006 programme is structured around the five policy fields of the revised ESF, rather than the traditional approach of priorities equating to target groups (ie Priority 1 for adult unemployed and Priority 2 for young unemployed).
The Community Support Framework (CSF) for Objective 3 in Great Britain 2000-2006 makes suggestions for appropriate types of actions under each policy field, and under two fields there is explicit mention of capacity building.
Policy Field 1: Active Labour Market Policies suggests as a type of action:
To build the capacity of local partnerships
♦ encouraging local partnership approaches to intermediate labour market projects,
including support for capacity for community development.
Policy Field 2: Equal Opportunities for all and promoting social inclusion, includes
Develop local responses to local needs with one potential specific action being:
♦ building capacity for local development and for community delivery. Building durable
5
Under the auspices of the CSF there are separate programmes for each of England, Scotland and Wales. Each of these offers scope for a more specific capacity building focus, and English regions were also encouraged to identify a focus for capacity building actions.
The CSF states that capacity building “should build on that introduced to the programme in 1997 as a route to integration”.
6
2. EVALUATION METHODOLOGY
2.1 Introduction
The specific questions for the current evaluation have been set out in Section 1.5, above. Since this is a longer term impact evaluation, the emphasis is on the benefits felt by IBOs following their participation in capacity building activity and how this has impacted on their work with unemployed people. Where relevant, we have also examined the extent to which capacity has reached and impact on the secondary tier of beneficiary organisations referred to in Section 1.5.
2.2 Key tasks
Analysis of applications and final claims data
We analysed:
♦ applications data for Priority 4 projects in 1999. This assisted in the selection of case
study projects and enabled us to obtain an overview of implementation of the Priority in that year. Analysis of 1998 data was carried out for the interim evaluation;
♦ applications and final claims data for all projects in 1999. This enabled us to identify
whether Priority 4 applicants and IBOs had proceeded to access the other priorities of Objective 3 directly, the beneficiaries that they were reaching and the outcomes achieved. It also meant that we could summarise outputs for Priority 4 itself in 1999;
♦ applications data for the year 2000. This enabled us to establish to some extent whether
Priority 4 applicants had accessed Objective 3 directly in the new programme. However, limited data was available at a central level for the year 2000 at the time of analysis and we could therefore only cross check applicant organisation names manually against Priority 4 applicants in 1998 and 1999. We did, however, approach regional partners for information to supplement our results, providing a greater insight into the sorts of organisations that had applied for Objective 3 for the first time in the year 2000, the issues and gaps.
Twelve case studies
We selected twelve case study projects in five regions, namely: the East Midlands, the North West, Scotland, Wales and Yorkshire and the Humber. These include regions that have placed a strong focus on capacity building in the new Objective 3 Programme (eg East Midlands and Scotland). Case studies included some applicants and IBOs that have progressed to access ESF for the first time directly. The overwhelming majority were voluntary sector, reflecting the overall spread of Priority 4.
7
Seven of the twelve projects were case studies for the interim evaluation and we felt this offered significant benefits, principally that we already had a good understanding of these projects and baseline information on them.
Interviews took place on the following levels:
♦ project managers and staff (applicant / deliverer of capacity building);
♦ consortia where applicable;
♦ IBOs;
♦ indirect beneficiary organisations (next level “down” from IBOs – where applicable);
♦ ultimate beneficiaries (individual clients).
Interviews took place in individual and one-to-one settings, typically involving two days spent with projects.
Comparison group
We also interviewed a number of IBO equivalent organisations that had not accessed Priority 4 support. The purpose of this was to contribute to a greater understanding of what Priority 4 offers that is additional to support obtained elsewhere, and how other organisations might have benefited from involvement if at all. In particular, we wanted to establish what enabled organisations to become involved in the Objective 3 programme with and without capacity building.
The selection of such a group was complex. It was achieved through discussion with case study projects themselves and with regional partners and comprised a combination of organisations that might have taken part in a case study project but for various reasons did not; and those that had applied for ESF for the first time in 1999 or 2000 both successfully and unsuccessfully.
Regional and national level consultations
Consultations took place with regional partners in group settings in each of the selected regions, and included a combination of sectors and in several cases Priority 4 project promoters. In some instances, these were followed with individual consultations. This has informed understanding of the benefits of Priority 4 in the longer term, likelihood of sustainability and actual and potential contribution of capacity building to the current Objective 3 programme.
8 Questionnaire survey
We surveyed through a short questionnaire (attached at Annex 2) a sample of 1054 IBOs
accessed through a sample of Priority 4 project managers as well as umbrella bodies in some regions. The questionnaire was tested with a small number of applicants and IBOs and a key regional umbrella body and amended in line with their suggestions.
We achieved a sample of 222 – a response rate of 21.1 per cent. Responses were analysed using the Statistical Package for Social Scientists (SPSS).
In our experience, this response rate is normal for a survey of this type, and our findings are statistically robust. Because there is little statistical information in the DfEE’s own database about the nature of IBOs, it is not possible to assess scientifically how closely the survey respondents mirror the overall pattern of IBOs.
However, as far as we can tell from our understanding of Priority 4 IBOs gained from both this and the interim evaluation, the achieved sample is representative of the totality of Priority 4 IBOs in respect of sector, type of organisation and client groups served.
[image:12.595.73.495.467.737.2]The respondents to the IBO survey are predominantly from the voluntary sector (65.8%) and community sector (15.6%). In terms of their client groups, at least a quarter of the organisations in the survey identified each of the different target and sub-target groups of Objective 3. The only exceptions were people with English as a second language (15%), Welsh as a second language (4%) and ex-offenders (13%).
Fig. 1: Which of the following best describes the sector your organisation fits into?
Source: questionnaire
voluntary 65% other
public sector 2% other
2%
FE/HE 2%
voluntary and community 9%
data missing 2%
community 15%
local authority 3%
FE/HE
voluntary and community voluntary
other public sector other
9
The overwhelming majority of questionnaire respondents are from the voluntary and
community sectors (almost 90%). This is shown in figure 1. The 9% classed as voluntary
[image:13.595.79.505.210.461.2]and community sector are those that ticked both options. More than a fifth of respondents are also umbrella organisations that serve other voluntary and community organisations (VCOs) (figure 2).
Fig. 2: Is yours an umbrella organisation that serves other voluntary and community organisations?
Source: questionnaire no
78%
yes 21% data missing
1%
10
3. ORIENTATION TO THE REMAINDER OF THE REPORT
This short section of the report orientates the reader towards the main findings presented in the rest of the document.
Organisations Assisted By Priority 4 and outputs
The report proceeds in Section 4 to summarise the sorts of organisations that Priority 4 has
assisted, showing that:
♦ they are predominately local and neighbourhood based;
♦ the vast majority are new to the Objective 3 programme;
♦ a relatively significant percentage (20% of questionnaire respondents) also have no paid
staff, according to the findings of the questionnaire.
This shows an immediate achievement for Priority 4 in respect of contributing to community development and involving new groups in ESF.
Based on final claims data, Section 4 sets out the outputs that have resulted directly from Priority 4 projects. They include:
♦ a wide range of training activities and advice sessions;
♦ 1789 new partnerships and 1914 new networks formed as a result of 1999 activity;
♦ 2,770 organisations have received small grants;
♦ just under 19% of questionnaire respondents received a grant for staff costs.
This analysis, however, confirms the findings of the interim evaluation that Priority 4 involved a core group of active beneficiary organisations and a much wider group that received perhaps one off advice or a leaflet.
Outcomes and impact
Section 5 of the report is concerned with outcomes and impact and is structured around the key questions of the evaluation.
11
In general, Priority 4 has contributed significantly to increasing understanding of Objective 3 client groups among beneficiary organisations.
Section 5.2 examines access to ESF resulting from Priority 4, for both IBOs and ultimate beneficiaries. It finds quite substantial evidence that access to ESF among Priority 4 IBOs has increased, and that this has had an effect on the level of access among certain client groups. However, firm conclusions about the extent to which Priority 4 has helped address gaps in access for clients identified as inadequately served at the regional level are inhibited by a lack of analysis at that level, and we recommend that this is addressed in the current (2000-2006 programme).
Section 5.3 focuses on other ways in which capacity building has improved. It establishes that the biggest benefit of Priority 4 has been better developed and established voluntary and community organisations with more effective structures and systems. Throughout the report, we make the point that such internal capacity building is seen to be a necessary prerequisite to effective work with the most disadvantaged client groups of the Objective 3 programme. This is particularly important where infrastructure for community development is lacking, whether it be for communities of place, or communities of interest.
There is some evidence that this internal capacity building, and the development of voluntary
and community sector infrastructure, is leading to better service for smaller organisations and for the client groups. We conclude that capacity building focused on internal development and infrastructure should continue where the need is clearly evidenced, with more effort made to define clear outputs and outcomes from this process. Such outcomes could include business planning, internal systems and better developed partnerships that will benefit the client groups organisations.
In Section 5.4, we find some evidence that Priority 4 is leading to improved labour market outcomes for ultimate beneficiaries. However, although this is a longer term impact evaluation, the full impact of capacity building on many individuals has yet to be felt.
The case studies suggest that outcomes are likely to be improved and provide some examples of where this has already happened, but because we have also found that clients of Priority 4 projects tend to be among the more disadvantaged, softer outcomes and measurement of distance travelled is also important.
Section 6 finds evidence that the benefits of Priority 4 should be sustainable, although slightly less so where staff have been employed and funding has run out.
Looking forward
Section 7 reviews arrangements in the 2000-2006 Objective 3 programme and their implications for capacity building.
12
13
4. BENEFICIARIES, ACTIVITIES AND OUTPUTS OF PRIORITY 4 PROJECTS
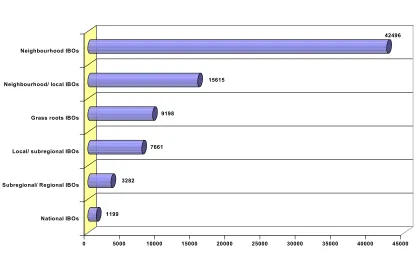
[image:17.595.79.498.220.480.2]Priority 4 supported 79,451 IBOs in 1999 alone, an average (rounded mean) of 131 per applicant and reached a significant number of neighbourhood and grass roots level organisations. Judging by the questionnaire findings, many of these could be small community groups with no paid staff. The overwhelming majority of IBOs had never had Objective 3 before.
Fig. 3: Number of IBOs who received Priority 4 funding
Source: 1999 Objective 3 final claims data
Figure 3 summarises the numbers of beneficiary organisations (IBOs) at each of a series of levels, that have been supported through Priority 4 in 1999. It is based on final claims data for 607 projects funded in that year.
The total number of IBOs supported in itself represents a significant achievement, though a note of caution should be sounded for two reasons. First, the total and the average are pushed up by the presence of a number of projects whose beneficiary numbers were unusually high: one said they had 4,500 neighbourhood IBOs and another that they had 2000 sub-regional or regional level IBOs. Secondly, analysis for both the current and interim evaluations noted that applicants tended to overestimate the number of IBOs. A group of active participants could often be distinguished from a wider group of more passive recipients of help. The active group might, say, have attended workshops, received ongoing advice, pursued achievement of a quality standard or been involved in a mentoring programme. The wider group could perhaps have received a newsletter produced through the Priority 4 project, benefited from one off information given in a phone call or attended a meeting. Some organisations would include among their IBOs the totality of their mailing list.
1199 3282
7661 9198
15615
42496
0 5000 10000 15000 20000 25000 30000 35000 40000 45000
14
On the other hand, the benefits of capacity building have spread to a wide range of contacts beyond the core group of active beneficiaries. The Scottish Council for Voluntary Organisations (SCVO) for example, have produced a Quality Standards Framework that is useful to all Councils for Voluntary Service (not only the seventeen that remained active participants in its capacity building project). The Big Issue in the North Trust have
developed as a result of their project a fortnightly publication called the Source which briefly
summarises press articles pertinent to those working on unemployment and disadvantage and whose circulation far exceeds those immediately involved in their capacity building activity.
The most commonly supported category by far is neighbourhood level organisations, followed by neighbourhood/local. The number of grass roots level organisations reached, at
9,198, is also significant. This shows that Priority 4 has been effective in reaching those that
are closest to the ground, and that experience suggests tend to be closer to the most disadvantaged people.
The extent to which capacity building under Priority 4 has reached the grass roots is borne
out by an important questionnaire finding: 20 per cent of respondents said they had no paid
staff (figure 4).
[image:18.595.77.503.487.742.2]These findings are also similar to the position identified through the interim evaluation carried out in 1999 and based on 1998 projects. It showed a preponderance of grassroots/neighbourhood and neighbourhood/local organisations, with 59.8% of all projects aimed at small community organisations, 34.1% at local umbrella organisations and 34.5% at larger community organisations.
Fig. 4: Does your organisation have paid staff?
Source: questionnaire
yes 80% no
20%
15
The almost certain implication is that several projects have engaged small community organisations, several of which may be embryonic. Even among those that do have paid staff, numbers are relatively small. The median number of paid staff is four, and the mode number is one.
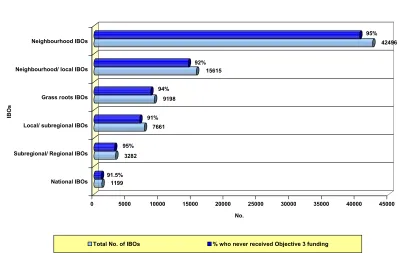
Priority 4 has also engaged substantial numbers of IBOs that have never had Objective 3 funding before. The 1999 final claims data shows that at every level, more than 90 per cent
of IBOs were in this category. This is shown in figure 5. Even at the level of organisations
[image:19.595.81.497.260.513.2]serving a wider geographical area, or a potentially bigger client group (national and regional level organisations), the numbers that have had prior involvement in Objective 3 is minimal.
Fig. 5: Percentage of IBOs who had never before received Objective 3 funding
Source: 1999 Objective 3 final claims data
In the 1999 interim evaluation of Priority 4, we found that over one third of applicants to
Priority 4 (36.7) were first time applicants, and that in some regions this rose to well over 40% (in the Eastern region it was actually 53.7%). We also concluded from our case study analysis that the “vast majority of IBOs had no experience of accessing ESF.” This finding is fully substantiated by the current evaluation.
In Section 5, we examine the extent to which Priority 4 IBOs have proceeded to become involved in direct delivery under Objective 3 and assess what impact this has had on their client groups. Suffice to conclude at this stage that it is unlikely to be appropriate for significant numbers of the smallest organisations to access Objective 3 directly.
1199 91.5%
3282 95%
7661 91%
9198 94%
15615 92%
42496 95%
0 5000 10000 15000 20000 25000 30000 35000 40000 45000
No. National IBOs
Subregional/ Regional IBOs Local/ subregional IBOs Grass roots IBOs Neighbourhood/ local IBOs Neighbourhood IBOs
IBOs
16
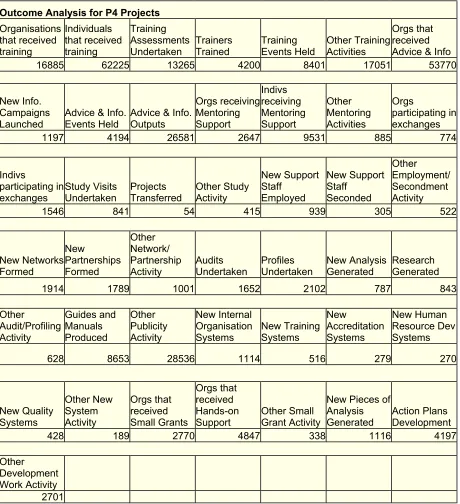
Fig. 6: Summary of outputs of Priority 4 in 1999
Outcome Analysis for P4 Projects
Organisations that received training Individuals that received training Training Assessments
Undertaken Trainers Trained Training Events Held Other Training Activities
Orgs that received Advice & Info
16885 62225 13265 4200 8401 17051 53770
New Info. Campaigns Launched
Advice & Info. Events Held
Advice & Info. Outputs Orgs receiving Mentoring Support Indivs receiving Mentoring Support Other Mentoring Activities Orgs participating in exchanges
1197 4194 26581 2647 9531 885 774
Indivs
participating in
exchanges Study Visits Undertaken Projects Transferred Other Study Activity
New Support Staff Employed New Support Staff Seconded Other Employment/ Secondment Activity
1546 841 54 415 939 305 522
New Networks Formed New Partnerships Formed Other Network/ Partnership
Activity Audits Undertaken Profiles Undertaken New Analysis Generated Research Generated
1914 1789 1001 1652 2102 787 843
Other Audit/Profiling Activity Guides and Manuals Produced Other Publicity Activity New Internal Organisation Systems New Training Systems New Accreditation Systems New Human Resource Dev Systems
628 8653 28536 1114 516 279 270
New Quality Systems Other New System Activity Orgs that received Small Grants Orgs that received Hands-on
Support Other Small Grant Activity
New Pieces of Analysis
Generated Action Plans Development
428 189 2770 4847 338 1116 4197
Other
Development Work Activity
2701
Source: 1999 Objective 3 final claims data
Figure 6 summarises the activities undertaken through Priority 4, based on 1999 final claims data on outcomes from projects.
17
The high number of organisations shown by the final claims data to have received advice or information (53,770) is likely to reflect a high number of one-off, or less active participants receiving advice perhaps in a telephone call or group setting. The final claims data shows
that 4194 advice and information events were held, whilst there were 26,581 advice and
information outputs.
Case study analysis shows that most projects benefited from more than one type of activity. This reflects the findings of the 1999 interim evaluation which showed that all case study projects were involved in at least three categories of activity. And as would be expected, training and advice were by far the most common among all 1998 projects: 80.9% benefited from training, and 79.5% from advice and information provision.
Some other significant findings from the analysis of 1999 final claims outcome data and
shown in figure 6 include that:
♦ 1789 new partnerships and 1914 new networks have been formed as a result of 1999
activity;
♦ 2,770 organisations have received small grants;
♦ 1116 new pieces of analysis have been generated;
♦ 4197 action plans have been developed
♦ 2,647 organisations have received mentoring support;
♦ 4847 organisations have received hands on support.
It is not possible to deduce from this information the characteristics, for instance the sex, of individuals who have been involved in Priority 4. Outputs from the other priorities of Objective 3 are usually broken down according to the gender of beneficiaries. In the case of Priority 4, actions are principally directed towards organisations, but where there are individuals involved (for instance staff employed or training trained) the information is not disaggregated in this way.
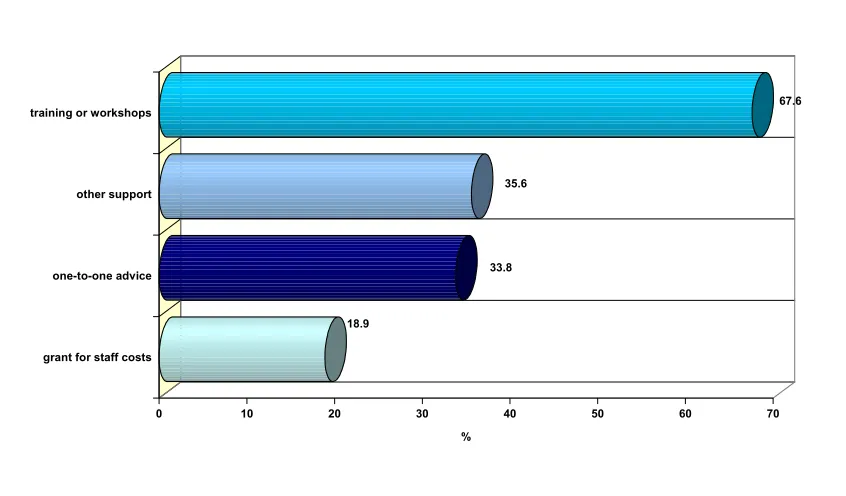
Among our survey respondents, more than 67 per cent participated in training or workshops, whilst a third got one to one advice. Just under 19 percent benefited from a grant for staff
18
Fig. 7: Which of these best describes the nature of capacity building support you received through Priority 4?
Source: questionnaire
In subsequent sections of the report, we review the relationship between activities and outcomes.
DfEE0039a
18.9
33.8 35.6
67.6
0 10 20 30 40 50 60 70
% training or workshops
other support
one-to-one advice
19
5. OUTCOMES AND IMPACT
5.1 Has the capacity of IBOs increased such that they are able to work better with ultimate beneficiaries?
Our primary concern in this evaluation is whether the benefits of capacity building are reaching unemployed people (ultimate beneficiaries, or the target and sub-target groups of the Objective 3 Programme).
There are a number of ways in which capacity to work with ultimate beneficiaries could improve. They include:
♦ reaching a new client group;
♦ understanding the client group better;
♦ delivering more effective and more labour market oriented support.
The following sub-sections will examine the extent to which Priority 4 has brought about improvements in each of these respects.
5.1.1 Client groups reached
Existing clients of Priority 4 IBOs
In order to establish whether IBOs are better able to work with the ultimate beneficiaries, we must look at whether they are working with these groups in the first place, and/or whether they have reached new groups.
IBOs are working with all the client groups of the Objective 3 programme, according to the evidence from the questionnaire, case study interviews and final claims forms. And the case studies suggest that they are working with those who are disadvantaged among these groups.
20
Fig. 8: Which of these best describes the people with whom your organisation mainly works?
Source: questionnaire
The vast majority of organisations are working with more than one client group (164 out of 222): the mean number of groups targeted is five and the median number is four.
Experience shows that organisations commonly tick a range of boxes in keeping with the inclusiveness of their approach. In the questionnaire, we tried to encourage respondents to
indicate groups with whom they mainly work, but sometimes the number of clients worked
with in a particular group may be small (for instance homeless people or those experiencing mental ill health, where the needs of these groups are not a particular focus for the organisation).
More than a third of organisations say they are working with only one or two client groups (figure 9) although a third of non-umbrella organisations say they are working with between five and ten. As might be expected, umbrella organisations are more likely to be working with more than ten client groups.
However the analysis of final claims data for 1999 suggests that projects involving organisations who have had capacity building support under Priority 4 (IBOs) are more likely to be working with significant numbers among the “sub-target groups” of the Objective 3 programme than those that do not involve Priority 4 IBOs. This is discussed in Section 5.2.
4.1 15.3 17.1 21.6 23 23.4 27.5 30.2 31.1 31.5 32 34.2 37.4 39.6 40.1 41 44.6 45
0 5 10 15 20 25 30 35 40 45
%
21
Fig. 9: Number of client groups worked with by umbrella and non-umbrella Organisations
Source: questionnaire
Among the case study projects, five are working very directly with the most disadvantaged people, either as the applicant and main IBO or as part of a consortium that directly involves the client group. Examples include the Big Issue in the North Trust that works directly with homeless people, and the Wales based Menter Fachwen project that works with people with learning difficulties. These and two other projects work with one, clear primary client group. In two cases it is clients with learning difficulties, in one case those who are homeless and vulnerably housed and in the forth case disadvantaged young people.
However, the likelihood is that clients face multiple disadvantage and fall into more than one “category”. For instance the survey of vendors (those who sell the Big Issue Magazine) carried out by the Big Issue in the North Trust for the year 2000 showed that as well as being homeless, 44% described themselves as having a disability or long term illness; at least 57% have drug problems; 71% have not had a formal paid job for at least two years and 40% have not worked for five years.
In five further case study projects, the majority of IBOs are working very directly with the most disadvantaged and indeed in three cases, IBOs are principally comprised of the client group. Examples include CETA (Community Enterprise and Training Association), a Derby-based organisation working with minority ethnic groups. In this case, there is one primary client group although IBOs work with a range of different minority ethnic groups.
In two case study examples, the ultimate beneficiaries are geographical communities of interest where clients are excluded or at risk of exclusion. Some IBOs (who have also been instrumental in the development of the project), however, are also thematically focused on specific communities of interest. An example is the Scotland-based Poverty Alliance project
34% 35% 15%
19%
28%
33% 17%
12%
0% 5% 10% 15% 20% 25% 30% 35%
1 to 2 3 to 4 5 to 10 More than 10
22
in which one IBO works with minority ethnic groups whilst the others are geographically focused on communities experiencing poverty.
In the remaining cases, IBOs are a combination of umbrella organisations for other VCOs (or secondary beneficiary organisations) and those that work directly with the client groups.
There is evidence that IBOs – where they are not themselves directly working with the client
group - have sought to engage secondary beneficiary organisations with a direct link to those
that are disadvantaged and excluded. For example Stewatry CVS, a beneficiary of the SCVO voluntary sector infrastructure capacity building project, held roadshows on Objective 2 and 3 funding for those working these client groups; and Edinburgh Voluntary Organisations Council (EVOC) ran training workshops for such organisations in Social Inclusion Partnership areas.
In the majority of case study projects, therefore, some direct link to the ultimate beneficiaries is clear. In the remainder, the link involves a tier of IBOs and one of secondary beneficiaries; there are longer term benefits to ultimate beneficiaries resulting from improvements to the internal capacity of these organisations, and to voluntary sector infrastructure.
IBOs reaching a new client group
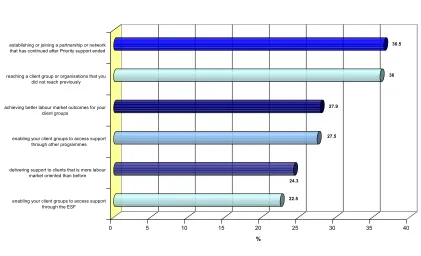
[image:26.595.78.499.486.742.2]Over a third of questionnaire respondents say capacity building under Priority 4 has helped them to reach a new client group or group of organisations that they did not reach previously. This is shown in figure 10.
Fig. 10: Can you say whether you feel that Priority 4 has helped you in any of the following ways?
Source: questionnaire 22.5
24.3
27.5 27.9
36 36.5
0 5 10 15 20 25 30 35 40
%
establishing or joining a partnership or network that has continued after Priority support ended
reaching a client group or organisations that you did not reach previously
achieving better labour market outcomes for your client groups
enabling your client groups to access support through other programmes
delivering support to clients that is more labour market oriented than before
23
Examples from case study projects evidence this. Cardiff based Vision 21, for instance, that works with people with learning difficulties is discussing widening its range of client groups and a new project called Bold is looking to engage people who have a border line learning difficulty (and who would not therefore normally gain from social services’ support) and those who are recovering from mental illness.
The North Nottinghamshire College Bassetlaw Coalfields Enhancing project indicated that access to a number of more vulnerable client groups had improved as a result of Priority 4 support, including: homeless people; those with mental health issues; those suffering various forms of addiction; and adult males.
This project, in common with a number of others, was particularly concerned with the establishment of and support to new and embryonic community groups to enable a better represented and more empowered community.
The Menter Fachwen project used Priority 4 to employ a volunteer co-ordinator, whose role included facilitating access to support through Menter Fachwen for community groups. As a result, such access has increased substantially and several new groups and outreach FE providers are now more involved with the organisation.
According to case study evidence, the most marked increase in those reached is among umbrella organisations working with other VCOs. In these instances, mailing lists have multiplied, new organisations have attended workshops and received advice and contact with many has been maintained. In the case of Edinburgh Voluntary Organisations Council, membership increased from 220 to 300 as a result of participation in the capacity building project, and several hundred more organisations have been identified. The vast majority of
these are not social care organisations, whilst existing members tended predominately to
work in that field.
24
Fig. 11: Has Priority 4 funding helped you in any of the following ways?
Nature of support received Training or workshops (n=150) One-to-one advice (n=175)
Grant for staff costs (n=42)
Other support (n=79)
Reaching client groups or organisations not previously reached
39.0% 43.8% 64.3% 43.6%
Delivering support to clients that is more labour market oriented than before
31.0% 34.2% 35.7% 24.7%
Achieving better labour market outcomes for your client group
34.5% 37.0% 45.2% 28.6%
Enabling your client groups to access support through the ESF
29.0% 24.7% 31.0% 1.3%
Enabling your client groups to access support through other programmes
33.3% 30.6% 40.5% 38.2%
Establishing or joining a partnership or network that has continued after Priority 4 support has ended
41.1% 46.6% 50.0% 41.6%
Source: questionnaire
5.1.2 Understanding clients better
For those organisations working directly with unemployed people, it was not usually an objective to reach a new group, but rather to increase understanding and effectiveness of work with the existing group. In general, the depth of organisations’ understanding about those with whom they work has improved.
Case study projects provide evidence of this. One of the clearest examples comes from the Big Issue in the North Trust. This organisation used Priority 4 funding to carry out research into the needs of vendors of the Big Issue magazine, all of whom are homeless or vulnerably housed.
25
Citizens’ Juries were used to give vendors an opportunity to question expert witnesses about what would make better drug support services. The research contributed to the development of a three-stage programme geared towards addressing the life skills and employability of vendors. The project was based on the premise that a more holistic approach towards employability was required, with the chances of a vendor getting and sustaining a job based not only on their vocational skills but on their accommodation, drug use, general mental and physical well being and life skills.
Among questionnaire respondents, a third feel that they understand better the needs of the clients or organisations with whom they work as a result of Priority 4.
There are also examples of projects that have influenced provision among statutory sector providers to reflect a better understanding of the needs of the client group. For instance a local college was involved with the Lincoln Voluntary Sector consortium project. The FE sector in the area had traditionally offered standardised products not always appropriate to community organisations and groups: attention to location, content, assessment method and length were all needed. Examples of refined approaches include:
♦ using a verbal assessment instead of a written one for a catering course aimed at homeless
people – some of whom could not read or write;
♦ delivery of courses in the community rather than college locations;
♦ provision of short, day time courses for volunteers.
In some cases, clients themselves have observed positive change. Menter Fachwen beneficiaries noted improvements to the organisation since it had received support from Priority 4. One person who was on placement there felt it was now a pleasure to work at the project, with environment much livelier and more going on.
5.1.3 Economic development and labour market orientation
Many of the organisations that work with the most vulnerable and excluded people do not focus on helping them to get jobs or access training, and neither are they sufficiently linked into the networks that will enable them to do so. On the other hand, employment and training organisations are not traditionally geared towards working with the most disadvantaged clients.
Preparatory work carried out with grass roots organisations in the East Midlands revealed a preponderance of groups with little or no economic development ethos.
26
Figure 10, on page 22, above, shows that 24.3% of respondents feel that Priority 4 has helped them to deliver support to clients that is more labour market oriented than before.
27
5.2 Has the capacity of organisations improved such that they are able to apply for ESF?
5.2.1 The role of Priority 4 in increasing access to ESF
Priority 4 was developed partly in recognition that some of the most disadvantaged people were not getting access to ESF, and was intended to guarantee effective support to the programme’s target and sub-target groups.
There are two main ways in which this might have occurred: first, by new organisations themselves getting access to deliver support to their clients (the ultimate beneficiaries of Priority 4); and secondly by Priority 4 enabling their clients to get ESF support through other organisations.
There was always some confusion about whether Priority 4 was intended to increase access among a host of new organisations – principally in the voluntary and community sectors. We have seen in Section 4 that many of those benefiting from Priority 4 have been small grass roots and neighbourhood-based VCOs with few or no paid staff who would be almost certain to struggle with ESF. However, our conclusion is that some new organisations should get into the programme and many others should be able to link with partners that can manage a project to facilitate access for their clients.
5.2.2 Access to ESF among Priority 4 IBOs
Priority 4 has increased access to ESF among its IBOs according to our analysis of case study projects, the questionnaire and final claims data.
Final claims data
The 1999 final claim form asks whether any organisation involved in the delivery of a project has previously benefited from capacity building under Priority 4. A total of 160 organisations said yes. This figure is considerably higher than we might have expected and may be slightly misleading for a number of reasons. First, eighty of the organisations answering yes to this question were actually applicants to Priority 4 in 1999 themselves. This suggests that they were running a Priority 4 project and a project under another priority at the same time, but it does not necessarily mean that capacity building under Priority 4 has helped them get access to ESF. Secondly, a Priority 4 IBO may have only a very minor role in delivery, and thirdly, the question may have been misunderstood.
There are some limitations to the data available to us at this time that mean we cannot carry out a full analysis linked to this finding. For instance, we cannot identify how many of those involved in a project under an ESF priority other than Priority 4 were first time applicants to ESF in 1999.
28
Case study projects
Case study projects have undoubtedly increased ESF access among IBOs, and even among secondary beneficiary organisations.
The Big Issue in the North Trust proceeded to access Objective 3 for the first time with two separate projects in the year 2000. One project was for further capacity building. The second was to deliver a programme of support directly to Big Issue vendors, informed by the research findings of the Priority 4 project.
When the SCVO voluntary sector infrastructure project started life, none of the participating organisations had accessed Objective 3 ESF directly. Of the seventeen who remained actively involved, four have now submitted applications and all have been successful. One organisation has submitted two bids, of which one was successful.
The aspects of the project that have enabled this to happen are:
♦ the networking among CVSs which has raised awareness of what can be done with ESF
and permitted a sharing of experience;
♦ the establishment of systems (financial and monitoring) that can permit organisations to
apply for and manage an ESF project.
Significantly, CVSs’ own member organisations have also submitted applications as a result of the increased awareness of their CVS and its improved capacity to help them put in a bid. Not all have been successful, but there is some anticipation that their prospects will improve in the next round.
CETA, the Derby based organisation working with minority ethnic groups, has succeeded in obtaining a further ESF grant (subsequent to its Priority 4 funding) for a research project undertaken with the University of Derby resulting in a mapping of the black and minority ethnic community sector locally. The Derby Millennium Network established as a direct result of the project has also successfully accessed a number of other funding sources, most recently support for a Black Leadership programme from the Local Learning and Skills Council.
CETA has also subsequently assisted a number of community organisations in preparing funding bids, for example Derby African Association which put forward an application for Objective 3 funding.
29
Workshop, which had previously bid for ESF support, now feel able to go for more projects and generate better quality outcomes (through training of trainers).
IBOs concerned with the Lincoln project also felt better prepared for Objective 2 funding as a result of Priority 4 support.
In the case study project that was geared principally towards enabling organisations to access ESF, the Glasgow City Council / WEA Local Organisations Towards Employability (LOTE) project, only one organisation has so far been successful in accessing ESF out of the fifteen that participated in workshops and advice for this purpose. The successful bidder was the Centre for Independent Living in Glasgow. However, at least a further two had already submitted applications, one of whom which was on the reserve list, and the other of which was not selected. Both of these organisations will bid again. A further three IBOs from the sample of nine interviewed intend to apply for ESF in the future. Of the remainder, three have not bid and do not intend to and the remaining one has assisted a secondary beneficiary organisation to bid.
Difficulties in accessing ESF
This sample were overwhelmingly positive about the benefits that the capacity building project had brought them, but thirteen separate unsuccessful aspects were identified of which four related to the nature of ESF itself. The fund was perceived to be unsuitable, too bureaucratic, too “full of delays” or too focused on the labour market.
Similarly, those involved in the Lincoln Voluntary Council project expressed the view that the complexity of ESF application procedures, the fact that these procedures are the same for large and for small bids, the delays in notification of success or not, and in payment, as well as difficulties finding match funding reduce substantially the attractiveness of ESF. There has been a greater level of participation in other funding sources, such as lottery, felt to be more appropriate for many Priority 4 IBOs.
LOTE IBOs, in common, with several others with whom we spoke, suffered partly as a result of excess demand for Policy Field 2 (Equal Opportunities for All and Promoting Social Inclusion) measure 2, probably the most logical place for a project working with people excluded from the labour market.
LOTE IBOs also expressed disappointment about the significant gap between the beginning of the new programme and the end of the old one. Thus, even the organisation that was successful in accessing ESF had to pay for external support to enable it to develop its bid.
Questionnaire
30
[image:34.595.74.521.146.317.2]organisations had gone for Objective 2, and three for Objective 1. These findings are shown in figure 12.
Fig. 12: What funding have you applied for?
Funding source
Applied for funds Application approved Was your organisation the applicant?
No. % of orgs that applied (base =72)
No. % of orgs that applied
No. % of orgs that applied
a) Objective 3 27 37.5 17 63.0 18 66.7
b) Objective 2 4 5.6 1 25.0 2 50.0
c) Objective 1 3 4.2 0 0.0 2 66.7
d) SRB 13 18.1 11 84.6 8 61.5
e) Lottery 29 40.3 17 58.6 23 79.3
f) Other
Source: questionnaire
Notes
♦ Objective 3 funding – received /applied for by applicants in the years 1998 – 2001 ♦ Objective 2 funding – all received/applied for in 2001
♦ Objective 1 funding – all applied for in 2000
♦ SRB funding - received /applied for by applicants in the years 1998 – 2001
♦ Lottery funding – received/applied for in the years 1997-2001 – but most organisations indicate 2000 and 2001 as the year they received/applied.
♦ 164 organisations did not apply for/receive any type of funding ♦ 33 organisations applied for/received 1 source of funding only ♦ 15 organisations applied for/received 2 sources of funding only
Of those that applied for Objective 3, 17 had their application approved (63% of those that applied), and two thirds of all those that applied were themselves the applicant organisation.
However, according to this analysis, the numbers of unsuccessful applicants are relatively high for Objective 3, and very high for Objectives 2 and 1. In the case of Objective 2, one out of the four organisations that went for it having received capacity building support was successful, whilst none of the three that applied for Objective 1 had their bid approved. The success rate for Lottery funding among questionnaire respondents is actually slightly lower than that for Objective 3, whilst the success rate for SRB is – interestingly – substantially higher: eleven out of thirteen organisations that were involved in an application were successful, and eight out of the thirteen were themselves the applicant.
Comparison group
31
All three of the successful applicants received external support to develop their bids, in one case from a sister organisation, in a second from a private company, and in the third from the regional voluntary sector umbrella organisation CEFET and a private consultant. One said that having the systems and structures already in place was what enabled them to bid successfully, coupled with the support from their sister organisation.
In this respect, Priority 4 has clearly added value by assisting some IBOs to establish the
appropriate systems and structures. Whilst there may be a small amount of overlap between Priority 4 and technical assistance, it is the more in depth advice and support and, crucially for some organisations, the actual experience that Priority 4 offered to be involved in an ESF project that gave something additional.
The successful applicants in the comparison group were all working with disadvantaged unemployed people, in one case with those with learning difficulties, in a second with disabled people and in the third with problematic drug users in a residential rehabilitation centre.
Among the unsuccessful applicants, four out of five firmly believe that the way in which the bid was written was the principal reason for the failure of their application, and not that their proposal was inappropriate for ESF. One organisation was clear that they had put the information needed to score under equal opportunities in the wrong place, and not cross-referenced the appropriate section. A second was also disappointed with their score on equal opportunities.
Another of those consulted expressed the view that the way the bid was written probably missed the mark and he felt isolated in the development of the application.
Three out of five of the unsuccessful applicants received help putting in their bid, in two cases from the local authority.
One organisation was clear that too much was expected of small organisations in terms of absorbing information and putting together a bid. The consultee's view was that if such organisations are responding to community needs then they are unlikely to be able to free up the staff time to do all the work needed to win Objective 3 funding.
Priority 4 cannot be expected to have responded to this concern. It remains the case that ESF is inappropriate for many small organisations to bid to directly, but that where they are providing support that offers something additional to the programme, their access should be facilitated through partnerships and consortia.
32
There is evidence that Priority 4 has increased access to ESF for organisations working with this client group (some is provided, for instance, from the case study project CETA). However, some analysis needs to be done to see the extent to which these client groups - and particularly those among them who are multiply disadvantaged in the labour market - are being served by the Objective 3 programme and the extent to which organisations in the black and minority ethnic black and community sector are failing with ESF bids.
Overall remarks on access to ESF
Despite some difficulties, the evidence suggests a relatively high number of new organisations are gaining access to ESF as a result of Priority 4 - either directly or indirectly, and a number of additional ones are seriously considering it.
Our main outstanding concern in the context of this evaluation is whether the most disadvantaged target groups are now effectively served by the programme. Before reflecting on this, we will examine briefly access to other sources of funding and then look at access to ESF for ultimate beneficiaries.
5.2.3 Capacity to access other funding
It is clear from this analysis that Priority 4 has also improved IBOs’ capacity to access other sources of funding, in addition to Objective 3.
In some cases, the other source(s) is/are likely to be a match for the ESF. The analysis shows that most commonly, organisations that applied to and received more than one fund applied for or received Objective 3 and Lottery funding (twelve out of nineteen organisations that applied for / received more than one source of funding).
From the case studies and work with the comparison group, success factors that emerged in respect of funding access most commonly included size and expertise.
33
5.2.4 Access to ESF for ultimate beneficiaries
Figure 10, on page 22, shows that 22.5% of questionnaire respondents said Priority 4 had helped them to access support through the ESF for their client groups. This is significantly higher than the percentage of respondents that indicated they had actually applied for and received ESF themselves, and suggests that some organisations have developed partnerships with others to enable their clients to gain access. There is also a possibility that some of these organisations feel that because they benefited from Priority 4, their clients have benefited from ESF.
Figure 11, on page 24, shows that a variety of forms of support have contributed to this benefit, although once again those that have received support for staff costs are most likely to say that they have been able to access ESF for their clients.
Bearing in mind the origins and rationale for Priority 4, a most important aspect of this
analysis is who are the clients that are gaining access to ESF as a result of Priority 4? Are
they individuals that are disadvantaged in the labour market that were not sufficiently reached by the programme previously?
An analysis of the 1999 final claim forms data provides evidence that Priority 4 has enabled new and probably more disadvantaged clients to gain access to the programme.
We compared the characteristics of the client groups served by those that said their project involved organisations that had previously benefited from capacity building with those that had not. Figure 13,on page 34, shows the projects that had clients in each of the Objective 3 target and sub-target groups and the average number of clients in each group. In almost every case, projects that involved a Priority 4 IBO were more likely to have clients in these sub-target groups. For example 46% of projects involving a Priority 4 IBO worked with ex-offenders, compared with 26% of those that did not involve an IBO. The exception is people in rural areas.
Potentially more importantly, the projects involving organisations that have benefited from capacity building are more likely to have greater average numbers of clients from a particular group in the case of several sub-target groups. In a few cases (notably homeless people and ex-offenders) the average numbers of clients is substantially greater (64 compared with 17 in the case of homeless people and 117 compared with 30 in the case of ex-offenders).
34
Fig. 13: Percentage of projects that have beneficiaries in each client group, and average client numbers
Target group With capacity Without capacity PEOPLE WITH DISABILITIES
% with any clients in this category 91% 76%
Average number of clients 38 43 LONE PARENTS/CARERS
% with any clients in this category 67% 55%
Average number of clients 30 22
FIRST LANGUAGE NOT ENGLISH
% with any clients in this category 44% 34%
Average number of clients 34 26
RURAL AREAS
% with any clients in this category 28% 31%
Average number of clients 49 74
LARGE SCALE REDUNDANCY
% with any clients in this category 18% 16%
Average number of clients 16 16
EX-OFFENDERS
% with any clients in this category 46% 26%
Average number of clients 117 30
HOMELESS
% with any clients in this category 39% 20%
Average number of clients 64 17
ETHNIC MINORITY
% with any clients in this category 75% 70%
Average number of clients 67 52
Source: 1999 Objective 3 final claims data
35 Fig. 14: Qualifications of beneficiaries before starting.
Source: 1999 Objective 3 final claims data
5.2.5 Addressing gaps identified at the start
When Priority 4 was first introduced, regions were encouraged to carry out a profile of existing capacity for community development. This was meant to help them identify needs for both communities of place and communities of interest and to target resources effectively, in particular where a lack of capacity coincided with labour market disadvantage.
The interim evaluation found that those regions that had carried out such an analysis and selected particular communities of place and interest on which to focus tended to be able to target resources more effectively.
A number of regions selected specific target groups or themes, for instance (and not exhaustively):
♦ South East: young people, disabled people, areas where there is coincidence of offending
behaviour and unemployment among young people;
♦ West Midlands: disabled people, ethnic minority groups; ex-offenders;
♦ Wales: ethnic minorities, rural areas, intermediary bodies;
♦ East Midlands: ethos enlargement (in view of the fact that there were over 1000 grass
roots organisations serving disadvantaged client groups, few of whom had any ethos of economic development, training or employment activity); research and development; widening membership of umbrella organisations; sharing experience;
♦ Scotland: building up the capacity of the CVS network; ex-offenders, black and minority
ethnic organisations. 4 6.4 3.1
4.1
10.8 10.8 7.8
9.8 10.9
2020.9 25.6
25.9
21.4 39.3
36.5
42.4 35.4
24.4 19.6
0 5 10 15 20 25 30 35 40 45
% High qualification
Middle qualification Qualification not known Basic qualification No qualification