Tracking Learning Outcomes:
Evaluation of the Impact of Ufi
Claire Tyers and Alice Sinclair
Institute for Employment Studies
Research Report
No 569
Tracking Learning Outcomes:
Evaluation of the Impact of Ufi
Claire Tyers and Alice Sinclair
Institute for Employment Studies
The views expressed in this report are the authors’ and do not necessarily reflect those of the Department for Education and Skills.
Prepared for DfES by:
INSTITUTE FOR EMPLOYMENT STUDIES
Mantell Building Falmer
Brighton BN1 9RF UK
Tel. + 44 (0) 1273 686751 Fax + 44 (0) 1273 690430
http://www.employment-studies.co.uk
Copyright © 2004 Institute for Employment Studies
The Institute for Employment Studies
The Institute for Employment Studies is an independent, apolitical, international centre of research and consultancy in human resource issues. It works closely with employers in the manufacturing, service and public sectors, government departments, agencies, and professional and employee bodies. For 35 years the Institute has been a focus of knowledge and practical experience in employment and training policy, the operation of labour markets and human resource planning and development. IES is a not-for-profit organisation which has over 60 multidisciplinary staff and international associates. IES expertise is available to all organisations through research, consultancy, publications and the Internet.
Acknowledgements
Contents
Executive Summary v
1. Introduction 1
1.1 About Ufi 1
1.2 Evaluation aims 1
1.3 Methodology 2
1.4 Structure of remaining report 5
2. Learner/Helpline User Profiles 6
2.1 Sample profile 6
2.2 Comparisons with NALS and LFS 8
2.3 Chapter summary 10
3. Use of IAG Sources and their Influence 11
3.1 learndirect learners 11
3.2 Helpline users 14
3.3 Attitudes to learning 16
3.4 Chapter summary 18
4. Participation Rates 20
4.1 Participation rates 20
4.2 Learning leading to a qualification 26
4.3 Chapter summary 30
5. Learning Progression 33
5.1 Progression within learning 33
5.2 Completion rates 36
5.3 Learning patterns 37
5.4 Likelihood of future learning 39
5.5 Chapter summary 43
6. Outcomes 45
6.1 Qualification gains 45
6.2 Income 51
6.3 Skill gains 52
6.4 Chapter summary 57
7. Employability 59
7.2 Helpline users 61
7.3 Chapter summary 63
8. Conclusions 64
8.1 Participation in, and attitudes towards, learning 64
8.2 Impact of advice sources 65
8.3 Learning progression 66
8.4 Learning outcomes 67
8.5 Employability 68
8.6 Summary 68
Appendix 1: Response and Sample details 70
Appendix 2: Detailed Breakdown of Income Changes 73
Appendix 3: Detailed Results of Multivariate Tests 77
Executive Summary
Introduction
Ufi Ltd was established in 1998 to fulfil its vision of a ‘university for industry’. The delivery network was launched in Autumn 2000, with two main products: an independent national learning information and advice service, and a network of learning centres, both operated under as learndirect. This evaluation follows a strategic initial evaluation in 2002 and tracks the progress of individuals for up to two years from their initial contact with learndirect. The findings are based on a telephone survey of just over 1,500 service users.
The evaluation
The aim of the evaluation was to assess the impact that Ufi is having on learners in the learning market. More specifically, to determine whether learndirect has had an impact on:
z attitudes towards learning
z participation in learning
z knowledge and skills, either through use of learndirect or progression onto other providers
z the employability of users and their employment situation.
Respondent details
In total, the surveys involved 1,567 individuals. Of these, 787 were referred into the study because they had been taking learndirect courses in November and December 2001, and 780 had used the learndirect helpline in February and March 2002.
The profiles of learndirect helpline users and learndirect learners are very different, both from each other and from national datasets. learndirect learners, when compared to the population of adult learners, are more likely to have low level qualifications, to be outside the labour market, and to have little recent experience of learning. In contrast, helpline users have more recent learning histories, and higher level qualifications, but are still more likely to be out of work than the general population. Both samples have far more female respondents than either of the national data sets. These differences are important in setting later results in context.
Key findings
The role of IAG
The majority of respondents had used some form of Information, Advice and Guidance (IAG) about learning and/or career opportunities over the tracking period. This type of support received relatively high ratings for its influence on respondents in their decision to take up learning. Repeat learndirect learners were the most positive about the influence of IAG, and the learndirect helpline and website received particularly high ratings. These ratings also became more positive over time.
Progression within learning is related to a set of ‘learning characteristics’, such as age, recent experience of learning, and participation in the labour market. However, there is evidence that take-up of IAG can be an important moderator in changing behaviour and attitudes. The use of IAG among the learners was the most important predictor of whether an individual went on to progress in their learning, and whether they anticipated taking on further learning in the future.
Attitudes towards learning
had already been involved with learndirect for some time. It is likely, therefore, that much of the attitudinal change we might expect had already occurred before our pseudo-baseline measurement. Therefore, in this case, we can say little about attitudinal change.
There was evidence, however, that where helpline users had engaged in some form of learning following their initial call, this resulted in more positive attitudes than among those who had not entered learning.
Participation and progression in learning
The participation rates of learndirect learners in any learning in the three years before their involvement with learndirect was just 38 per cent. This compares to a participation rate over the same period for NALS respondents of 69 per cent. This demonstrates that learndirect learners are a group with much less recent experience of learning than we might expect. As such, the data would suggest that they would be less likely to participate in learning, on average. However, learndirect has successfully engaged these learners. The same point applies to helpline users, 52 per cent of whom had been involved in learning over the last three years.
Participation rates at the time of the second survey were higher for both learners (at 29 per cent) and helpline users (32 per cent), than for the general population1 (around half of this). There was no evidence that participation in learndirect learning promoted greater participation rates, overall, than any other type of learning, although this result does not take account of the less active learning profile of learndirect learners.
Certainly, participation in learning leading to a qualification increased over time, to 15 per cent by the time of the second survey of learners. Helpline users were twice as likely to be involved in qualification led study, reflecting their greater connection with recent learning, and their overall profile. Older and more disadvantaged learners, by contrast, were the most likely to ‘repeat-learn’ with learndirect. Also, those with lower prior qualification levels and no recent experience of learning stated particularly that their experience of learndirect learning influenced their decision to go on to other forms of learning.
Qualifications gained
The proportion of individuals going on to gain qualifications was not high – at nine per cent for both the learners and helpline users – when compared with other data sources, reflecting to some
degree the profile of respondents. However, the gains were greatest within both samples for individuals with level 1 qualifications. This is likely to reflect the fact that progression onto higher levels (eg taking a level 3 qualification) can take longer than the tracking period covered by the research but also provides further evidence of the impact of learndirect on the lower qualified learner. Again, the profile of respondents who had made qualification gains was younger and with a more recent learning history, showing that once people are engaged with learning, they are more likely to progress within formal learning routes. However, the proportion, in both samples, of the ‘45 years and older’ group gaining qualifications was comparable, and in fact slightly higher, than other national data sources.
Skills gained
Respondents in both samples were particularly positive about the soft skills they had gained, such as self-confidence, and social skills. However, the majority also believed that they had gained job-related skills, and IT skills. In all cases there was a positive relationship between job changes (eg promotions, new jobs) and qualification gain, and the perception that individuals had gained a whole range of skills. Individuals who had experienced changes were more likely to feel that they had gained skills than others.
Employability
By the time of the first survey, 12 per cent of learners and 20 per cent of helpline users had experienced a job-related change. These proportions increased to 30 per cent and 46 per cent by the time of the second survey. In both cases, the most common outcome was securing a new job in a different type of work. The most important predictors of whether an individual achieved such a change included age and ethnicity, but recent learning history was also a factor. This result demonstrates that although there are many factors in the workplace that can affect an individual’s opportunities, recent experience of learning plays an important part in maximising these.
Conclusions
Learners
group. learndirect also acted as a stepping stone into other forms of learning , and participation in qualification related study by this group increased over time. In relation to other outcomes:
z Nine per cent of learndirect learners had gained a qualification over the tracking period. Individuals with a baseline qualification at level 1 were most likely to make progress , as did 13 per cent.
z Thirty per cent reported a performance related pay rise over the period.
z Skills gains were common, particularly in relation to IT, self-confidence and social skills.
z Around one-third of learndirect learners had experienced some changes to their work, most commonly moving into a different area of work.
z Individuals were most positive about the role of learndirect in making changes.
Helpline users
Helpline users are also less likely to have had a recent learning experience than people in general (taken from NALS). Helpline users are very positive about the use of IAG sources, particularly those who were repeat users of learndirect services (ie helpline and website). Participation in learning 18 months after their initial call to the learndirect helpline was, again, much higher then average.
Other outcomes include:
z Nine per cent of learndirect helpline users gained a qualification, but 16 per cent of those with a baseline qualification at level 1 did so.
z Twenty-seven per cent had received a performance related pay rise over the 18 months.
z Almost all helpline users reported having gained something from learning where they had taken part; most commonly they had gained self-confidence, but also the opportunities to progress onto further qualifications.
z Around one-third had changed jobs over the tracking period.
z Those with the most positive outcomes were most positive about the role of learndirect in these changes.
Overall
z learndirect encourages participation in learning, particularly among those without a recent learning history or higher level qualifications
z learndirect complements other forms of learning and is an important bridge to more formal methods of study
z learndirect helps individuals to gain confidence and skills.
1.
Introduction
1.1
About Ufi
Ufi Ltd was established in 1998 as the government’s flagship for lifelong learning, to fulfil its vision of a ‘university for industry’. Launched in Autumn 2000, the delivery network of learndirect has enabled Ufi to deliver two main products; an independent national learning information and advice service, and a network of learning centres. learndirect is the largest government-backed e-learning network1 of learning centres in the world2.
The learndirect network delivers a huge array of online and off-line courses in partnership with a range of higher and further education providers, with the voluntary and community sectors, and through private training suppliers. Learners can also access courses in their own home or at work as the services are designed to be as flexible as possible and aim to meet a wide variety of learner needs. By April 2003, around 750,000 people had enrolled on learndirect courses, and more than five million calls and six million web enquiries to the learndirect advice service had been handled by the 24 hour learndirect advice service.
Future activities are driven by Ufi’s strategic plan published in 2002, outlining the work of Ufi into 2007. The plan maps out Ufi’s mission to inspire existing learners to develop their skills further, to win over new and excluded learners, and to transform the accessibility of learning in everyday life and work. Ufi Ltd continues to broaden and expand the reach of learndirect through the integration of activities of the UK Online Centres and recent additions to their portfolio. These additions include the business development service network and Skills for Life delivery (dealing with adult literacy and numeracy).
1 Although it provides a broader range of services than just e-learning
1.2
Evaluation aims
Following an earlier strategic evaluation of Ufi1, the Department for Education and Skills (DfES), in partnership with Ufi, has commissioned a second-stage evaluation which examines the impact of both learndirect learning and the national learning and advice line. The overall aim of this evaluation is to assess the impact Ufi is having on users. It is not intended to comment on or measure the extent to which Ufi is meeting its targets, nor does it seek to judge the efficacy of delivery (which is part of the role of Ufi Ltd’s dedicated research team).
The objectives of the evaluation are, therefore, to assess or establish for users of learndirect national learning advice line (referred to throughout this report as learndirect helpline users), and separately for those learners registered with the learndirect network (referred to throughout this report as learndirect learners), the extent to which learndirect has had an impact on :
z attitudes towards learning, particularly those without a history of participation in learning
z participation in learning, to establish any identifiable changes to learning patterns
z knowledge and skills gained through the use of learndirect and/or further learning, including learning outcomes and ‘softer’ outcomes (eg confidence and motivation)
z the employability of users, including those moving into work, staying in work, and gaining promotion within work.
This report has been written in order to provide an overview of measures designed to assess these impacts and brings together results from surveys of learndirect learners and helpline users.
1.3
Methodology
1.3.1
Sample construction and response rates
The data in this report comes from a survey of the same cohorts of learndirect national learning advice line users and learndirect learning network users who were first surveyed during the initial evaluation in 2002. This longitudinal element has been introduced in order to determine any further impacts since the time of the earlier evaluation.
Individuals were selected for inclusion in the original survey of helpline users (conducted in July and August of 2002) if they had
1 Tamkin P, Hillage J, Dewson S, Sinclair A (2003), New Learners, New
used the learndirect helpline during February and March 2002. The learners sample was conducted with individuals who had enrolled on learndirect courses in the latter part of 2001. Individuals who agreed to be re-contacted, following the first survey, form the sample for this follow up.
The follow-up surveys were conducted during November and December 2003. The adjusted response rates for the surveys (adjustments are made for numbers where contact was not possible — see Appendix 1 for full details) are both over 70 per cent. The number of achieved interviews with helpline users was 780, and with learndirect learners was 787. This report only presents data for those individuals for whom data is available from both survey waves.
Details of the achieved samples are presented in chapter 2.
1.3.2
Questionnaire design
The design of the survey instrument for this aspect of the evaluation was based largely on the questions used at the time of first contact with the sample in 2002. Question formats were maintained, where possible, to allow direct comparability between the results of the two surveys. However, there was a need to rationalise the questions used, as the original survey took 30 minutes to complete, and the follow-up was 20 minutes long. Some questions were, therefore, removed from the original survey. Additionally, some questions were updated or new questions added to reflect current policy interest. BMG were the primary authors of both survey instruments, but the current instrument went through a number of iterations to meet the needs of a steering group, consisting of representatives of the DfES, Ufi, BMG and IES.
1.3.3
Comparison with other data sources
In order to set the data in context and to allow readers to compare and contrast the results with those of other surveys, a number of comparator data sources are examined within this report. It should be noted that the respondents to these data sources vary significantly in profile to learndirect users. As these differences are so significant, and are apparent across a number of different variables (see chapter 2 for full details), no attempt to weight the data from the surveys for this evaluation, to the other data sources, has been made. However, wherever possible, the data has been analysed in order to allow as direct a comparison as possible to be made by filtering the data sources in the same way (eg
in respondent profiles when making direct comparisons between learndirect users and other groups.
1.3.4
Data from the surveys
Before moving on to the evaluation evidence, it is important to discuss the nature and limitations of the data used. Table 1.1 presents the time-line for the surveys.
The first survey was conducted at time point 1 (referred to throughout this report as T1) in July and August 2002, and the second survey conducted at time point 2 (referred to throughout this report as T2) in November and December 2003. This means that the evaluation has involved contact with individuals over a period of up to 18 months. However, retrospective data was collected at T1, referring to learning patterns over up to three years before the survey.
Throughout this report, where progress has been tracked, data is presented which refers to progress made by the time of each survey (ie by T1 and by T2) in order to provide a cumulative description of impact.
However, where ratings or attitudinal data has been collected which relates to specific events, or where questions are not directly comparable at T1 and T2, it has been necessary to separate out responses. In these cases, the data is more limited in scope and is presented separately for individuals responding to the questions at T1 and T2, rather than cumulatively. Where this is necessary, it is harder to estimate the true impact of learndirect over time, but the data does provide some indication of progress at each of the time points.
The time between intervention and impact measures varies to some degree. For most individuals, the initial learndirect helpline consultation will have been at least 21 months previously, and the learndirect learning at least two years before T2. Thus, when comparing results from the two samples it should be considered that the time since intervention differs. This is also true within each sample (due to the date of enrolment on learndirect courses and the date of each survey varying by up to two months) but to a lesser degree.
Table 1.1: Evaluation time-line of the project phases (by group)
(T0) (T1) (T2)
User group with learndirect Initial contact First survey Follow up survey
Learners Nov/Dec 2001 July/Aug 2002 Nov/Dec 2003 Helpline users Feb/Mch 2002 July/Aug 2002 Nov/Dec 2003
1.4
Structure of remaining report
The remainder of this report presents the analysis of key data relating to impact from both the 2002 and 2003 surveys, for both the learndirect learners and helpline users. The remaining sections are structured as follows:
z Chapter 2 describes the profiles of respondents to both the learndirect helpline and learners surveys.
z Chapter 3 examines the use of IAG sources and their perceived influence on learning take-up, as well as examining changes to attitudes towards learning.
z Chapter 4 looks at participation rates, including participation in learning leading to qualifications.
z Chapter 5 presents analysis of progression within and onto learning, including completion rates.
z Chapter 6 considers qualification, income and skill gains.
z Chapter 7 discusses employability gains, including job-related changes.
2.
Learner/Helpline User Profiles
To assess the impact of the learndirect helpline and learndirect learning, outcomes were compared for the two survey samples, against data from the general population, using two national surveys:
z National Adult Learners Survey (NALS) 2002, which looks at levels and types of learning in the UK, and, therefore, provides a good comparison group of learners.
z The Labour Force Survey (LFS) for the Summer 2002 and Autumn 2003 quarters, which provides information on the UK labour market, including learning behaviours of individuals.
It is also worth noting that in later chapters, a comparison is also made with the Pathways in Adult Learning (PALS), which re-contacted participants from the 2001 NALS survey in 2003, to determine progression and outcomes over time for this group.
Before making any comparisons, it is important to examine how these sample populations differ from one another, as demographic disparities between the populations may, to some extent, account for any variance in outcomes that emerge. This chapter therefore presents the following:
z descriptions of the achieved samples of learndirect learners and helpline users
z a comparison of these profiles with those of other data sources used later in the report1.
2.1
Sample profile
2.1.1
Helpline users
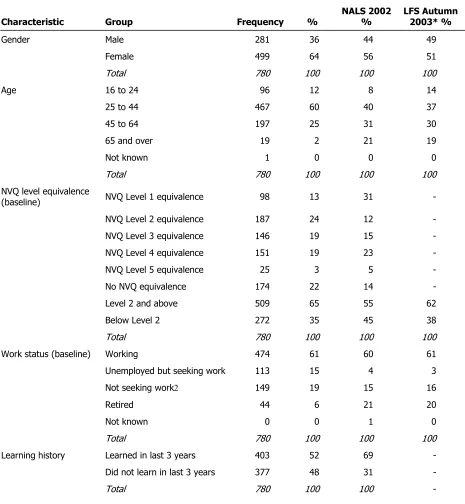
The characteristics of the achieved sample of learndirect helpline users are presented in Table 2.1. In summary, the majority of respondents in our sample are:
1 Two LFS quarters are used in this report for comparisons, Summer
z female (64 per cent)
[image:20.595.73.538.137.641.2]z over 25 years old (86 per cent are aged between 25 and 64)
Table 2.1: Comparison of characteristics of 2003 helpline users and national data1
Characteristic Group Frequency %
NALS 2002 %
LFS Autumn 2003* %
Gender Male 281 36 44 49
Female 499 64 56 51
Total 780 100 100 100
Age 16 to 24 96 12 8 14
25 to 44 467 60 40 37
45 to 64 197 25 31 30
65 and over 19 2 21 19
Not known 1 0 0 0
Total 780 100 100 100
NVQ level equivalence
(baseline) NVQ Level 1 equivalence 98 13 31 -
NVQ Level 2 equivalence 187 24 12 -
NVQ Level 3 equivalence 146 19 15 -
NVQ Level 4 equivalence 151 19 23 -
NVQ Level 5 equivalence 25 3 5 -
No NVQ equivalence 174 22 14 -
Level 2 and above 509 65 55 62
Below Level 2 272 35 45 38
Total 780 100 100 100
Work status (baseline) Working 474 61 60 61
Unemployed but seeking work 113 15 4 3
Not seeking work2 149 19 15 16
Retired 44 6 21 20
Not known 0 0 1 0
Total 780 100 100 100
Learning history Learned in last 3 years 403 52 69 -
Did not learn in last 3 years 377 48 31 -
Total 780 100 100 -
* The LFS sample used consisted of people aged 16 and over. Highest NVQ level is calculated for those of working age or in employment only. Unemployed is defined using ILO definition. Not seeking work was calculated by subtracting the number of retired from the number of inactive.
1 Base sizes have been removed in this table (for NALS and LFS data) for ease of comparison, however, these are
presented in a further table in Appendix 4.
2 This figure includes those unable to work due to ill health/disability (39 cases), looking after family/home (84
cases), full-time students (15 cases), and individuals not working or looking for work (11 cases).
z in employment (61 per cent) with 15 per cent of the sample unemployed and looking for work
z qualified to level 2 or above (although around a third are qualified below level 2).
The sample profile for the 2003 survey of helpline users is similar to the profile for 2002. The age profile is slightly different, and there is now a higher proportion of individuals of working age. There are also slightly more individuals qualified to below level 2 than in 2002. However, these differences do not suggest any major biases due to sample attrition and no weighting to the original sample has been carried out (see Appendix 4 for a comparison of the profiles of 2002 and 2003 respondents).
2.1.2
Learners
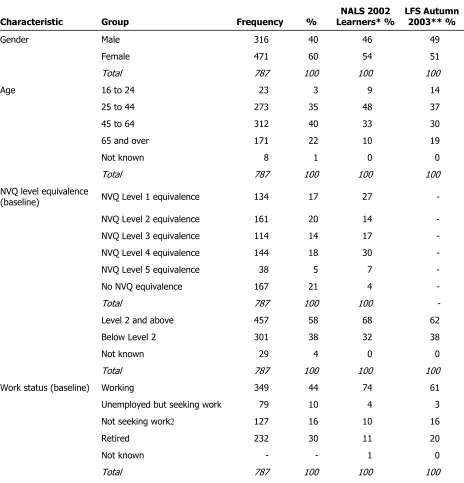
The characteristics of respondents to the learndirect learners survey (Table 2.2), show that the majority:
z are female (60 per cent)
z are over 25 years old (97 per cent are aged 25 or over). It is also important to note the high proportion of people over working age in the sample (22 per cent aged 65 and over)
z are in employment (44 per cent), but there is also a large proportion that is retired (30 per cent)
z are qualified to level 2 or above (although over a third are qualified below level 2)
z have not engaged in learning in the three years leading up to the first survey (62 per cent).
Overall, the sample profile for the 2003 survey is similar to the profile for 2002. The 2003 sample is more likely to be economically inactive but less likely to be unemployed. There is also a slight discrepancy in the proportion of learners qualified to level 1; with more in the 2003 sample. However, this may be due to differences in the way that the qualification level was measured between the two waves. We would conclude, therefore, that there are no major biases due to sample attrition.
2.2
Comparisons with NALS and LFS
2.2.1
Helpline users
Compared to both the full NALS (ie both learners and non-learners) and LFS samples, helpline users are more likely to be:
z female
z qualified to NVQ level 2 or above (although the disparity is less pronounced with the LFS sample) and less likely to hold higher NVQ levels such as level 4 or 5 (although this
Table 2.2: Comparison of characteristics of learndirect learners and national data1
Characteristic Group Frequency %
NALS 2002 Learners* %
LFS Autumn 2003** %
Gender Male 316 40 46 49
Female 471 60 54 51
Total 787 100 100 100
Age 16 to 24 23 3 9 14
25 to 44 273 35 48 37
45 to 64 312 40 33 30
65 and over 171 22 10 19
Not known 8 1 0 0
Total 787 100 100 100
NVQ level equivalence
(baseline) NVQ Level 1 equivalence 134 17 27 -
NVQ Level 2 equivalence 161 20 14 -
NVQ Level 3 equivalence 114 14 17 -
NVQ Level 4 equivalence 144 18 30 -
NVQ Level 5 equivalence 38 5 7 -
No NVQ equivalence 167 21 4 -
Total 787 100 100 -
Level 2 and above 457 58 68 62
Below Level 2 301 38 32 38
Not known 29 4 0 0
Total 787 100 100 100
Work status (baseline) Working 349 44 74 61
Unemployed but seeking work 79 10 4 3
Not seeking work2 127 16 10 16
Retired 232 30 11 20
Not known - - 1 0
Total 787 100 100 100
* Defined as learners if have participated in some form of learning in the last 3 years
** The LFS sample used consisted of people aged 16 and over. Highest NVQ level is calculated for those of working age or in employment only. Unemployed uses ILO definition. Not seeking work is calculated by subtracting the number of retired from the number of inactive.
1 Base sizes have been removed in this table for ease of comparison, however, these are presented in a further
table in Appendix 4.
2 This figure includes those who are unable to work due to ill health/disability (42 cases), looking after home/family
(53 cases), full-time students (15 cases) and individuals not working or seeking work (19 cases).
comparison was only possible with NALS)
z unemployed, but much less likely to be retired.
2.2.2
Learners
For the learners survey, the most appropriate comparison group is the general population of adult learners, which was drawn by selecting learners from the NALS 2002 survey. However, comparisons with the general population, as estimated from LFS, show similar discrepancies between the samples. Compared to both of these groups, learndirect learners are more likely to be:
z female
z older
z qualified to below level 2, and much more likely not to hold any qualifications at all, or any that are equivalent to NVQs (although this comparison was only possible with NALS).
Employment status did not differ a great deal between the learndirect learners and the general population as a whole. However, compared to the general population of adult learners, learndirect learners are more likely to be out of employment, and much more likely to be retired.
2.3
Chapter summary
The learndirect learner and helpline samples differ on a number of characteristics. The profile of learners is that they are older, in general, than helpline users, they are also more likely to be unemployed or economically inactive (particularly retired). Helpline users are likely to be qualified to a higher level and have a more recent history of learning than learndirect learners.
These differences are reflected in the differences between each of the samples and other survey data. In comparison with the National Adult Learners Survey and the Labour Force Survey, helpline users are more likely to be of working age, unemployed (as oppose to more individuals who are economically inactive in the two comparator datasets), and qualified to level 2 or above. In contrast, learndirect learners are more likely to be older, qualified to below level 2 and much more likely to have no qualifications.
3.
Use of IAG Sources and their Influence
An important assumption underlying the operation of the learndirect advice line is that access to information, advice and guidance (IAG) about learning opportunities is likely to help individuals enter learning and/or improve their lives in other ways. Underpinning this is a large body of evidence which examines the benefits of guidance1. Recent work from the DfES has shown, for example, that one of the main influences on whether learners from hard to reach groups had improved their qualification level over a period of around 15 months was the number of guidance sessions they had received2. Therefore, it is important to consider the extent to which individuals have used sources of IAG, not only as a matter of interest in itself, but also as a potential factor in considering impact in later chapters.
This chapter examines the use of advice sources by learndirect learners and helpline users, including both advice from learndirect and other sources. It also considers the extent to which individuals feel that their use of these sources has helped them to access learning opportunities.
3.1
learndirect learners
The sample of learndirect learners may or may not have used the learndirect helpline or other sources of advice as part of their route into learning. Learners were asked to discuss their use of IAG sources for two time periods:
z in the 12 months before T1
z in the period between T1 and T2.
They were also asked to state whether their use of these sources had contributed to their decision to take up learning in the corresponding time periods. Data is therefore presented cumulatively for usage of IAG sources, but cross sectionally (ie for
1 See Hughes D, Bosley S, Bowes L, Bysshe S (2002), The Economic
Benefits of Guidance, Centre for Guidance Studies, University of Derby, for a review of some of this evidence.
usage before T1 and between T1 and T2 separately) in relation to the extent to which this advice helped them enter learning. The cross sectional presentation is necessary as individuals may have responded at both time periods in relation to different learning episodes, and in different ways, so a ‘total’ is not possible. Also, the questions were asked about all learning at T1, and about learndirect and other learning separately at T2.
3.1.1
Advice sources used
In the year before the first survey, the majority of learndirect learners had not received or sought out IAG (Table 3.1). In particular, use of the learndirect helpline was relatively low and just seven per cent had used this IAG source in the 12 months before T1. Additionally, almost a quarter of learners had used the learndirect website for information and guidance purposes (as opposed to learning), and one-in-five had used another source of IAG. These rates of learndirect usage, however, are much higher than for NALS respondents, where usage among the 2002 sample was just above five per cent1.
The extent of usage increases over time, however, and in the next 15 months, a slightly greater proportion had used the learndirect helpline (11 per cent). This might suggest that contact with the learndirect learning network stimulated greater demand for the helpline service. Demand for the learndirect website and other sources remained fairly constant over this time, with usage levels similar to those in the year before T1. Overall, by T2, 58 per cent of learndirect learners had accessed some form of IAG, over a third
1 Fitzgerald R, Taylor R, LaValle I (2002), National Adult Learning Survey
(NALS) 2002, DfES
Table 3.1: Use of IAG sources (learndirect learners)
Used source
Time period Advice source Frequency % Base (N)
By T1 learndirect helpline 57 7 787
learndirect website 178 23 787
Other IAG source 155 20 787
T1 to T2 learndirect helpline 86 11 787
learndirect website 151 19 787
Other IAG source 175 22 787
Cumulative by T2 learndirecthelpline 133 17 787
learndirect website 271 34 787
Other IAG source 278 35 787
Any source 458 58 787
had used the learndirect website, and around 17 per cent had used the learndirect helpline.
3.1.2
Influence of IAG on learning take-up
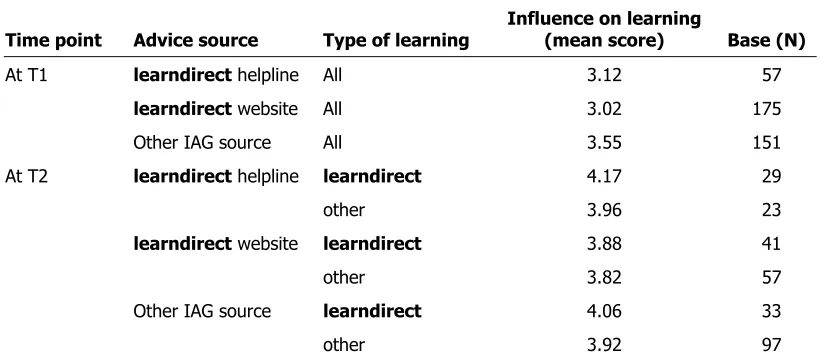
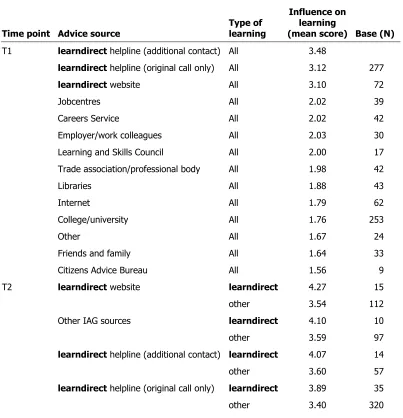
Individuals who had used some form of IAG were asked to state whether the help they received at each time point had influenced them to take up learning (on a scale of 1 to 5, where 1 is equal to ‘no influence’ and 5 is equal to ‘significant influence’) in the corresponding time period. The results are presented separately for learners having used each source (Table 3.2), and at each time point. Data from T1 relates to all learning whereas data at T2 is broken down by type of learning undertaken.
At T1, the users of non-learndirect IAG providers gave the highest average score for the influence of this provision on their decision to take up learning. At T2, the results were slightly different. Overall, learndirect learners gave higher ratings, particularly those using the learndirect helpline. The helpline received higher ratings as an influence on the decision to take up learning, than any of the other sources, for individuals taking on new learndirect and non-learndirect courses. Therefore, despite more limited usage of the learndirect helpline among the sample of learndirect learners (although only against ‘other’ sources combined), individuals using this source did feel the impact of the advice they had received through it.
Because of the nature of the data, and the way it was collected (ie
[image:26.595.132.542.543.724.2]responses are not ‘independent’ of one another as individuals could be in any or all of the user groups) combined with the small base sizes for T2, it is not possible to determine whether any significant differences exist between these groups in relation to their responses.
Table 3.2: Perceived impact of advice on decision to take up learning (learndirect learners)
Time point Advice source Type of learning Influence on learning (mean score) Base (N)
At T1 learndirect helpline All 3.12 57
learndirect website All 3.02 175
Other IAG source All 3.55 151
At T2 learndirect helpline learndirect 4.17 29
other 3.96 23
learndirect website learndirect 3.88 41
other 3.82 57
Other IAG source learndirect 4.06 33
other 3.92 97
1 Although individuals could have used more than source, data was only collected on the overall influence of all
sources used. Therefore, one individual’s rating can contribute to more than one mean score in this table.
3.2
Helpline users
In order to be eligible for inclusion in the survey of helpline users, all respondents must have used the learndirect national learning advice line at least once. However, it is interesting to examine their subsequent use of this and other sources of IAG. Also, where individuals have entered learning, following their call to the helpline in 2002, individuals were asked to comment on how the advice they had received, additional or otherwise, had helped them make this decision.
The use of IAG sources is presented cumulatively, as well as cross sectionally, but attitudinal data relating to one or more incidents is presented in a cross-sectional format only.
3.2.1
Advice sources used
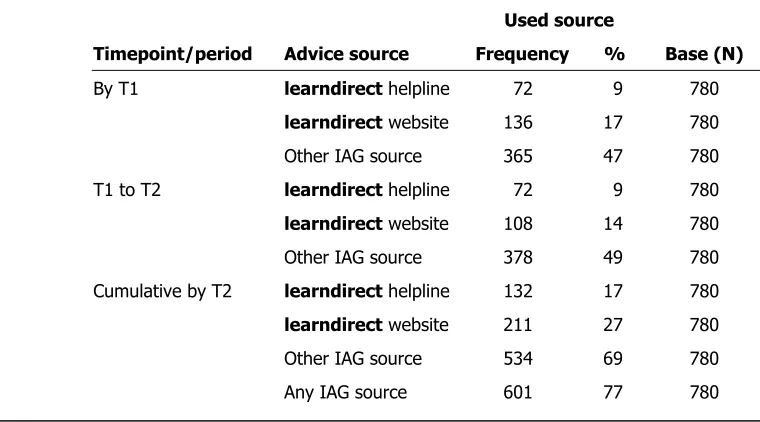
Those in the helpline users sample were asked to outline any other use of IAG sources (Table 3.3). By T1, just less than ten per cent had used the learndirect helpline again, and 17 per cent had used the learndirect website. Almost half the sample had used some form of IAG (either formal or informal) from other sources. The usage rates for the time between T1 and T2 are also very similar to these levels.
[image:27.595.142.522.547.758.2]Overall, by T2 (ie cumulatively), 17 per cent of individuals had used the learndirect helpline again, 27 per cent had used the learndirect website at least once, and almost 70 per cent had used some other source of IAG. This last figure is very similar to the usage levels of non-learners in NALS 2002 (among whom, 71 per cent had used some advice source). Again, usage rates of the learndirect advice line are greater than for NALS respondents, of whom only five per cent used this source of IAG. As the usage of
Table 3.3: Additional use of IAG sources (learndirect helpline users)
Used source
Timepoint/period Advice source Frequency % Base (N)
By T1 learndirect helpline 72 9 780
learndirect website 136 17 780
Other IAG source 365 47 780
T1 to T2 learndirect helpline 72 9 780
learndirect website 108 14 780
Other IAG source 378 49 780
Cumulative by T2 learndirect helpline 132 17 780
learndirect website 211 27 780
Other IAG source 534 69 780
Any IAG source 601 77 780
learndirect is greater among those who used it before, those who used the learndirect helpline once are more likely to use the source again, although previous caveats about the differences between this sample and NALS still apply (see chapter 2).
3.2.2
Influence on decision to take up learning
[image:28.595.140.543.338.756.2]Having used these sources, a number of people went on to access learning. Helpline users who had learnt in some form, in the year before each of the surveys, were asked to rate the influence of the IAG they received (again, on a scale of 1 to 5), up to that point in their decision to enter learning. The results are presented in the same way as for the learners’ data (see Section 3.1.2), ie separately for learners having used each source, and at each time point. Data from T1 relates to all learning whereas data at T2 is broken down by the type of learning undertaken.
Table 3.4: Perceived impact of advice on decision to take up learning (learndirect helpline users)
Time point Advice source
Type of learning
Influence on learning
(mean score) Base (N)
T1 learndirect helpline (additional contact) All 3.48
learndirect helpline (original call only) All 3.12 277
learndirect website All 3.10 72
Jobcentres All 2.02 39
Careers Service All 2.02 42
Employer/work colleagues All 2.03 30
Learning and Skills Council All 2.00 17
Trade association/professional body All 1.98 42
Libraries All 1.88 43
Internet All 1.79 62
College/university All 1.76 253
Other All 1.67 24
Friends and family All 1.64 33
Citizens Advice Bureau All 1.56 9
T2 learndirect website learndirect 4.27 15
other 3.54 112
Other IAG sources learndirect 4.10 10
other 3.59 97
learndirect helpline (additional contact) learndirect 4.07 14
other 3.60 57
learndirect helpline (original call only) learndirect 3.89 35
other 3.40 320
At T1, users of the learndirect website and helpline, on average, gave higher ratings to the influence of this support on their decision to enter learning, than users of any other source. Individuals using the helpline more than once (ie using the service again since their original call), gave the highest ratings to the influence of the advice they had received on their decision to enter learning.
At T2, individuals gave higher ratings to the influence of all sources of IAG. Users of other IAG sources, in particular, gave a more positive rating at T2. The users of the learndirect website, who had taken learndirect courses, gave the highest average rating. Repeat learndirect helpline users were, again, more positive than those using the service only once. In all cases, individuals in learndirect learning were more positive about the IAG sources they had used.
3.3
Attitudes to learning
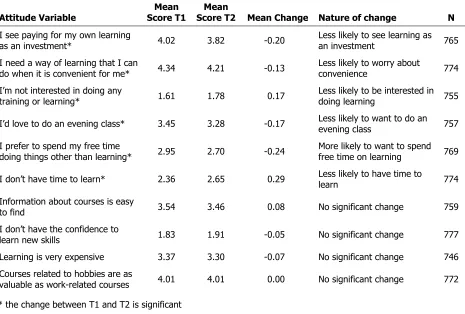
The sample of learndirect helpline users were asked a series of questions at T1 and T2 to gauge their attitudes to learning1. The same questions were asked in both surveys in order to determine the extent to which these attitudes changed over time. Table 3.5 presents the results Statements where the change has been statistically significant are marked.
Before moving on to interpret these results, it is important to note that no information is available on individuals’ attitudes to learning before their involvement with the learndirect helpline (ie
no ‘baseline’ data is available). Therefore, the data does not measure attitudes before and after the learndirect helpline intervention, but simply compares attitudes of learners directly following their initial intervention, and their attitudes some time later. Ideally, the hypothesis we would test would be that contact with the learndirect helpline results in changes in attitudes but the absence of baseline data makes this impossible to assess.
The direction of change is unclear, and neither solely negative nor positive changes have occurred in attitudes since T1. The most positive change in attitudes over time was that individuals were more likely by T2 to want to spend their free time in learning. However, they were also more likely to feel that they had less time for learning, and that they were not interested in learning. Individuals were less likely to seek convenient learning, and less likely to want to do an evening class.
1 These attitudinal questions were derived from Ufi’s attitudinal
There are a number of reasons which might help explain why the data is inconclusive. Firstly, individuals’ reasons for seeking IAG are extremely varied, as are their personal circumstances and learning situations. Changes to their situation may override any positive impact of either learning or IAG support. Additionally, it could be argued that the biggest change in attitudes would occur immediately following the intervention (ie at T1 or before), leading to high scores at T1, and that this effect could be expected to dissipate over time.
In an attempt to help clarify these results, changes in attitudes were compared for individuals using the learndirect helpline more than once. No significant differences were found, although individuals using the helpline more than once had a more positive change in relation to their confidence to learn new skills; a result which narrowly missed statistical significance.
[image:30.595.75.540.77.391.2]The results were also compared between individuals who had taken part in learning (since contact with the helpline in 2002) and those who had not. In this case, a number of significant differences were found. Where there was a negative change, this was lessened for the learner group. Also, on two variables (‘information about courses is easy to find’ and ‘learning isn’t for people like me’), the direction of change was different, such that those engaged in Table 3.5: Mean change in attitude scores between two surveys (learndirect helpline users)
Attitude Variable Score T1 Mean Score T2 Mean Change Nature of change Mean N I see paying for my own learning
as an investment* 4.02 3.82 -0.20 Less likely to see learning as an investment 765 I need a way of learning that I can
do when it is convenient for me* 4.34 4.21 -0.13 Less likely to worry about convenience 774 I’m not interested in doing any
training or learning* 1.61 1.78 0.17 Less likely to be interested in doing learning 755
I’d love to do an evening class* 3.45 3.28 -0.17 Less likely to want to do an evening class 757
I prefer to spend my free time
doing things other than learning* 2.95 2.70 -0.24 More likely to want to spend free time on learning 769
I don’t have time to learn* 2.36 2.65 0.29 Less likely to have time to
learn 774
Information about courses is easy
to find 3.54 3.46 0.08 No significant change 759
I don’t have the confidence to
learn new skills 1.83 1.91 -0.05 No significant change 777
Learning is very expensive 3.37 3.30 -0.07 No significant change 746
Courses related to hobbies are as
valuable as work-related courses 4.01 4.01 0.00 No significant change 772
* the change between T1 and T2 is significant
learning actually showed a positive change on these items compared with a negative change for those who had not learnt.
Because changes in attitude from pre-intervention, or baseline levels cannot be calculated, drawing conclusions from this data is difficult. There is little evidence of a positive change in attitude between T1 and T2 but a change in attitude as a result of the use of the helpline is not being measured by this. It would appear that repeated use of the helpline has little impact on the way in which attitudes change over time, but this may simply reflect the fact that those seeking further help have more complex needs and/or less positive images of learning initially (again, without baseline attitudes it is not possible to say). Where learning has taken place, however, the positive impact on attitudes is more apparent.
3.4
Chapter summary
Learners
Among learners, by the time of the second survey, 58 per cent had used some form of IAG, with 17 per cent using the learndirect helpline, over a third using the website and 35 per cent using some other form of IAG. Learners were positive about the influence of IAG on their take-up of learning. Repeat learndirect learners were most positive about the influence of IAG, particularly the learndirect website. Overall, the learndirect helpline received more positive ratings than any other source.
Helpline users
By the time of the first survey, 17 per cent of helpline users had made another call to the learndirect advice line. Over a quarter had used the learndirect website at least once, and 69 per cent had used another source of advice. Compared to data from the National Adult Learners Survey, individuals using the helpline once are more likely than average to call again.
Ratings of the influence of IAG on the take-up of learning among helpline users was again positive. In particular, at the time of the first survey, users of the learndirect website and helpline gave higher ratings to the influence of these sources of support than any other. By the second survey, ratings of all sources were higher on average, particularly among individuals having progressed into learndirect learning and who had used the learndirect website. In all cases, users of learndirect learning were more positive than those in other learning about the influence on IAG.
little evidence of continued positive change in attitudes over time. In the absence of baseline data on attitudes, collected before their initial call to the helpline, however, it is difficult to gauge accurately how existing attitudes may have been changed by the call.
Overall
4.
Participation Rates
An important aspect of the activities of learndirect, a key aim of the organisation’s work, and a prominent policy focus is the engagement of individuals in learning. This is particularly true for those individuals without a recent learning history or without a history of positive participation. This is underpinned by the belief that learning offers benefits to the individual, the community and the economy1. In this chapter, the extent to which survey participants took part in learning and the type of learning they were involved in is examined. Further consideration is given to whether this learning involved study for qualifications.
4.1
Participation rates
4.1.1
Learners
The sample of learndirect learners obviously contains individuals who have been involved in some learning during the tracking period of this evaluation. However, it is possible to determine whether individuals had been involved in learning before their enrolment with learndirect, and the extent to which they continued in learning afterwards (Table 4.1).
1 See Education and Skills: Delivering Results: A Strategy to 2005, DfES Table 4.1: Participation rates (learndirect learners)
Participation %
Time point/period In learning Not in learning Base (N)
3 years before learndirect learning 38 62 787
At T1 48 53 776*
At T2 29 71 787
Overall participation rate** 91 9 787
* For 11 individuals, the status of learning at T1 was unclear
** Overall participation rate is the proportion of individuals who have participated in learning between the time of the first and second surveys (ie between T1 and T2)
In the three years before their involvement with learndirect learning, only 38 per cent of individuals had been engaged in some form of learning. The equivalent participation rate of NALS respondents is 76 per cent, demonstrating that the learndirect learners are far less likely to have been engaged in recent learning at the time of their initial contact with learndirect.
In the 15 month period between T1 and T2, 91 per cent were involved in learning. This figure does not include those who had completed or dropped out of their learndirect learning before T1 (completion rates are discussed in more detail in chapter 5). However, the overall participation rate is high and reflects the fact that most individuals were still engaged in their initial learndirect courses at T1.
The participation rate at T2 is a more accurate reflection of continued learning, showing almost exclusively additional learning taken after the initial learndirect course (or courses). However, it presents a ‘snapshot’ picture of participation and this rate will be an underestimation when compared with other sources which measure participation over time. The data does show that 29 per cent of individuals were still involved in some form of learning by T2.
An interesting comparator group for this result is the cohort of 2001 NALS learners who were followed-up in 2003, in the Pathways in Adult Learning (PALS) survey. The participation rate of individuals who were learning at the time of the first survey, was 32 per cent by the time of the PALS follow-up two years later. However, this figure relates to individuals engaged in learning leading to a qualification, so would be higher if all types of learning were included. It would seem, therefore, that learndirect learners are no more likely than other learners to continue to learn in the period following their initial learning.
Although these figures give a general indication of the levels of involvement in learning, it is important to determine the types of learning that this participation data relates to, particularly given our interest in learndirect learning. A comparison of participation rates at each time point and over time, for learndirect and other learning, is presented in Table 4.3. This clearly shows that although participation in learndirect courses (and in learning generally) decreases over time, where individuals are taking new courses, these are increasingly more likely to be with other providers.
Overall, by T2, 33 per cent of the sample had been involved in some form of non-learndirect learning. Ninety-one per cent of learners had been engaged in some form of learning in the period between T1 and T2, compared to a participation rate in learning (any kind) among the NALS sample of 73 per cent. However, this difference is a reflection of the fact that much of the learning among the learndirect sample is continued learning from their initial course.
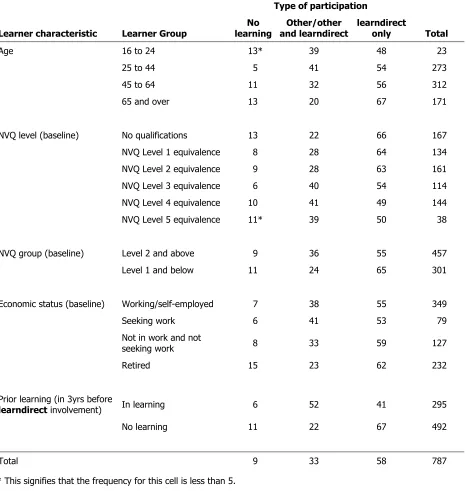
The patterns of participation also differ according to learners’ personal and educational characteristics (Table 4.4 presents the results where there was a significant difference between respondents, according to the characteristic), although not in this case, in relation to their use of IAG.
Table 4.2: Participation rates, working age population (learndirect learners)
Participation %
Data source Time point/period In learning Not in learning
learndirect learners (Base = 592) T1 48 52
Labour Force Survey Summer 2002 13 87
learndirect learners (Base = 592) T2 30 70
Labour Force Survey Autumn 2003 15 85
Source: IES, based on survey of learndirect learners, BMG 2003 and analysis of the Labour Force Survey (quarters Summer 2002 and Autumn 2003)
Table 4.3: Participation rates by type of learning (learndirect learners)
Time point/period learndirect only % and other % learndirect Other only None Base (N)
At T1 41 3 4 53 776*
At T2 14 3 12 71 787
Between T1 and T2** 58 4 29*** 9 787
* For 11 individuals, the type of learning at T1 was unclear ** Overall rates reflect any learning engaged in between T1 and T2
*** The overall participation rate is higher than the two snapshot participation rates would suggest, as a number of individuals have been involved in learning over time that were not involved in learning at the specific times of the surveys
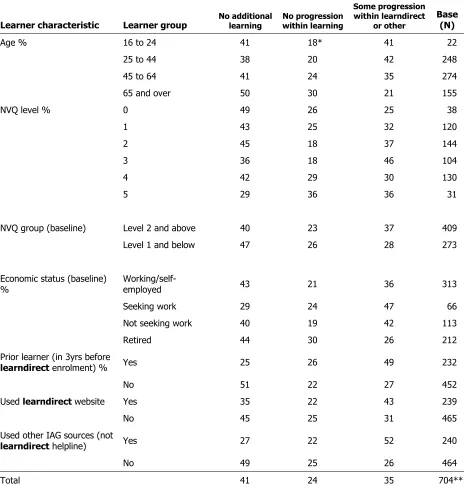
The groups most likely to have taken part in other forms of learning were:
z younger learners (aged 44 or below)
z individuals qualified to level 3 or above
z those seeking work
[image:36.595.76.542.78.569.2]z individuals who had been in learning in the three years before their involvement with learndirect.
Table 4.4: Type of overall participation by learner groups (learndirect learners)
Type of participation
Learner characteristic Learner Group
No learning
Other/other and learndirect
learndirect
only Total
Age 16 to 24 13* 39 48 23
25 to 44 5 41 54 273
45 to 64 11 32 56 312
65 and over 13 20 67 171
NVQ level (baseline) No qualifications 13 22 66 167
NVQ Level 1 equivalence 8 28 64 134
NVQ Level 2 equivalence 9 28 63 161
NVQ Level 3 equivalence 6 40 54 114
NVQ Level 4 equivalence 10 41 49 144
NVQ Level 5 equivalence 11* 39 50 38
NVQ group (baseline) Level 2 and above 9 36 55 457
Level 1 and below 11 24 65 301
Economic status (baseline) Working/self-employed 7 38 55 349
Seeking work 6 41 53 79
Not in work and not
seeking work 8 33 59 127
Retired 15 23 62 232
Prior learning (in 3yrs before
learndirect involvement) In learning 6 52 41 295
No learning 11 22 67 492
Total 9 33 58 787
* This signifies that the frequency for this cell is less than 5.
In contrast, the groups most likely to learn only with learndirect were:
z older learners (particularly those aged 65 and over)
z individuals with no or lower qualifications
z individuals not in work and not seeking work, and retired learners
z individuals with no learning history in the three years before their learndirect enrolment.
Additionally, multivariate tests were performed to determine the personal characteristics and other factors that best predict whether a learndirect learner engaged in any further learning in the period following their learndirect course. None of the variables entered were found to be significant predictors (see Appendix 3 for details of the analysis) when other factors were controlled for. This null result suggests that either there is no identifiable trend which predicts learning participation following a learning episode, or that our data does not explain this trend. The use of IAG, therefore, did not account for any variation in the propensity to take up further learning, when other factors were controlled for. It is possible that some unobserved characteristics (eg motivation levels, self-confidence, level of enjoyment of learning) might help to explain this trend.
Overall, therefore, learndirect appears to be a route into learning for those with limited experience of learning. It appeals particularly to those who are outside of the workplace, and to those with few existing qualifications. Of those with no learning in the three years before their enrolment with learndirect, 22 per cent have moved through learndirect and onto other courses. Also, participation rates are higher for learndirect learners than for the general population, even two years after their enrolment on a learndirect course. This provides further evidence that individuals are encouraged to continue on to further learning opportunities following an initial learning episode, and that for some groups, learndirect is a useful way to begin the engagement process.
4.1.2
Helpline users
learning, this is an interesting result; particularly when participation rates for those in work or of working age are compared with population data (taken from an analysis of the Labour Force Survey, see Table 4.6). The rates of participation by learndirect helpline users are much higher. However, in making this comparison, it should be noted that the helpline users sample is slightly better qualified overall (at the baseline) than the general population as indicated by the LFS.
Turning to the type of learning individuals are engaged in, (Table 4.7) 11 per cent of individuals had taken up a learndirect course at Table 4.5: Overall participation rates (learndirect helpline users)
Timepoint/period In learning % learning % Not in Base (N)
3 years before helpline use 48 52 780
T1 (2002) 22 78 780
T2 (2003) 32 68 780
Overall (any time T1 to T2) 59 41 780
In learning at any point since helpline 73 27 780
Source: IES, based on survey of learndirect helpline users, BMG, 2003
Table 4.6: Participation rates, working age population (learndirect learners)
Participation %
Data source Time point/ period In learning learning Not in
*learndirect learners (Base=725) T1 22 78
Labour Force Survey Summer 2002 13 87
learndirect learners (Base=725) T2 32 68
Labour Force Survey Autumn 2003 15 85
* These are individuals who were engaged in learndirect learning at T0. By T1/T2 they may have completed or left these courses.
Source: IES, based on survey of learndirect learners, BMG 2003 and analysis of the Labour Force Survey (quarters Summer 2002 and Autumn 2003)
Table 4.7: Participation by type of learning (learndirect helpline users)
Time point/ period
learndirect only %
learndirect and other* %
Other
only None** Base
(N)
T1 (2002) 5 N/A 16 79 771
T2 (2003) 4 1 22 73 780
Overall (any
point T1 to T2) 3 8 48 42 780
* The way that data was collected does not allow individuals to have declared both learndirect and other types of learning in the first survey
** Individuals in non-taught learning are not included to allow comparability with the learners survey data, hence the figures in this table will vary slightly from those in Table 4.5
some point since their call to the helpline and a further 48 per cent had taken part in other types of learning. Different groups of learners were compared (as for the learndirect learners data) but only one significant difference emerged (Table 4.8). Individuals who had not participated in any learning, in the three years before their call to the helpline, were less likely to have participated in the period since that call. However, two-thirds of this group had still gone on to take up some form of learning. We believe that this provides further evidence of the impact of learndirect services on individuals with less recent experience of learning. Subsequent use of the learndirect helpline did not emerge as significant.
As for the learner data, multivariate tests were performed to examine the factors that best predict whether a learndirect helpline user participated in any learning in the period following the helpline call. Again, none of the variables were found to be significant predictors (see Appendix 3 for details of the analysis).
Overall, then, learndirect helpline users are more likely to be participating in learning 15 months following their call to the helpline, than the population in general. In particular, individuals with a recent history of learning (before their helpline call) had high participation levels.
4.2
Learning leading to a qualification
Participation in learning is a pre-requisite for gaining qualifications. However, learndirect courses offer individuals the opportunity to learn without the pressure of qualifications. It is possible that by taking part in learndirect first, individuals go on to take up more formal learning opportunities. In this section, work towards qualifications is considered.
4.2.1
Learners
Among learndirect learners, participation in qualification related study increased over time, from ten per cent at T1 to 15 per cent at Table 4.8: Participation of those with and without a recent learning history (learndirect
helpline users)
Type of participation
Characteristic Group learning No In some learning Total
In learning 21 79 317
Prior learning (in 3yrs before
learndirect involvement) No learning 34 66 249
Total 27 73 780
T2 (Table 4.9). However, this is substantially lower than for NALS learners, 36 per cent of whom were studying for a qualification when surveyed in 2001, and for PALS learners (NALS learners who were followed up in 2003), 32 per cent of whom were studying for a qualification. However, this does not take account of the different profiles of the two samples (ie their different ‘starting point’) in relation to prior learning or qualification level
etc.
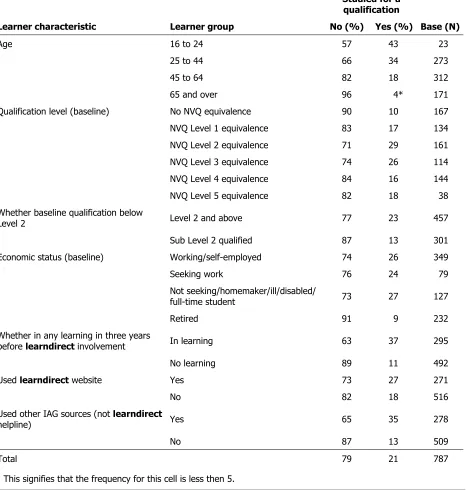
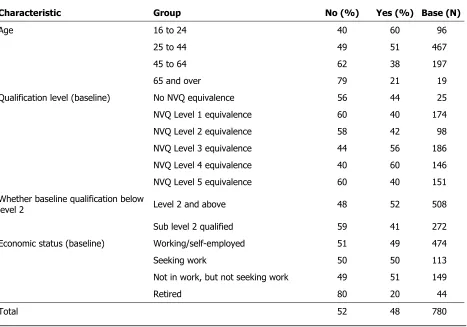
Just over one in five individuals has been involved in (or were still involved in) study leading to a qualification over the 15 months of survey tracking. In order to determine who is more likely to be studying for a qualification, these results were considered across a range of personal and educational/economic characteristics. (Table 4.10 presents the results, where there was a significant difference between respondents according to the characteristic.)
Participation in learning leading to a qualification drops off with age; the highest level of participation is among the youngest group (although numbers in this group are small). This type of learning is highest among those with mid-level baseline qualifications (ie level 2 or level 3 equivalents), and lowest among retired individuals. Those with recent experience of learning were much more likely to have participated in qualification related learning.
Multivariate tests1 were performed to examine the factors that best predict whether a learndirect learner studied for a qualification between T1 and T2. The following factors were found to be important, confirming our findings from other analyses:
z Progression: The incidence of engaging in additional learning, which is a progression from previous learning, is the strongest indicator of whether the individual studied for a qualification. As might be expected, those who progressed in their learning were more likely to be studying for a qualification. However, it should be noted that progression in learning and studying for a qualification are not synonymous. The logistic regression
1 In this case logistic regression (see Appendix 3 for further details) Table 4.9: Taking qualifications (learndirect learners subsequently)
Studying for a
qualification (%)
Time point/period No Yes Base (N)
At T1 90 10 787
At T2 85 15 787
Overall (any time T1 to T2) 79 21 787
was repeated excluding this variable, and the model remained significant.
z Age: The age of the individual is the next most significant predictor of studying for a qualification. As age increases, the likelihood of studying for a qualification diminishes.
[image:41.595.59.525.84.574.2]z Previous learning history: This is the third variable to have a significant effect upon studying for a qualification. As our other analyses would suggest, those who have been in learning in the three years leading up to their learndirect learning are more likely to have studied for a qualification in the period following.
Table 4.10: Whether studied for a qualification between T1 and T2 (learndirect learners)
Studied for a
qualification
Learner characteristic Learner group No (%) Yes (%) Base (N)
Age 16 to 24 57 43 23
25 to 44 66 34 273
45 to 64 82 18 312
65 and over 96 4* 171
Qualification level (baseline) No NVQ equivalence 90 10 167
NVQ Level 1 equivalence 83 17 134
NVQ Level 2 equivalence 71 29 161
NVQ Level 3 equivalence 74 26 114
NVQ Level 4 equivalence 84 16 144
NVQ Level 5 equivalence 82 18 38
Whether baseline qualification below
Level 2 Level 2 and above 77 23 457
Sub Level 2 qualified 87 13 301
Eco