R E S E A R C H A R T I C L E
Open Access
Evaluation of qPCR reference genes in two
genotypes of
Populus
for use in photoperiod
and low-temperature studies
Emily A Pettengill
†, Cécile Parmentier-Line
†and Gary D Coleman
*Abstract
Background:Quantitative PCR (qPCR) is a widely used technique for gene expression analysis. A common normalization method for accurate qPCR data analysis involves stable reference genes to determine relative gene expression. Despite extensive research in the forest tree speciesPopulus, there is not a resource for reference genes that meet the Minimum Information for Publication of Quantitative Real-Time PCR Experiments (MIQE) standards for qPCR techniques and analysis. SincePopulusis a woody perennial species, studies of seasonal changes in gene expression are important towards advancing knowledge of this important developmental and physiological trait. The objective of this study was to evaluate reference gene expression stability in various tissues and growth conditions in two importantPopulusgenotypes (P. trichocarpa“Nisqually 1”andP. tremulaxP. alba717 1-B4) following MIQE guidelines.
Results:We evaluated gene expression stability in shoot tips, young leaves, mature leaves and bark tissues from P. trichocarpaandP. tremula. x P. albagrown under long-day (LD), short-day (SD) or SD plus low-temperatures conditions. Gene expression data were analyzed for stable reference genes among18S rRNA, ACT2,CDC2,CYC063, TIP4-like,UBQ7,PT1andANTusing two software packages, geNormPLUSand BestKeeper. GeNormPLUSrankedTIP4-like andPT1among the most stable genes in most genotype/tissue combinations while BestKeeper rankedCDC2and ACT2among the most stable genes.
Conclusions:This is the first comprehensive evaluation of reference genes in two importantPopulusgenotypes and the only study inPopulusthat meets MIQE standards. Both analysis programs identified stable reference genes in both genotypes and all tissues grown under different photoperiods. This set of reference genes was found to be suitable for either genotype considered here and may potentially be suitable for otherPopulusspecies and genotypes. These results provide a valuable resource for thePopulusresearch community.
Keywords:RT-qPCR, Reference gene validation,Populus trichocarpa,Populus tremula x Populus alba
Background
Grown for timber, paper and bioenergy, the forest tree genus Populus is one of the most widely cultivated tree genera and has become a model for tree research [1]. Within this genus, two genotypes,P. trichocarpaand the hybrid P. tremula x P. alba are frequently used in molecular and genomic research. P. trichocarpa (Torr. And Gray) genotype ‘Nisqually-1’ has become a vital resource since completion of genome sequence [2] while
P. tremula x P. alba clone INRA no. 717-1B4 is widely used for molecular biology research because of the ease and efficiency of in vitroshoot regeneration and genetic transformation methods [3]. These two genotypes have been extensively used to study seasonal nitrogen cycling and storage, SD associated growth cessation, leaf senes-cence, bud development and dormancy [4-11]. Identify-ing stable reference genes in various tissues in plants grown in both SD and LD conditions will help facilitate future research of seasonal traits inPopulususing qPCR. Results from qPCR assays and the conclusions based on qPCR data, have been an invaluable source for study-ing gene expression yet the broad application of qPCR * Correspondence:[email protected]
†Equal contributors
Department of Plant Science and Landscape Architecture, University of Maryland, College Park, Maryland 20742-4452, USA
methods requires standards that promote accuracy, re-producibility and transparency. There has been rapid adoption of a specific set of standards termed the Mini-mum Information for the Publication of Real-time Quantitative PCR Experiments (MIQE) [12-14]. The MIQE guidelines are a set of ideal practices for qPCR experiments that aim to reduce the publication of in-accurate data that could be interpreted to make incor-rect or misleading scientific conclusions. The scope of the guidelines is extensive and includes stipulations for experimental design, sample acquisition, preparation and quality control, reverse transcription and qPCR reactions and data analysis. The guidelines also encompass rules related to nomenclature, particularly using the term quantification cycle (Cq) instead of threshold cycle (Ct) and the term reference genes as opposed to housekeep-ing genes [12]. Despite the wide acceptance of the need for experimental and publication standards, Gutierrez et al. [15] and Guenin et al. [16] note that plant biology research has been slow to adopt these standards and these guidelines are often ignored in publications.
An important component of the MIQE guidelines is the appropriate analysis of raw fluorescence data to normalize technical variation. A routine method incor-porates data from stable reference genes to calculate relative gene expression. Stable reference genes are gen-erally defined as genes with uniform transcript abun-dance across all samples that is above background fluorescence levels [17]. This is determined by statistical analyses that estimate gene expression stability for a set of candidate reference genes. Data for stable reference genes can then be included in normalization analyses [16]. QPCR validation is crucial for accurate data ana-lysis and involves techniques that test if fluorescence data are a direct measure of gene expression in experi-mental samples [12]. This concept is illustrated by PCR amplification efficiencies (E), which are calculated by quantifying the increase of amplified product after each thermocycle in samples with a range of transcript abun-dance [12,18]. For example, aberrant product synthesis due to enzymatic inhibitors or secondary structures of the primers may not reflect the actual transcript quantity [18,19]. PCR efficiency values for each primer pair are included in calculations for stability and relative gene ex-pression analyses [20,21].
Two reports that fail to conform to the publication standards outlined in the MIQE guidelines have been published evaluating reference genes for qPCR analysis in Populus [22,23]. The first report by Brunner et al. [22], omits the PCR efficiencies for each primer pair as well as the size of the amplification product. This work used ANOVA and linear regression techniques that have been supplanted by the availability of advanced statistical programs that rank reference gene stability [20,21]. In
the second report by Xu et al. [23], all efficiencies are out-side of the range of acceptable efficiencies (E = 1.9-2.1), indicative of possible unreliable product amplification that questions the validity of the findings [18,24]. Besides the technical aspects of these previous studies, both studies also used interspecific hybrids (P. deltoides x P. nigra or P. trichocarpa x P. deltoides) to conduct the analysis. Because of the lack of a detailed report of qPCR reference genes that conform to MIQE guidelines in poplar we con-ducted a MIQE compliant examination of reference genes in two poplar genotypes that are extensively used in gen-omic and transgenic studies, P. trichocarpa(Nisqually-1) andP. tremula x P. albaclone 717 1-B4.
In this study we report on the gene expression stability of 8 candidate reference genes (18S rRNA,ACT2,CDC2, CYC063,TIP4-like, ANT,UBQ7, andPT1) in 4 different tissues from plants grown under various photoperiodic conditions. Analyses were performed with the software packages geNormPLUS and BestKeeper. The results of this study provide a resource for Populus researchers and demonstrates the use of MIQE guidelines to the study of poplar gene expression.
Results
Candidate reference genes selection, PCR efficiency and expression profiles
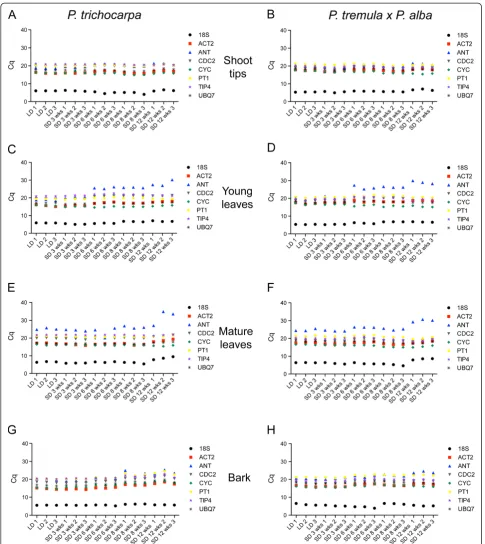
To evaluate candidate reference genes for gene expres-sion studies in P. trichocarpa and P. tremula x P. alba, qPCR assays were performed on triplicate biological samples from shoot tips, young leaves, mature leaves and bark at 5 time points under long day or short day photoperiods and short day photoperiods supplemented with low-temperatures. Reference genes were selected from existing literature onPopulus(Table 1).
which is particularly evident in young and mature leaves of SD treated plants (Figure 1, C, D, E, F). Shoot tips/ buds and bark samples exhibited the least variation in mean Cq values of all genes amongst all the tissues.
GeNormPLUSanalyses
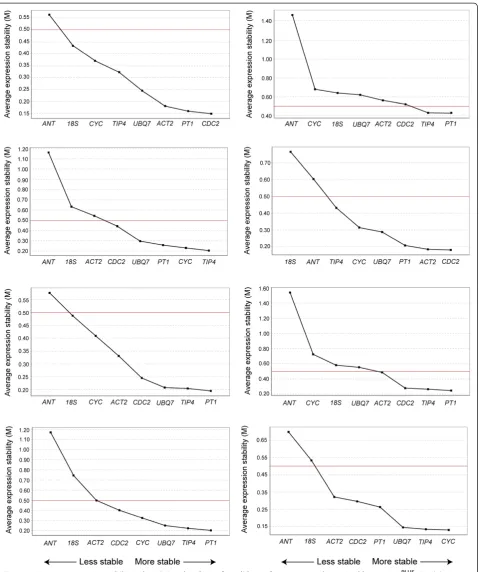
We determined the expression stability of the candidate reference genes using the geNormPLUS program within qbasePLUSversion 3. In these analyses we assumed that none of the selected genes were co-regulated since this is a prerequisite for geNormPLUS analysis. GeNormPLUS calculates the average gene expression stability (M) from the variation of the expression ratios of each pair of reference genes. This is based on the theory that two stable genes should share an identical expression ratio in all samples [21,28]. Lower M values indicate more stable gene expression with an upper threshold of M = 0.5, above which the reference genes are not considered stable. GeNormPLUS ranked the candidate reference genes according to their M values, from least stable to most stable (Figure 2). PT1 was ranked within the top
three most stable genes for 7 out of the 8 genotype/ tissue combinations andTIP4-likewas ranked within the top three most stable genes for 5 out of the 8 genotype/ tissue combinations.ANTand18S rRNAwere ranked as the least stable genes in 6 out of the 8 genotype/tissue combinations. Ranking profiles differed for the same tissues between the two Populus genotypes. Genes were ranked at the same position in only 12 instances when comparing the two genotypes. Compared to other tis-sues, bark showed the greatest variation in stability rank-ing between the two genotypes of the reference genes. In contrast, young leaves showed the most similarities with 5 genes ranking at the same position for both geno-types: PT1 and TIP4-like as the most stable and 18S rRNA,CYC063andANTas the least stable.
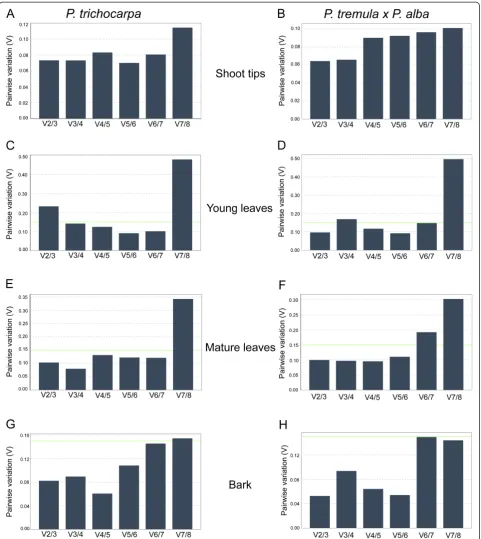
[image:3.595.56.542.99.244.2]GeNormPLUS also determines the minimum number of reference genes to include in normalization analysis by calculating the average pairwise variation (V) of normalization factors which is determined by the two most stable genes and the addition of the next most stable gene until all genes have been added [28]. It has a
Table 2 Characteristics of qPCR primers pairs for candidate reference genes
Gene Primers (5'-3') Product
size (bp)
Annealing
temp (°C) P. trichocarpaPCR efficiency P. tremula x P. albaPCR efficiency
TIP4-like F: GCTGATAATGGGGTGTCG R: CAACTCTAAGCCAGAATCGC 88 57 1.969 2.018
CYC063 F: CCTGGCACTAATGGGTCTCAG R: CACAACTCTTCCGAACACCAC 87 52 1.98 1.978
PT1 F: GCGGAAAGAAAAACTGCAAG R: TGACAGCACAGCCCAATAAG 126 57 2.025 2.083
CDC2 F: ATTCCCCAAGTGGCCTTCTAAG R: TATTCATGCTCCAAAGCACTCC 137 57 2.04 2.035
ACT2 F: TTCTACAAGTGCTTTGATGGTGAGTTC R:CTATTCGATACATAGAA-GATCAGAATGTTC
159 52 1.935 1.951
18S rRNA F: GATTCTATGGGTGGTGGTGC R: CAGGCTGAGGTCTCGTTCG 87 60 1.951 1.965
ANT F: TCTGTCTGTTATGCCCCTCA R: CCACCTAGGAAGTCCTCCAGT 119 55 2.062 2.033
UBQ7 F: GGAACGGGTTGAGGAGAAAGAAG R: GCAAGAACAAGATGAAG-CACAGAGC
135 55 2.028 2.016
[image:3.595.56.540.568.716.2]Primer sequences, PCR product sizes, annealing temperatures, PCR amplification efficiencies inP. trichocarpaandP. tremula x P. albafor each candidate reference gene.
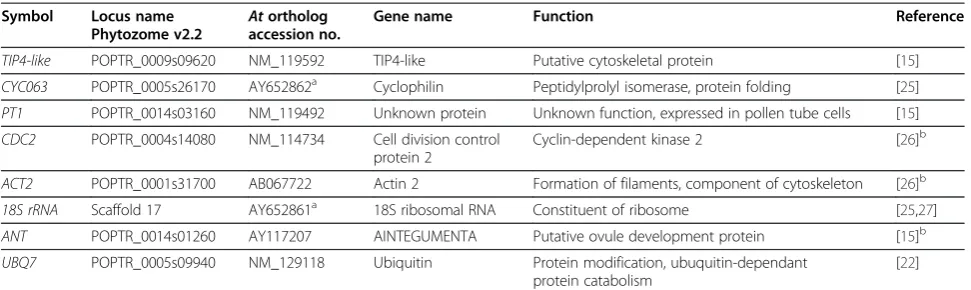
Table 1 List and description of candidate reference genes for qPCR
Symbol Locus name
Phytozome v2.2 At ortholog accession no.
Gene name Function Reference
TIP4-like POPTR_0009s09620 NM_119592 TIP4-like Putative cytoskeletal protein [15]
CYC063 POPTR_0005s26170 AY652862a Cyclophilin Peptidylprolyl isomerase, protein folding [25]
PT1 POPTR_0014s03160 NM_119492 Unknown protein Unknown function, expressed in pollen tube cells [15]
CDC2 POPTR_0004s14080 NM_114734 Cell division control protein 2
Cyclin-dependent kinase 2 [26]b
ACT2 POPTR_0001s31700 AB067722 Actin 2 Formation of filaments, component of cytoskeleton [26]b
18S rRNA Scaffold 17 AY652861a 18S ribosomal RNA Constituent of ribosome [25,27]
ANT POPTR_0014s01260 AY117207 AINTEGUMENTA Putative ovule development protein [15]b
UBQ7 POPTR_0005s09940 NM_129118 Ubiquitin Protein modification, ubuquitin-dependant protein catabolism
[22]
Gene symbol,Populuslocus name (Phytozome), NCBIArabidopsis thalianaortholog accession number, gene name, function (annotation from Phytozome) and reference for each gene.
a
accession number forPopulus.
b
cut-off value of 0.15, below which the addition of another reference gene has no significant effect and is not required. For samples of young leaves fromP. trichocarpa, pairwise variation analysis showed that normalization
[image:4.595.56.542.87.632.2]should be performed with 3 reference genes since the V2/3 value was higher than 0.15 (Figure 3). For all other tissues, the two most stable reference genes were sufficient to give a V value below 0.15.
Figure 2Average expression stability values (M) and ranking of candidate reference genes determined by geNormPLUS.Candidate
BestKeeper analyses
BestKeeper determines stable expression by first calcu-lating descriptive statistics for each reference gene using the mean Cq data of the technical replicates for each
[image:6.595.58.540.88.628.2]sample. Then, using pairwise correlation analysis, the program compares each reference gene to the Best-Keeper Index (BKI) and calculates a Pearson’s correla-tion coefficient (r) and p-value [20]. Higher correlation Figure 3Determination of optimal number of reference genes by geNormPLUS.Pairwise variation (V) analyses were performed to determine
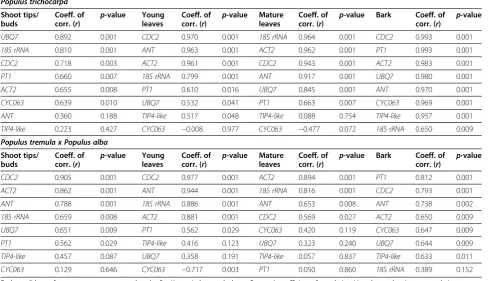
coefficients suggest more stable expression. Table 3 shows the ranking of reference genes with corresponding (r) and p-values as determined by BestKeeper. CDC2 was one of the 3 most stable genes in 7 of the 8 geno-type/tissue combinations (r≥0.718, p-value = 0.001). ACT2 was ranked as one of the 3 most stable genes in 5 of the 8 genotype/tissue combinations (r≥0.862, p-value = 0.001). Conversely, BestKeeper ranked TIP4-like as the least or second least stable gene in 6 out of 8 genotype/tissue combinations with the lowest cor-relation values of r= 0.057 (p-value = 0.837) in mature leaves of P. tremula x P. alba. Despite a low ranking in the bark of P. trichocarpa, TIP4-like expression had a high correlation coefficient and significant p-value (r= 0.957, p-value = 0.001) when compared to the BKI. Rankings between the different tissues of the two geno-types were very distinct. Pfaffl et al. [20] recommend that if the standard deviation of the mean Cq values for repli-cates for a reference gene is greater than 1 then the data is considered inconsistent and calculations should be performed again without these genes. We observed standard deviations greater than 1 in all genotype/ tissue combinations except shoot tips (Additional file 1: Table S1). These reference genes were removed and the data was reanalyzed. Removing these genes did not change the overall rankings for the remaining genes but resulted in increased correlation coefficients (r) for
most of the remaining reference genes (Additional file 1: Table S1).
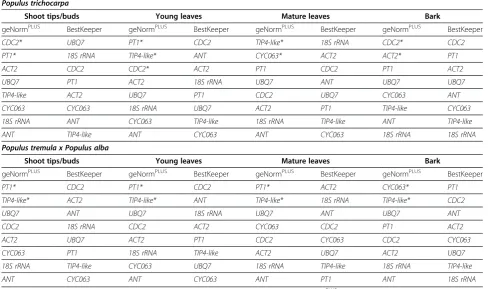
GeNormPLUSversus BestKeeper
[image:7.595.56.547.439.720.2]In comparing candidate reference gene stability rankings produced by geNormPLUSand BestKeeper, we found that these two programs ranked the reference genes differ-ently (Table 4). For instance, BestKeeper frequdiffer-ently assigned ANT a middle ranking and even ranked it as the second most stable gene in young leaves of both genotypes. On the other hand, geNormPLUS con-sistently rankedANTas the least or second least stable gene in all tissues. The rankings of 18S rRNA by geNormPLUS and BestKeeper also showed differences. 18S rRNAranked as the least or second least stable gene when analyzed by geNormPLUS while BestKeeper assigned18S rRNAa high or middle ranking except for bark tissues where it was ranked as one of the least stable genes. There were only 4 occurrences inP. tricho-carpa where the two programs gave the same ranking for a gene: CYC063 in shoot tips and CDC2, UBQ7 and 18S rRNA in bark. In all tissues of P. tremula x P. alba and in mature leaves of P. trichocarpa, the genes recommended by geNormPLUS for normalization calculations were ranked amongst the 4 least stable genes by BestKeeper.
Table 3 Pairwise correlation analyses using BestKeeper
Populus trichocarpa Shoot tips/ buds
Coeff. of corr. (r)
p-value Young leaves
Coeff. of corr. (r)
p-value Mature leaves
Coeff. of corr. (r)
p-value Bark Coeff. of corr. (r)
p-value
UBQ7 0.892 0.001 CDC2 0.970 0.001 18S rRNA 0.964 0.001 CDC2 0.993 0.001
18S rRNA 0.810 0.001 ANT 0.963 0.001 ACT2 0.962 0.001 PT1 0.993 0.001
CDC2 0.718 0.003 ACT2 0.961 0.001 CDC2 0.943 0.001 ACT2 0.983 0.001
PT1 0.660 0.007 18S rRNA 0.799 0.001 ANT 0.917 0.001 UBQ7 0.980 0.001
ACT2 0.655 0.008 PT1 0.610 0.016 UBQ7 0.845 0.001 ANT 0.970 0.001
CYC063 0.639 0.010 UBQ7 0.532 0.041 PT1 0.663 0.007 CYC063 0.969 0.001
ANT 0.360 0.188 TIP4-like 0.517 0.048 TIP4-like 0.088 0.754 TIP4-like 0.957 0.001
TIP4-like 0.223 0.427 CYC063 −0.008 0.977 CYC063 −0.477 0.072 18S rRNA 0.650 0.009 Populus tremula x Populus alba
Shoot tips/ buds
Coeff. of corr. (r) p
-value Young leaves
Coeff. of corr. (r) p
-value Mature leaves
Coeff. of corr. (r) p
-value Bark Coeff. of corr. (r) p
-value
CDC2 0.905 0.001 CDC2 0.977 0.001 ACT2 0.894 0.001 PT1 0.812 0.001
ACT2 0.862 0.001 ANT 0.944 0.001 18S rRNA 0.816 0.001 CDC2 0.793 0.001
ANT 0.788 0.001 18S rRNA 0.886 0.001 ANT 0.653 0.008 ANT 0.738 0.002
18S rRNA 0.659 0.008 ACT2 0.881 0.001 CDC2 0.569 0.027 ACT2 0.650 0.009
UBQ7 0.651 0.009 PT1 0.562 0.029 CYC063 0.420 0.119 CYC063 0.647 0.009
PT1 0.562 0.029 TIP4-like 0.416 0.123 UBQ7 0.323 0.240 UBQ7 0.644 0.009
TIP4-like 0.457 0.087 UBQ7 0.358 0.191 TIP4-like 0.057 0.837 TIP4-like 0.633 0.011
CYC063 0.129 0.646 CYC063 −0.717 0.003 PT1 0.050 0.860 18S rRNA 0.389 0.152
Discussion
Recent reports have questioned the validity of selecting reference genes for qPCR analysis of gene expression based on results from other species or different experi-mental regimes [15,16,29-31]. In this report we under-took a stability analysis of 8 reference genes expressed in various tissues of two genotypes ofPopulus grown in LD and SD conditions. The stability of the reference genes was then determined using two different pro-grams: geNormPLUSand BestKeeper. In addition to these two programs, NormFinder is another program that measures reference gene expression stability [32]. To-gether, these are the three widely cited programs used for stability analysis. GeNormPLUS has been cited over 4,000 times, followed by NormFinder with over 650 cita-tions and BestKeeper with over 500 citacita-tions (deter-mined by Google Scholar search). In contrast to geNormPLUSand BestKeeper, NormFinder requires defin-ing two or more groups of samples composed of at least eight samples per group for accurate analysis [32]. Since our experimental design did not meet these require-ments NormFinder was not included in this study.
Irrespective of the analysis program used to determine reference gene stability, the most stable reference genes vary among tissues of both genotypes. Besides variation in gene expression stability between tissues within a
genotype, it was also found that reference gene stability also varies between genotypes within a given tissue. For example, in shoot tips/buds CDC2 was ranked by geNormPLUS as the most stable reference gene in P. trichocarpa but ranked as the fourth most stable reference gene in P. tremula x P. alba (Table 4). Best-Keeper ranked UBQ7 as the most stable reference gene in shoot tips/buds inP. trichocarpaand as the fifth most stable gene in P. tremula x P. alba. This difference of ranking in the same tissues of the two genotypes oc-curred regardless of the program used. Although, geN-ormPLUSrankings between genotypes of the least stable reference genes were more consistent than rankings of the most stable genes. Previous studies on coffee and pe-tunia [33,34] also concluded that reference genes were different in different tissues for a single genotype and also for the same tissue between different genotypes. This variation in reference gene stability underscores the importance of empirically testing all samples in an ex-periment to validate reference gene stability.
[image:8.595.55.548.104.393.2]This report is a rigorous evaluation of reference gene stability in Populus and a valuable resource when com-pared to previous reports in Populus [22,23]. Beside our adherence to the MIQE guidelines, there are additional distinctions between this report and previous reports. Brunner et al. [22] determined reference gene stability
Table 4 Comparison of stability rankings between geNormPLUSand BestKeeper
Populus trichocarpa
Shoot tips/buds Young leaves Mature leaves Bark
geNormPLUS BestKeeper geNormPLUS BestKeeper geNormPLUS BestKeeper geNormPLUS BestKeeper
CDC2* UBQ7 PT1* CDC2 TIP4-like* 18S rRNA CDC2* CDC2
PT1* 18S rRNA TIP4-like* ANT CYC063* ACT2 ACT2* PT1
ACT2 CDC2 CDC2* ACT2 PT1 CDC2 PT1 ACT2
UBQ7 PT1 ACT2 18S rRNA UBQ7 ANT UBQ7 UBQ7
TIP4-like ACT2 UBQ7 PT1 CDC2 UBQ7 CYC063 ANT
CYC063 CYC063 18S rRNA UBQ7 ACT2 PT1 TIP4-like CYC063
18S rRNA ANT CYC063 TIP4-like 18S rRNA TIP4-like ANT TIP4-like
ANT TIP4-like ANT CYC063 ANT CYC063 18S rRNA 18S rRNA
Populus tremula x Populus alba
Shoot tips/buds Young leaves Mature leaves Bark
geNormPLUS BestKeeper geNormPLUS BestKeeper geNormPLUS BestKeeper geNormPLUS BestKeeper
PT1* CDC2 PT1* CDC2 PT1* ACT2 CYC063* PT1
TIP4-like* ACT2 TIP4-like* ANT TIP4-like* 18S rRNA TIP4-like* CDC2
UBQ7 ANT UBQ7 18S rRNA UBQ7 ANT UBQ7 ANT
CDC2 18S rRNA CDC2 ACT2 CYC063 CDC2 PT1 ACT2
ACT2 UBQ7 ACT2 PT1 CDC2 CYC063 CDC2 CYC063
CYC063 PT1 18S rRNA TIP4-like ACT2 UBQ7 ACT2 UBQ7
18S rRNA TIP4-like CYC063 UBQ7 18S rRNA TIP4-like 18S rRNA TIP4-like
ANT CYC063 ANT CYC063 ANT PT1 ANT 18S rRNA
Candidate reference genes ordered from most stable (top) to least stable (bottom) for each tissue by geNormPLUS
and BestKeeper inP. trichocarpaandP. tremula x P. alba. Reference genes indentified by geNormPLUS
using ANOVA and linear regression analyses while we used currently available methods capable of more refined statistics. An additional difference between the current study and Brunner et al. [22] is that primers used in their study were designed from a limited number of ESTs, whereas we designed primers using sequences from thePopulusgenome, which is a more complete re-source. Xu et al. [23] used the same programs we used to evaluate stable reference genes in bark and root tissues during adventitious root formation. However, the reported amplification efficiencies were outside the range suggested by the MIQE guidelines making it difficult to determine the accuracy of their stability rankings. Finally, in this report we performed reference gene evaluations using the two importantPopulus geno-types, P. trichocarpa “Nisqually 1” and P. tremula x P. alba717 1-B4.
Consistent with prior reports, our results found that stability rankings were not consistent amongst geNormPLUSand BestKeeper programs [23,35,36]. These discrepancies are a consequence of the different statis-tical methods that the programs are based. BestKeeper performs pairwise correlation analysis using Cq values compared to an index value while geNormPLUS calcu-lates the ratio of variation between pairs of reference genes. ANT is a good example of the differences between stability rankings. While ANT is not generally considered to be a reference gene, it was included in this study as a gene with documented variable expression in cambium [15]. The mean Cq distributions of ANT clearly confirm expression in all genotype/tissue combi-nations we studied making ANT a suitable candidate reference gene to test. The mean Cq distributions show that ANT expression is variable (Figure 1). Consistent with the report of variableANTexpression, geNormPLUS ranked ANTas the overall least stable gene in all geno-type/tissue combinations. Yet BestKeeper assigned, in most cases, a high rank toANT. Although geNormPLUS rankedANTas one of the least stable reference genes in both genotypes and range of tissues, there may be unique conditions in which ANT could be used as a reference gene. For example, the Cq distributions in bark in P. trichocarpa indicate that ANT appears stable in samples up to 6 weeks of SD exposure (Figure 1, G). This could account for the high correlation coefficients ofANT (r = 0.970,p= 0.001) in this tissue type as calcu-lated by BestKeeper (Table 3). Additionally, geNormPLUS generally ranked the expression of 18S rRNA as unstable in all genotype/tissue combinations while Best-Keeper tended to rank this gene unstable in bark and more stable in the other tissues. The graphs of Cq distri-butions show that Cq values for 18S rRNA do not appear to be as stable compared to the other reference genes (Figure 1) and the Cq distributions more closely
agree with the assigned rankings by geNormPLUSthan by BestKeeper. This calls attention to the importance of reviewing the Cq distributions in conjunction with the ranking profiles by expression stability programs for confirmation of stability. Regardless of its stability, inclu-sion of 18S rRNA as a reference gene for qPCR assays requires cDNA synthesized with random primers instead of oligodT primers. It is common to synthesize cDNA with oligodT primers to limit sample complexity when investigating differential expression by qPCR. Therefore, omitting 18S rRNA as a reference gene would allow a researcher to maintain a low sample complexity when synthesizing cDNA. For those reasons we do not recom-mend18S rRNA.
The purpose of this study was not to provide specific reference gene recommendations but to offer a set of rigorously tested reference genes that are potentially suitable as reference genes for expression analyses in Populus. Testing the PCR efficiencies of primer pairs in both genotypes revealed that PCR efficiencies were simi-lar although not identical yet within the acceptable range. It is probable that these primers may also be suit-able for use in other Populus species provided that adequate PCR efficiencies are validated [37].
Researchers should carefully choose a gene stability analysis program that fits their experimental needs. Each program has limitations and specific requirements for analyses. For example, NormFinder requires at least 2 groups of 8 or more samples for accurate analyses [32]. This is significant because it can be difficult to define logical groups that comprise an adequate number of samples within a group. There are reports in which samples are grouped in multiple ways, which affected the calculations and rankings [38,39]. Results from Best-Keeper can be difficult to interpret, as illustrated in this paper. High correlation coefficients and significant p-values can be calculated even for unstable reference genes. When considering geNormPLUS, researchers should take into account that the program currently does not perform analyses for a reference gene if the Cq data were collected from more than one plate, which may be impractical for large studies. Therefore, the choice of analysis program must be appropriate for the experi-mental design.
This offers an advantage in accurate normalization calcu-lations compared to analysis with NormFinder or Best-Keeper. If using these programs, including 3 or more stable reference genes is suggested as a “universally applicable method”[17]. In this study, geNormPLUSis the program that best fits our experimental needs. It differ-entiates between biological and technical replicates and calculates the best number of reference genes needed for normalization. More practically, it is the most user-friendly program with clear indications of the most stable reference genes as well as integrated alerts that inform users of data errors or omissions.
Conclusions
In this study it was possible to identify stable reference genes that can be employed to investigate changes in dif-ferential gene expression in Populus under controlled environments including LD, SD and SD with low tem-peratures. Rigorous testing of candidate reference genes can be time and energy intensive but it is crucial to obtaining valuable scientific conclusions. Here we pro-vide a set of established reference genes for which we tested the normalization potential in a study of their expression stability in two poplar genotypes. We also conclude that geNormPLUS is the most useful program to determine the stability of reference genes. It calculates stability based on rigorous statistical methods, and inte-grates calculations to determine the appropriate number of reference genes for normalization and it is user-friendly. This report emphasizes the importance of the MIQE recommendations and promotes the continued adoption of the recommendations by researchers study-ingPopulus.
Methods Plant material
P. trichocarpa(Nisqually-1) plants were grown from cut-tings prepared from greenhouse grown plants. P. tre-mula x P. albaclone (717 1-B4) plants were propagated usingin vitroshoot cultures and rooted plantlets. Plants of both genotypes were grown in 2.2 L pots containing a commercial potting mix (Sunshine LC1) and fertilized with approximately 5 g of the slow release fertilizer (Nutricote, 18-3-3; Florikan, Sarasota, FL, USA). All photoperiod studies were conducted in controlled envir-onment chambers (Conviron Inc., Winnipeg, Manitoba, Canada) at 18°C with a PAR at 50 cm above the surface of pots, ranging from 310–470μmol m-2s-1.
To study the effect of changing photoperiods, plants were grown for 8 weeks in long-days (LD;16 h light/8 h dark) followed by short-days (SD; 8 h light/16 h dark) for an additional 12 weeks. During the last 4 weeks in SD, the temperature was lowered to 10°C day/4°C night. Various tissues were collected at 5 time points: 8 weeks
LD and after 3, 6, 8 and 12 weeks SD. The tissues included apical shoot tips/buds, bark (between leaf plas-tochron index 8 and 9 [LPI 8–9]), young leaves (LPI 3) and mature leaves (LPI 9). Samples were immediately frozen in liquid N2and stored at −80°C until used for
RNA extraction. Triplicate biological samples were com-posed of the pooled tissues from 4 individuals (total of 12 plants).
Design and validation of qPCR primers
Primers were designed using MacVector version 11 (MacVector Inc., Cary, NC, USA) based on the following criteria: 18–25 nucleotides in length, GC content of 40-60%, product length ~60-150 bp, and designed to amp-lify products within 500 bp of the 3’end [19,24]. Primers were tested for optimum annealing temperature using a temperature gradient and for specificity with a melt curve. PCR amplification efficiencies for all primer pairs were calculated by the iQ5 software (Bio-Rad, Hercules, CA, USA) from a five-point calibration curve of ten-fold serial dilutions. Melt curves were performed for every run to confirm amplification of a single product.
RNA extraction, cDNA synthesis and qPCR detection Total RNA was extracted using the RNeasy plant mini kit with the automated QIAcube (Qiagen, Valencia, CA, USA). Samples were ground in liquid N2 with a
Statistical analyses
Data from the iQ5 Real-Time Detection System (Bio-Rad, Hercules, CA, USA) were analysed with geNormPLUS in qbasePLUS version 3 (http://www.qbaseplus.com) and Best-Keeper version 1 (http://gene-quantification.com/bestkeeper. html) [20].
Additional file
Additional file 1:BestKeeper input and output data.Cq distributions, descriptive statistics, pairwise correlation analysis tables, correlation coefficient values for first and second analyses.
Competing interests
The authors declare that they have no competing interests.
Authors’contributions
EAP designed primers, designed experiments, collected and analyzed data and wrote the manuscript. CPL extracted and analyzed RNA, designed experiments, collected and analyzed data and edited the manuscript. GDC oversaw the project and edited the manuscript. All authors read and approved the final manuscript.
Acknowledgements
This research was supported by NSF grant IOS 0922650
Received: 1 February 2012 Accepted: 29 June 2012 Published: 23 July 2012
References
1. Taylor G:Populus: arabidopsis for forestry. Do we need a model tree?Ann Bot2002,90(6):681.
2. Tuskan GA, Difazio S, Jansson S, Bohlmann J, Grigoriev I, Hellsten U, Putnam N, Ralph S, Rombauts S, Salamov A,et al:The genome of black cottonwood,Populus trichocarpa(Torr. and Gray).Science2006,
313(5793):1596–1604.
3. Leple J, Brasileiro A, Michel M, Delmotte F, Jouanin L:Transgenic poplars-expression of chimeric genes using 4 different constructs.Plant Cell Reports1992,11(3):137–141.
4. Davis J, Egelkrout E, Coleman G, Chen T, Haissig B, Riemenschneider D, Gordon M:A family of wound-induced genes inPopulusshares common features with genes encoding vegetative storage proteins.Plant MolBiol 1993,23(1):135–143.
5. Zhu B, Coleman G:Phytochrome-mediated photoperiod perception, shoot growth, glutamine, calcium, and protein phosphorylation influence the activity of the poplar bark storage protein gene promoter (bspA).Plant Physiol2001,126(1):342–351.
6. Zhu B, Coleman G:The poplar bark storage protein gene (Bspa) promoter is responsive to photoperiod and nitrogen in transgenic poplar and active in floral tissues, immature seeds and germinating seeds of transgenic tobacco.Plant MolBiol2001,46(4):383–394.
7. Bhalerao R, Keskitalo J, Sterky F, Erlandsson R, Bjorkbacka H, Birve S, Karlsson J, Gardestrom P, Gustafsson P, Lundeberg J,et al:Gene expression in autumn leaves.Plant Physiol2003,131(2):430–442.
8. Andersson A, Keskitalo J, Sjodin A, Bhalerao R, Sterky F, Wissel K, Tandre K, Aspeborg H, Moyle R, Ohmiya Y,et al:A transcriptional timetable of autumn senescence.Genome Biol2004,5(4):R24.
9. Druart N, Johansson A, Baba K, Schrader J, Sjödin A, Bhalerao RR, Resman L, Trygg J, Moritz T, Bhalerao RP:Environmental and hormonal regulation of the activity-dormancy cycle in the cambial meristem involves stage-specific modulation of transcriptional and metabolic networks.The Plant Journal2007,50(4):557–573.
10. Ruttink T, Arend M, Morreel K, Storme V, Rombauts S, Fromm J, Bhalerao RP, Boerjan W, Rohde A:A molecular timetable for apical bud formation and dormancy induction in poplar.The Plant Cell2007,19(8):2370–2390. 11. Resman L, Howe G, Jonsen D, Englund M, Druart N, Schrader J, Antti H,
Skinner J, Sjodin A, Chen T,et al:Components acting downstream of short day perception regulate differential cessation of cambial activity and
associated responses in early and late clones of hybrid poplar.Plant Physiol2010,154(3):1294–1303.
12. Bustin S, Benes V, Garson J, Hellemans J, Huggett J, Kubista M, Mueller R, Nolan T, Pfaffl M, Shipley G:The MIQE guidelines: minimum information for publication of quantitative real-time PCR experiments.Clin Chem 2009,55(4):611.
13. Bustin S:Why the need for qPCR publication guidelines? The case for MIQE.Methods2010,50(4):217–226.
14. Bustin SA, Benes V, Garson JA, Hellemans J, Huggett J, Kubista M, Mueller R, Nolan T, Pfaffl MW, Shipley GL,et al:Primer sequence disclosure: a clarification of the MIQE guidelines.Clin Chem2011,57:919–921. 15. Gutierrez L, Mauriat M, Guenin S, Pelloux J, Lefebvre J-F, Louvet R,
Rusterucci C, Moritz T, Guerineau F, Bellini C,et al:The lack of a systematic validation of reference genes: a serious pitfall undervalued in reverse transcription-polymerase chain reaction (RT-PCR) analysis in plants.Plant Biotech Journal2008,6(6):609–618.
16. Guenin S, Mauriat M, Pelloux J, Van Wuytswinkel O, Bellini C, Gutierrez L:
Normalization of qRT-PCR data: the necessity of adopting a systematic, experimental conditions-specific, validation of references.Journal Exp Botany2009,60(2):487–493.
17. Derveaux S, Vandesompele J, Hellemans J:How to do successful gene expression analysis using real-time PCR.Methods2010,50(4):227–230. 18. Taylor S, Wakem M, Dijkman G, Alsarraj M, Nguyen M:A practical approach
to RT-qPCR–Publishing data that conform to the MIQE guidelines.
Methods2010,50(4):S1–S5.
19. Udvardi MK, Czechowski T, Scheible W-R:Eleven golden rules of quantitative RT-PCR.Plant Cell2008,20(7):1736–1737.
20. Pfaffl M, Tichopad A, Prgomet C, Neuvians T:Determination of stable housekeeping genes, differentially regulated target genes and sample integrity: BestKeeper–Excel-based tool using pair-wise correlations.
Biotech letters2004,26(6):509–515.
21. Hellemans J, Mortier G, De Paepe A, Speleman F, Vandesompele J:qBase relative quantification framework and software for management and automated analysis of real-time quantitative PCR data.Genome Biol2007,
8:R19.
22. Brunner A, Yakovlev I, Strauss S:Validating internal controls for quantitative plant gene expression studies.BMC Plant Biology2004,
4:14.
23. Xu M, Zhang B, Su X, Zhang S, Huang M:Reference gene selection for quantitative real-time polymerase chain reaction inPopulus.Analytical Biochem2011,408(2):337–339.
24. Biorad:Real-time PCR applications guide. http://www.xpcrx.com/data/ working/library/1_DNA/REFERENCE%20-%20Real-Time_PCR_Applications_ Guide_(0612_RevB).pdf.
25. Brentner L, Mukherji S, Merchie K, Yoon J, Schnoor J, Aken B:Expression of glutathione S-transferases in poplar trees (Populus trichocarpa) exposed to 2, 4, 6-trinitrotoluene (TNT).Chemosphere2008,73(5):657–662. 26. Nicole M-C, Hamel L-P, Morency M-J, Beaudoin N, Ellis BE, Seguin A:
MAP-ping genomic organization and organ-specific expression profiles of poplar MAP kinases and MAP kinase kinases.BMC Genomics2006,
7:223.
27. Lu S, Zhou Y, Li L, Chiang VL:Distinct roles of cinnamate 4-hydroxylase genes inPopulus.Plant and Cell Physiology2006,47(7):905–914. 28. Vandesompele J, De Preter K, Pattyn F, Poppe B, Van Roy N, De Paepe A,
Speleman F:Accurate normalization of real-time quantitative RT-PCR data by geometric averaging of multiple internal control genes.Genome Biol2002,3(7):research0034.1-0034.11.
29. Chen L, Zhong H-, Kuang J-, Li J-, Lu W-, Chen J-:Validation of reference genes for RT-qPCR studies of gene expression in banana fruit under different experimental conditions.Planta2011,234(2):377–390. 30. Fernandez P, Di Rienzo JA, Moschen S, Dosio GAA, Aguirrezábal LAN,
Hopp HE, Paniego N, Heinz RA:Comparison of predictive methods and biological validation for qPCR reference genes in sunflower leaf senescence transcript analysis.Plant Cell Reports2011,30(1):63–74. 31. Vashisth T, Johnson LK, Malladi A:An efficient RNA isolation procedure
and identification of reference genes for normalization of gene expression in blueberry.Plant Cell Reports2011,30(12):2167–2176. 32. Andersen C, Jensen J, Orntoft T:Normalization of real-time quantitative
33. Barsalobres-Cavallari CF, Severino FE, Maluf MP, Maia IG:Identification of suitable internal control genes for expression studies inCoffea arabica under different experimental conditions.BMC MolBiol2009,10:1. 34. Mallona I, Lischewski S, Weiss J, Hause B, Egea-Cortines M:Validation of
reference genes for quantitative real-time PCR during leaf and flower development inPetunia hybrida.BMC Plant Biology2010,10:4. 35. Tong Z, Gao Z, Wang F, Zhou J, Zhang Z:Selection of reliable reference
genes for gene expression studies in peach using real-time PCR.BMC MolBiol2009,10:71.
36. Lin YL, Lai ZX:Reference gene selection for qPCR analysis during somatic embryogenesis in longan tree.Plant Science2010,178:359–365. 37. Boyle B, Dallaire N, MacKay J:Evaluation of the impact of single
nucleotide polymorphisms and primer mismatches on quantitative PCR.
BMC Biotechnol2009,9(1):75.
38. Exposito-Rodriguez M, Borges AA, Borges-Perez A, Perez JA:Selection of internal control genes for quantitative real-time RT-PCR studies during tomato development process.BMC Plant Biology2008,8:131. 39. Huis R, Hawkins S, Neutelings G:Selection of reference genes for
quantitative gene expression normalization in flax (Linum usitatissimum L.).
BMC Plant Biology2010,10:71.
doi:10.1186/1756-0500-5-366
Cite this article as:Pettengillet al.:Evaluation of qPCR reference genes in two genotypes ofPopulusfor use in photoperiod
and low-temperature studies.BMC Research Notes20125:366.
Submit your next manuscript to BioMed Central and take full advantage of:
• Convenient online submission
• Thorough peer review
• No space constraints or color figure charges
• Immediate publication on acceptance
• Inclusion in PubMed, CAS, Scopus and Google Scholar
• Research which is freely available for redistribution