Open Access
Vol 8 No 3Research article
The effect of the stromal component of breast tumours on
prediction of clinical outcome using gene expression microarray
analysis
Susan J Cleator
1,2, Trevor J Powles
3, Tim Dexter
1, Laura Fulford
1, Alan Mackay
1, Ian E Smith
4,
Haukur Valgeirsson
1, Alan Ashworth
1and Mitch Dowsett
1,51Breakthrough Breast Cancer Research Centre, The Institute of Cancer Research, Fulham Road, SW3 6JB, London, UK 2Current address: Department of Oncology, St. Mary's Hospital, Praed Street, London W2 1NY, UK
3Parkside Hospital, Parkside, SW19 5NX, London, UK
4Breast Unit, Royal Marsden Hospital, Fulham Road, London, SW3 6JJ, UK
5Department of Academic Biochemistry, Royal Marsden Hospital, Fulham Road, SW3 6JJ, London, UK
Corresponding author: Susan J Cleator, [email protected]
Received: 2 Oct 2005 Revisions requested: 10 Nov 2005 Revisions received: 6 Apr 2006 Accepted: 26 May 2006 Published: 21 Jun 2006
Breast Cancer Research 2006, 8:R32 (doi:10.1186/bcr1506)
This article is online at: http://breast-cancer-research.com/content/8/3/R32 © 2006 Cleator et al.; licensee BioMed Central Ltd.
This is an open access article distributed under the terms of the Creative Commons Attribution License (http://creativecommons.org/licenses/by/2.0), which permits unrestricted use, distribution, and reproduction in any medium, provided the original work is properly cited.
Abstract
Introduction The aim of this study was to examine the effect of the cellular composition of biopsies on the error rates of multigene predictors of response of breast tumours to neoadjuvant adriamycin and cyclophosphamide (AC) chemotherapy.
Materials and methods Core biopsies were taken from primary breast tumours of 43 patients prior to AC, and subsequent clinical response was recorded. Post-chemotherapy (day 21) samples were available for 16 of these samples. Frozen sections of each core were used to estimate the proportion of invasive cancer and other tissue components at three levels. Transcriptional profiling was performed using a cDNA array containing 4,600 elements.
Results Twenty-three (53%) patients demonstrated a 'good' and 20 (47%) a 'poor' clinical response. The percentage invasive tumour in core biopsies collected from these patients varied markedly. Despite this, agglomerative clustering of
sample expression profiles showed that almost all biopsies from the same tumour aggregated as nearest neighbours. SAM (significance analysis of microarrays) regression analysis identified 144 genes which distinguished high- and low-percentage invasive tumour biopsies at a false discovery rate of not more than 5%. The misclassification error of prediction of clinical response using microarray data from pre-treatment biopsies (on leave-one-out cross-validation) was 28%. When prediction was performed on subsets of samples which were more homogeneous in their proportions of malignant and stromal cells, the misclassification error was considerably lower (8%–13%, p < 0.05 on permutation).
Conclusion The non-tumour content of breast cancer samples has a significant effect on gene expression profiles. Consideration of this factor improves accuracy of response prediction by expression array profiling. Future gene expression array prediction studies should be planned taking this into account.
Introduction
Breast tumours are routinely subclassified according to micro-scopic morphology, immunohistochemical staining, and stage. On the basis of this clinical information and patient age, an estimate of prognosis may be derived [1,2]. Most clinicians
make recommendations regarding the need for adjuvant chemotherapy on the basis of this estimate.
However, breast cancer is a heterogeneous disease, and dif-ferences in prognosis and response in distinct molecular sub-groups need to be taken into account. Improvement in the accuracy of prediction of prognosis without systemic treat-ment or with endocrine treattreat-ment alone would allow avoidance
of non-beneficial chemotherapy in a significant proportion of women [3]. Additionally, experience with neoadjuvant chemo-therapy has demonstrated resistance in a significant propor-tion of primary breast tumours [4]. These patients derive no downstaging benefits from neoadjuvant chemotherapy. Fur-thermore, chemosensitivity in the neoadjuvant setting is asso-ciated with superior long-term survival (relative to chemoresistance) [5] and therefore may represent a marker of survival benefit from chemotherapy. Identification of a chem-oresistant profile would allow further tailoring of treatment by enabling selection of tumours unlikely to respond and there-fore unlikely to derive a survival benefit.
Several studies have demonstrated that gene expression microarray profiling may be useful in improving prediction of prognosis [6-9] and treatment response [10-16]. These stud-ies employed non-dissected surgical [7-9], core-cut biopsy [12], or FNA (fine needle aspiration) samples [10]. However, breast tumours are non-homogenous in nature. They include inflammatory and vascular elements but most significantly (by proportion) connective tissue components [17]. The propor-tions of these components vary according to tumour type and sample type and also across a single tumour [17]. In studies involving surgical samples, those used for profiling can be selected as those with the highest proportional malignant cell content. In studies involving biopsies, this is not possible and the researcher is required to set an arbitrary minimum percent-age tumour limit.
The impact on expression profile of variation in the proportion of tumour cells and the nature of the non-tumour components have been largely unexplored. In this paper, we examine the effect of percentage tumour content on expression profile within a study designed to derive an expression profile predic-tive of response to adriamycin and cyclophosphamide (AC) neoadjuvant chemotherapy. We also consider methods for improvement of molecular profile-based prediction of response to primary chemotherapy by classification of sam-ples according to cellular makeup or by the incorporation of sample tumour content information into the predictor.
Materials and methods
Patients and samplesPatients were recruited and treated at the Royal Marsden Hos-pital (RMH), London, UK. Eligible patients were those under-going neoadjuvant AC chemotherapy treatment at doses of 60 and 600 mg/m2, respectively, three times a week, for a
clini-cally measurable breast tumour. The study was approved by the RMH Clinical Research and Ethics Committees (study number. 1,947), and written consent was obtained in all cases. Patients had been allocated neoadjuvant treatment for one of several standard indications, including locally advanced or inflammatory breast cancer, high tumour-to-breast size ratio, and tumours located close to the nipple.
Diagnosis was confirmed histologically by core-cut biopsy. All patients on hormone replacement therapy at diagnosis were advised to discontinue this treatment. Patients who demon-strated at least a partial clinical response received six cycles of treatment prior to local treatment. Patients in whom there was no or only marginal response after three or four cycles proceeded directly to local treatment or were commenced on alternative systemic treatment (docetaxel).
Clinical size of tumour (largest diameter and a diameter per-pendicular to this) was recorded prior to commencement and at completion of treatment. Clinical response was categorised as follows: no palpable abnormality after treatment, complete clinical response (cCR); more than 50% reduction in the prod-uct of the bidimensional measurements, partial response (PR); less than 50% reduction in the product of bidimensional meas-urements was recorded as no change (NC); and residual ill-defined thickening after a good response, minimal residual dis-ease (MRD). Those cases in which there was no residual inva-sive carcinoma at surgery were classified as a complete pathological response (pCR). Good responders were defined as pCR, cCR, or MRD; poor responders were defined as PR or NC. These categories were chosen on the basis of our pre-vious study, which showed that patients with 'good' response had superior overall survival relative to those with 'poor' response [18]. A proportion of patients undergoing a com-plete clinical and radiological (on ultrasound) response received radiation only as local treatment. Therefore, some of the cCRs may represent undocumented pCRs.
Research 14-gauge core biopsies were collected prior to commencing treatment and snap-frozen in liquid nitrogen. When consented to, a repeat sample was taken at 21 days after the first cycle of chemotherapy. All samples were there-after coded using a study number as an identifier. Frozen cores were embedded in OCT (optimum cutting temperature embedding compound) and sectioned at -20°C in a cryostat. Sections (5 µm in thickness) were taken for haematoxylin and eosin staining to assess histological character superficially from the core as soon as 'full-face' was reached. The percent-age of cells comprising invasive malignant disease and non-malignant components (that is, in situ disease, inflammatory infiltrate, non-malignant ductal/lobular structures, and fibrob-lastic involvement) were recorded by consensus between two breast pathologists. For patients in whom multiple biopsies were available, the biopsy with the highest invasive content was used for microarray analysis. Biopsies with less than 20% invasive cancer content were excluded from the study.
RNA extraction and amplification
of a carrier according to the manufacturers' instructions. Sam-ples not giving distinct 18S and 28S peaks on an Agilent Bio-analyzer (Agilent Technologies, Palo Alto, CA, USA) trace were excluded from the study. Multiple cores from the same patient were handled separately for RNA extraction. A single round of T7 linear RNA amplification was carried out using the RiboAmp kit (Arcturus, Sunnyvale, CA, USA) with a starting amount of 1 µg when available or 50% of the available RNA.
Reference RNA was generated from a pool of RNAs extracted from 20 independent breast cancer surgical samples.
cDNA array hybridisation
[image:3.612.62.549.112.545.2]Microarray analyses used in-house (Breakthrough Breast Can-cer Research Centre, London, UK) human arrays spotted with DNA derived from 4,600 IMAGE cDNA clones in duplicate. This set of genes represents a subset of the 5,808 Cancer Research UK (London, UK) gene set that was designed to include a high proportion of genes documented as being involved in carcinogenesis or tumour biology. To improve 'cov-erage' of genes involved in breast cancer, a list of discrimina-tory genes cited in important microarray studies on clinical breast cancer samples at time of production was compiled [7,20-22], and the array was supplemented with these. One
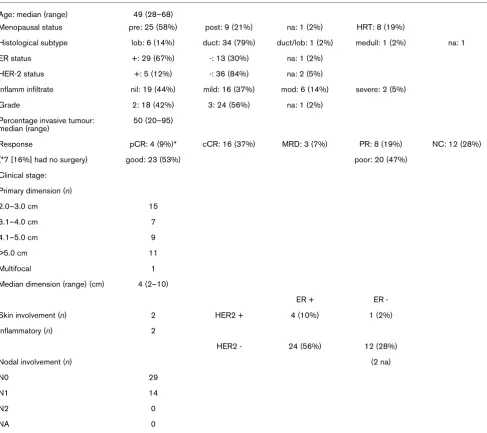
Table 1
Patient, tumour, and pre-treatment biopsy characteristics (43 samples used in prediction analysis)
Age: median (range) 49 (28–68)
Menopausal status pre: 25 (58%) post: 9 (21%) na: 1 (2%) HRT: 8 (19%)
Histological subtype lob: 6 (14%) duct: 34 (79%) duct/lob: 1 (2%) medull: 1 (2%) na: 1
ER status +: 29 (67%) -: 13 (30%) na: 1 (2%)
HER-2 status +: 5 (12%) -: 36 (84%) na: 2 (5%)
Inflamm infiltrate nil: 19 (44%) mild: 16 (37%) mod: 6 (14%) severe: 2 (5%)
Grade 2: 18 (42%) 3: 24 (56%) na: 1 (2%)
Percentage invasive tumour: median (range)
50 (20–95)
Response pCR: 4 (9%)* cCR: 16 (37%) MRD: 3 (7%) PR: 8 (19%) NC: 12 (28%)
(*7 [16%] had no surgery) good: 23 (53%) poor: 20 (47%)
Clinical stage:
Primary dimension (n)
2.0–3.0 cm 15
3.1–4.0 cm 7
4.1–5.0 cm 9
>5.0 cm 11
Multifocal 1
Median dimension (range) (cm) 4 (2–10)
ER + ER
-Skin involvement (n) 2 HER2 + 4 (10%) 1 (2%)
Inflammatory (n) 2
HER2 - 24 (56%) 12 (28%)
Nodal involvement (n) (2 na)
N0 29
N1 14
N2 0
NA 0
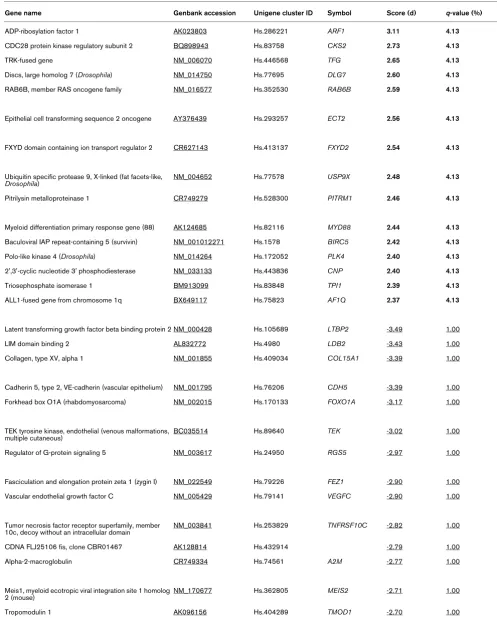
Table 2
SAM (significance analysis of microarrays) analysis of genes correlated to percentage tumour content.
Gene name Genbank accession Unigene cluster ID Symbol Score (d) q-value (%)
ADP-ribosylation factor 1 AK023803 Hs.286221 ARF1 3.11 4.13
CDC28 protein kinase regulatory subunit 2 BQ898943 Hs.83758 CKS2 2.73 4.13
TRK-fused gene NM_006070 Hs.446568 TFG 2.65 4.13
Discs, large homolog 7 (Drosophila) NM_014750 Hs.77695 DLG7 2.60 4.13
RAB6B, member RAS oncogene family NM_016577 Hs.352530 RAB6B 2.59 4.13
Epithelial cell transforming sequence 2 oncogene AY376439 Hs.293257 ECT2 2.56 4.13
FXYD domain containing ion transport regulator 2 CR627143 Hs.413137 FXYD2 2.54 4.13
Ubiquitin specific protease 9, X-linked (fat facets-like,
Drosophila) NM_004652 Hs.77578 USP9X
2.48 4.13
Pitrilysin metalloproteinase 1 CR749279 Hs.528300 PITRM1 2.46 4.13
Myeloid differentiation primary response gene (88) AK124685 Hs.82116 MYD88 2.44 4.13
Baculoviral IAP repeat-containing 5 (survivin) NM_001012271 Hs.1578 BIRC5 2.42 4.13
Polo-like kinase 4 (Drosophila) NM_014264 Hs.172052 PLK4 2.40 4.13
2',3'-cyclic nucleotide 3' phosphodiesterase NM_033133 Hs.443836 CNP 2.40 4.13
Triosephosphate isomerase 1 BM913099 Hs.83848 TPI1 2.39 4.13
ALL1-fused gene from chromosome 1q BX649117 Hs.75823 AF1Q 2.37 4.13
Latent transforming growth factor beta binding protein 2 NM_000428 Hs.105689 LTBP2 -3.49 1.00
LIM domain binding 2 AL832772 Hs.4980 LDB2 -3.43 1.00
Collagen, type XV, alpha 1 NM_001855 Hs.409034 COL15A1 -3.39 1.00
Cadherin 5, type 2, VE-cadherin (vascular epithelium) NM_001795 Hs.76206 CDH5 -3.39 1.00
Forkhead box O1A (rhabdomyosarcoma) NM_002015 Hs.170133 FOXO1A -3.17 1.00
TEK tyrosine kinase, endothelial (venous malformations, multiple cutaneous)
BC035514 Hs.89640 TEK -3.02 1.00
Regulator of G-protein signaling 5 NM_003617 Hs.24950 RGS5 -2.97 1.00
Fasciculation and elongation protein zeta 1 (zygin I) NM_022549 Hs.79226 FEZ1 -2.90 1.00
Vascular endothelial growth factor C NM_005429 Hs.79141 VEGFC -2.90 1.00
Tumor necrosis factor receptor superfamily, member 10c, decoy without an intracellular domain
NM_003841 Hs.253829 TNFRSF10C -2.82 1.00
CDNA FLJ25106 fis, clone CBR01467 AK128814 Hs.432914 -2.79 1.00
Alpha-2-macroglobulin CR749334 Hs.74561 A2M -2.77 1.00
Meis1, myeloid ecotropic viral integration site 1 homolog
2 (mouse) NM_170677 Hs.362805 MEIS2 -2.71 1.00
half to two micrograms of sample RNA and a matched amount of reference RNA was labeled using the Powerscript Labeling kit (Clontech, Mountain View, CA, USA) in combination with Amersham Cy dyes (GE Healthcare, Little Chalfont, Bucking-hamshire, UK). A single dye swap experiment was performed for each clinical sample. Slides were scanned using a GenePix 4000B (Axon Instruments Inc., Union City, CA, USA) scanner and GenePix version 4.0 software.
Data analysis
Most of the data analyses were carried out with the S-plus sta-tistical software package (Insightful, Seattle, USA) and pur-pose-written scripts (T Dexter, Breakthrough, UK). Raw expression values were transformed to Log2 ratios (sample/ reference). The loess function [23] was used to remove biases due to the spot position and spot intensity. Flagged spots were treated as missing values. Log ratio values from duplicate spots and hybridisations were averaged. Genes with consist-ently low intensity and those that exhibited little variation across samples were removed from the analysis. After the above pre-processing, 1,286 genes remained for the predic-tion analysis. Samples were clustered both by complete link-age and flexible beta (beta = -0.5) agglomerative algorithms with (1 - correlation) as a distance measure [24,25]. The cor-relations were estimated using Spearman's rank method.
The nearest neighbour class prediction algorithm (euclidean distance) was used for all classifications because of its sim-plicity and good performance on microarray data as reported by Dudoit and Fridlyand [26]. We elected to use seven nearest neighbours throughout to give more stable error estimates and greater robustness than would result with smaller neighbour-hoods. The weighted Kolmogorov-Smirnov statistic was used to rank genes for discriminatory information [27]. Each predic-tor was built starting with the highest ranked two genes from the training set, and then genes were added to the predictor in decreasing rank order until the error rates no longer decreased.
Owing to the limited number of samples, the misclassification error was estimated by leave-one-out cross-validation (LOOCV). In this approach, the class (that is, response) of each sample was predicted in turn, using the other samples as the training set. To avoid selection bias, the genes that were used as predictors were re-selected for each of these leave-one-out classifications [28]. To estimate the probability of the misclassification error arising by chance, a permutation p value was determined as suggested by Radmacher and colleagues
[28]. In this procedure, the LOOCV estimate was determined 1,000 times for permuted class labels; the fraction of these that gave an equal or lower error estimate than that with true labels is taken as the p value. We refer to the latter as a 'label permutation'.
To assess the significance of lower misclassification error esti-mates for selected subsets of the samples, we needed to con-trol for the smaller sample sizes. To this end, we defined a 'subset permutation' p value as the fraction of random subsets (1,000 matched for size and class proportions) of the full set of samples that gave rise to LOOCV error estimates equal to or lower than the selected subset. The correct class labels were used for subset permutation. The minimum error for each permutation across the top 2 to 10 ranked genes was used to calculate the p values for both of the above types of permuta-tion to avoid bias. Although this is an arbitrary range, the mini-mum error rates in all the permutations had increased by a cutoff of 10. Significance analysis of microarrays (SAM) anal-yses were performed using standard software [29]. Pre-treat-ment samples only were used for prediction analyses.
Results
Patient and tumour characteristics
RNA of adequate amount and quality was available from 43 tumours before treatment. Of these, 23 (53%) demonstrated a 'good' and 20 (47%) a 'poor' clinical response. For 16 of these tumours, a paired 21-day sample was also available. These 'on treatment' biopsies are included in the analysis of reproducibility shown below to increase the number of paired samples but are excluded from the analysis of response pre-diction. The good responses comprised 16 (37%) that under-went a cCR, three (7%) that exhibited ill-defined thickening (MRD) at the end of treatment, and four (9%) that underwent a pCR (all cCR or MRD). The patient and tumour characteris-tics are shown in Table 1. The only feature differing between good and poor responders was tumour size, with pre-treat-ment size greater in poor compared with good responders (Mann-Whitney, p = 0.03). Pre-treatment size did not relate to expression profile (data not shown).
Biopsy characteristics
A total of 147 cores were sectioned in the course of this study, including 104 that were sectioned at three levels (levels approximately 50 µm apart). Of these 104 cores, only 16 cores showed more than 10% absolute variation in invasive tumour content across all three sections and only one core showed more than 20% variation. Only four cores were found
Isoleucine-tRNA synthetase NM_013417 Hs.172801 IARS -2.63 1.00
Positive values for score (bold) indicate positive correlation with percentage tumour, and negative values indicate inverse correlation with percentage tumour (underlined). The table has been truncated to show only genes with the lowest false discovery rates (q).
Table 2 (Continued)
to have tumour at some levels and none at others; all four con-tained not more than 15% invasive tumour at the lowest level and were therefore excluded from the study. This suggests that the histological composition did not vary widely over the width of the core. The histological result from the lowest sec-tion for a given biopsy was taken as that most representative of the remaining biopsy used for profiling and hence the level on which percentage invasive tumour was assessed. The dis-tribution of percentage invasive content of core (in cases of multiple cores, that core used for prediction analysis) did not relate to response as assessed by Wilcoxon rank sum test (p
= 0.3) or t test (p = 0.27).
Percentage invasive content in core biopsies included in the prediction study varied from 20% to 95% (median 50%). For most core biopsies, the majority of the non-malignant tissue consisted of connective tissue. Inflammatory infiltrate was also scored on the lowest section as nil, mild, moderate, or severe. Of all 147 core biopsies, only six (4%) were scored as having a 'severe' inflammatory infiltrate at one or more levels.
Basic validation of array data
[image:6.612.58.554.119.202.2]To assess consistency of the expression profile between repeated biopsies, the 43 pre-treatment and 16 paired treatment samples were clustered (Additional file 1). The post-treatment samples were included in this validation study only to enhance numbers and were not used in subsequent predic-tive analyses. All but one pair (b223A and B) of duplicate biop-sies taken at the same time point relative to treatment (in total, five pre-treatment and five post-treatment pairs) clustered as nearest neighbours despite some variation in percentage tumour between the pairs (Additional file 3). Of 16 pre/post-treatment pairs, 14 clustered with samples from the same tumour (Additional file 1). To validate our class prediction methodology, a supervised analysis was undertaken to obtain a gene list for prediction of oestrogen receptor (ER) status in pre-treatment samples (ER-α was excluded from the analysis). ER status was correctly assigned in 40 of 42 cases on LOOCV. Discriminatory genes are listed in the supplementary information (Additional file 4).
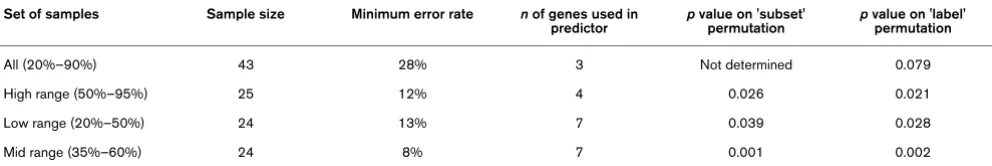
Table 3
Misclassification error estimates (leave-one-out cross-validation) for response prediction.
Set of samples Sample size Minimum error rate n of genes used in predictor
p value on 'subset' permutation
p value on 'label' permutation
All (20%–90%) 43 28% 3 Not determined 0.079
High range (50%–95%) 25 12% 4 0.026 0.021
Low range (20%–50%) 24 13% 7 0.039 0.028
Mid range (35%–60%) 24 8% 7 0.001 0.002
[image:6.612.314.556.231.428.2]Column 1 shows the division of samples into three groups according to percentage invasive tumour content. Details of minimum error predictors for all samples and subsets. Permutation p values were calculated as described in Materials and methods.
Figure 1
Leave-one-out cross-validation (LOOCV) error rates for response prediction
Leave-one-out cross-validation (LOOCV) error rates for response pre-diction. Variation in the LOOCV error estimate with the number of genes used in the predictor. Misclassification rates are plotted for the whole data set (n = 43) and subsets according to percentage tumour content.
Figure 2
Variation in error rate according to scale of 'histology gene'
Effect of percentage tumour on expression profile
Before performing prediction analysis, an exploratory analysis
[image:7.612.58.549.115.655.2]was undertaken to assess the impact of variation in the histo-logical content of biopsies on the expression profile. A SAM
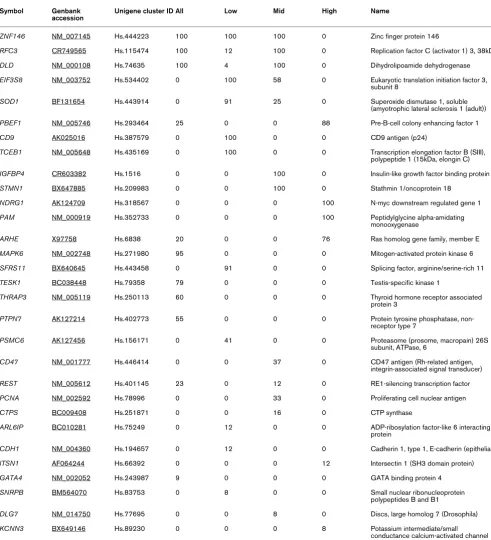
Table 4
Response prediction gene lists.
Symbol Genbank accession
Unigene cluster ID All Low Mid High Name
ZNF146 NM_007145 Hs.444223 100 100 100 0 Zinc finger protein 146
RFC3 CR749565 Hs.115474 100 12 100 0 Replication factor C (activator 1) 3, 38kDa
DLD NM_000108 Hs.74635 100 4 100 0 Dihydrolipoamide dehydrogenase
EIF3S8 NM_003752 Hs.534402 0 100 58 0 Eukaryotic translation initiation factor 3, subunit 8
SOD1 BF131654 Hs.443914 0 91 25 0 Superoxide dismutase 1, soluble
(amyotrophic lateral sclerosis 1 (adult))
PBEF1 NM_005746 Hs.293464 25 0 0 88 Pre-B-cell colony enhancing factor 1
CD9 AK025016 Hs.387579 0 100 0 0 CD9 antigen (p24)
TCEB1 NM_005648 Hs.435169 0 100 0 0 Transcription elongation factor B (SIII), polypeptide 1 (15kDa, elongin C)
IGFBP4 CR603382 Hs.1516 0 0 100 0 Insulin-like growth factor binding protein 4
STMN1 BX647885 Hs.209983 0 0 100 0 Stathmin 1/oncoprotein 18
NDRG1 AK124709 Hs.318567 0 0 0 100 N-myc downstream regulated gene 1
PAM NM_000919 Hs.352733 0 0 0 100 Peptidylglycine alpha-amidating
monooxygenase
ARHE X97758 Hs.6838 20 0 0 76 Ras homolog gene family, member E
MAPK6 NM_002748 Hs.271980 95 0 0 0 Mitogen-activated protein kinase 6
SFRS11 BX640645 Hs.443458 0 91 0 0 Splicing factor, arginine/serine-rich 11
TESK1 BC038448 Hs.79358 79 0 0 0 Testis-specific kinase 1
THRAP3 NM_005119 Hs.250113 60 0 0 0 Thyroid hormone receptor associated protein 3
PTPN7 AK127214 Hs.402773 55 0 0 0 Protein tyrosine phosphatase, non-receptor type 7
PSMC6 AK127456 Hs.156171 0 41 0 0 Proteasome (prosome, macropain) 26S
subunit, ATPase, 6
CD47 NM_001777 Hs.446414 0 0 37 0 CD47 antigen (Rh-related antigen,
integrin-associated signal transducer)
REST NM_005612 Hs.401145 23 0 12 0 RE1-silencing transcription factor
PCNA NM_002592 Hs.78996 0 0 33 0 Proliferating cell nuclear antigen
CTPS BC009408 Hs.251871 0 0 16 0 CTP synthase
ARL6IP BC010281 Hs.75249 0 12 0 0 ADP-ribosylation factor-like 6 interacting protein
CDH1 NM_004360 Hs.194657 0 12 0 0 Cadherin 1, type 1, E-cadherin (epithelial)
ITSN1 AF064244 Hs.66392 0 0 0 12 Intersectin 1 (SH3 domain protein)
GATA4 NM_002052 Hs.243987 9 0 0 0 GATA binding protein 4
SNRPB BM564070 Hs.83753 0 8 0 0 Small nuclear ribonucleoprotein
polypeptides B and B1
DLG7 NM_014750 Hs.77695 0 0 8 0 Discs, large homolog 7 (Drosophila)
KCNN3 BX649146 Hs.89230 0 0 0 8 Potassium intermediate/small
conductance calcium-activated channel
regression analysis was performed to establish whether it was possible to identify genes that correlated with the proportion of tumour cells in the 43 pre-treatment core biopsies. One hundred forty-four genes were significant at a false discovery rate of not more than 5%. Table 2 shows the most correlated genes from this analysis. Positive values for 'score' (bold) indi-cate positive correlation with high percentage tumours, and negative values (underlined) indicate negative correlation with proportion of tumour cells in the samples. More genes corre-lated positively with the stromal content (n = 128) than with the tumour content (n = 16), possibly reflecting the greater molecular heterogeneity of tumour types across the samples than that of their associated stromas. This is also reflected in the higher false discovery rates for 'tumour-associated genes'.
Response prediction using pre-treatment biopsies
Prediction analysis was initially undertaken on the full set of 43 biopsies. The optimum misclassification error estimate (LOOCV) for the whole sample set was 28% using a three-gene predictor (Figure 1). To explore the effect of biopsy tumour content (and its associated influence on the expres-sion profile) on error of response prediction, we selected three overlapping subsets of tumour samples which were more homogeneous in terms of percentage tumour content: (a) ≥ 50% (50%–95%) invasive tumour (25 samples), (b) ≤ 50% (20%–50%) invasive tumour (24 samples), and (c) 35%– 60% invasive tumour (24 samples).
The subset consisting of 35%–60% represented a group cen-tered around the median sample in terms of percentage tumour content and of a size similar to or the same as the other two groups.
The minimum error of classification for each of the subsets (8%–13%) was lower than that for the superset of all samples (28%) (Figure 1), suggesting that homogeneity of tumour con-tent rather than tumour concon-tent per se might be an important factor for response prediction. However, the comparison of the subset error estimates with that for all samples is not con-trolled for the different sample sizes involved. To address this, we determined a 'subset permutation' p value for each of the subsets (see Materials and methods). We also estimated the probability that the subset errors arose by chance (a 'label per-mutation' as discussed in Materials and methods). Error esti-mates and corresponding p values for the 'subset permutation' and the 'label permutation' support the hypothesis that homo-geneity of biopsy tumour content improves response predic-tion with the nearest neighbour algorithm (Table 3). The identity of the genes used in the prediction for each of these subgroups is presented in Table 4. The mean differential expression between good and poor responders for these genes is given in the supplementary information (Additional file 5).
We found, in common with other studies [20,22,30-32], that ER-positive and ER-negative tumours were very distinct in molecular terms (Additional file 4), which may confound response prediction. Therefore, response prediction was per-formed on ER-positive samples alone (16 good, 13 poor responders). Error rates, however, were high (31% with 8 genes, 31% with 25 genes). Within this subset, the effect of heterogeneity of tumour content on prediction appeared to be more pronounced (error rates: 31% (all samples, n = 29) ver-sus 4.5% (≤ 60% tumour, n = 22)).
Incorporation of histological information into the predictor
To explore further the effect of biopsy composition on predic-tion error, we attempted to create a single predictor for all samples by adding information about tumour content to the predictor as an extra dimension or 'histology gene'. The impact of variation in biopsy tumour content on prediction error was thought to be due partly to the fact that genes that discriminate between good and poor responders in high-tumour-content biopsies are often poor discriminators in low-tumour-content biopsies (and vice versa) as is evident from Table 4. To over-come this complication, 10 genes were selected that showed 100% support in the subset permutations (Table 4). By adding the proportion of tumour content to these 10 genes as an 11th dimension, we aimed to move the samples apart in 'prediction space' such that differences in tumour content also contrib-uted to the distances between samples. Thus, samples with similar expression profiles become nearest neighbours of sim-ilar proportion of tumour content as well. In the nearest neigh-bour predictor, like is matched with like in terms of proportion of tumour content as well as expression profile.
It was necessary to rescale the histology gene's contribution to the distance between samples because the standard devi-ation of most genes lay between 0.5 and 1.5 (log2 ratio scale). Therefore, the percentage tumour figures were standardised by subtracting the average and dividing by the standard devi-ation. The 'histology gene' or 11th dimension was then rescaled from 0 to 4 standard deviations, and the effect on cross-validation error determined (Figure 2). After an initial drop in error, as the scale approached 1.0, the error rose beyond the initial error as the influence of the histology gene became too dominant. To test whether the effect of the histol-ogy gene was specific to the particular set of 10 genes used above, we tested the effect of adding the histology gene to 1,000 predictors, each containing a random permutation of between 8 and 16 genes drawn from the top 20 genes ranked by a combined score (Additional file 6 a-c). In 91% of these, the addition of the histology gene resulted in a lower error; in 49%, the error drop was greater than 10%.
Discussion
neoadjuvant chemotherapy. Such a profile might be useful in understanding the molecular mechanisms determining response or resistance and would provide the basis for a pre-dictor of chemotherapy response.
However, the biopsy material used in this study had a complex cellular composition. In planning this study, consideration had been given to two approaches for ensuring that the percent-age invasive tumour within biopsies was 'sufficient' and homo-geneous. Cell selection, either by gross dissection or laser capture microdissection [33], allows enrichment of the inva-sive tumour component. We chose, in common with others [6,7,11,13,14,31], to set a minimum threshold for 'percentage malignant cells' within a given biopsy. The median percentage invasive tumour for the core biopsy samples was 50%, and the range of figures that were included in the study was 20% to 95%. In many biopsies, the dominant non-tumour component, connective tissue, was admixed with epithelial components, making enrichment of the malignant compartment difficult using gross dissection alone.
We hypothesised that this 'contamination' of biopsies by sig-nificant and variable amounts of non-tumour components might confound tumour classification. Indeed, at least 10% of the genes (144 genes) remaining after preprocessing of the data were found to correlate with cellular composition using a SAM regression analysis. Genes relatively overexpressed in low-percentage tumours included established stromal-related genes (Table 2) (for example, Collagen (type XV, alpha-1) and Cadherin 5 (type 2, VE-cadherin)). The exact source (histolog-ical compartment) of production of a given RNA could be fur-ther confirmed by FISH (fluorescent in situ hybridisation) or by comparing gene expression in microdissected stromal and tumour compartments.
However, paired biopsies, despite differences in proportional non-tumour content (Additional file 3), co-aggregated on clus-ter analysis (Additional file 1), suggesting a dominant 'tumour profile' despite variation in the proportion of stroma. Further-more, prediction of ER status was not confounded by marked variation in percentage tumour content. This is in keeping with a number of studies that have shown that strong differential expression of a relatively high proportion of genes correlates with ER status [6,7,20,30-32] which would be expected to result in domination of the expression profile despite variation in the contribution by the non-tumour component. Further-more, it has not been demonstrated that the ER expression signature is derived entirely from tumour cells. However, varia-tion in the proporvaria-tion of stroma may be sufficient to mask more subtle aspects of the tumour expression signature.
We found that the error rate for response prediction for the whole sample set was poor (28%) but was improved by increasing the homogeneity of cellular composition by subset-ting on the basis of histological composition (error rate, 8%–
13%) (Table 3). The misclassification rates for the subsets were determined with LOOCV and therefore represent high variance estimates, and the sample numbers are modest. We have used permutation analysis as support for the error esti-mates; ultimately, however, validation with an independent data set would address these issues.
We did not find any evidence to suggest that highly stromal biopsies result in higher prediction error. However, stromal-tumour content appears to affect the selection of genes that are used in the predictor for each histological subset, resulting in different but overlapping lists of predictive genes (Table 4). Some genes discriminated response in the 'high percentage' and not the 'low percentage' samples (for example, PBEF1). This may simply be a dose effect whereby discriminatory tumour-associated genes are no longer differential in 'low per-centage samples' due to low signal. Alternatively, discrimina-tory genes that are expressed in both tumour and non-tumour compartments may lose discriminatory potential in tumours with a significant stromal contribution to the molecular signa-ture. Genes that are discriminatory in low but not high 'per-centage samples' (for example, SOD1) could be expressed only at the tumour-stroma interface in stromal and/or tumour cells. Certainly, breast tumour-induced changes in stromal expression have been previously documented [34]. Further-more, it has been shown that tumour gene upregulation can occur specifically at the tumour-stroma interface [35,36]. Finally, it is also likely that the volume and configuration of stro-mal tissue within a tumour are a reflection of the tumour molec-ular subtype.
Thus, this analysis resulted in three distinct response-predic-tion genes lists that partially overlapped. PBEF, reported in one study to act as an inhibitor of apoptosis in neutrophils [37], appeared in the predictor for response for 'high percent-age' tumours and has also been reported as a component of a three-gene predictor of AC sensitivity by another group [13]. In both studies, expression of this gene was higher in the resistant tumours than in sensitive tumours. SOD1 was found to be relatively overexpressed in resistant tumours ('low' and 'mid percentage') in keeping with a proposed role in the neu-tralisation of free radicals, one means by which anthracyclines are thought to inflict cellular damage [38]. NDRG1, upregu-lated in poor responders ('high percentage'), is induced by hypoxia and may reduce p53 expression [39]. Hypoxia may be a marker of poor vascularisation of tumours and therefore pos-sible limitation of drug access.
that operates regardless of biopsy composition. This would avoid the need for microdissection to enrich for malignant cells. Furthermore, if stromal or stromal-interface gene expres-sion does carry discriminatory information, then microdissec-tion would result in loss of predictive informamicrodissec-tion.
Several groups have attempted to define a multigene predictor of chemoresponsiveness [10-15], using either clinical or path-ological definitions of response. The reported error rates in these studies, as assessed on an independent data set or by LOOCV, range from 5% to 30%. Comparison of gene lists and error rates across these studies and with ours is ham-pered by the fact that the treatment regimens, response defi-nitions, and microarray platforms differ and that the histological composition of the samples in most studies was not presented.
A number of samples used in our study have also been profiled using an Affymetrix platform (Santa Clara, CA, USA) [40]. In this independent analysis, 12 samples from tumours display-ing either cCR or pCR and six samples from tumours with residual tumour greater than 70% were used to define a clas-sifier (samples with less than 40% tumour were excluded from the study). The error rate of prediction on LOOCV was 33% (p = 0.4 on permutation).
Therefore, to date, the reported error rates associated with expression array prediction of response, certainly for anthracy-cline combination chemotherapy, remain too high for clinical utility. This may be due in part to the fact that breast cancer is an extremely complex and heterogeneous disease that oper-ates multiple mechanisms of chemotherapeutic response and resistance which are not consistent across different subtypes, particularly in the case of combination regimens incorporating agents that act by multiple mechanisms. Such complexities mandate that study designs be optimised in terms of biopsy quality and sample size.
Conclusion
The response prediction using all pre-treatment biopsies was modestly effective. However, the percentage of invasive can-cer cells within a sample influenced the expression profile. Response prediction on subsets of samples more homogene-ous in terms of cellular composition was associated with lower error rates. We believe that it is essential that consideration be given to biopsy composition in planning future studies of this type using methods such as those discussed above. Larger studies are required to establish whether optimal accuracy of response prediction may be achieved by the development of profiles specific to immunohistochemical breast cancer subtypes.
Competing interests
The authors declare that they have no competing interests.
Authors' contributions
SC was involved in design of study, acquisition of data, analy-sis and interpretation of results, and drafting the manuscript and preparing the final version (Breakthrough Breast Cancer Research Centre). TP participated in data acquisition and the conception and design of the study (RMH). TD was involved in analysis and interpretation of results, and drafting the man-uscript and preparing the final version (Breakthrough Breast Cancer Research Centre). LF contributed to data acquisition (Breakthrough Breast Cancer Research Centre). AM per-formed data acquisition and analysis (Breakthrough Breast Cancer Research Centre). IS participated in data acquisition (RMH). HV performed data analysis (Breakthrough Breast Cancer Research Centre). AA participated in the design of study, interpretation of results, and preparing the final version of the manuscript (Breakthrough Breast Cancer Research Centre). MD was involved in the conception and design of the study, interpretation of results, and preparing the final version of the manuscript (RMH). All authors read and approved the final manuscript.
Additional files
The following Additional files are available online:
Additional file 1
A PDF file containing a dendrogram of flexible beta clustering with Spearman rank correlation on all core biopsy samples taken from 43 patients.
See http://www.biomedcentral.com/content/ supplementary/bcr1506-S1.pdf
Additional file 2
A word document containing the legend for additional data file 1.
See http://www.biomedcentral.com/content/ supplementary/bcr1506-S2.doc
Additional file 3
A word document containing a table that shows the characteristics of paired (repeat) core biopsy samples. See http://www.biomedcentral.com/content/
supplementary/bcr1506-S3.doc
Additional file 4
A word document containing a table that shows the oestrogen receptor (ER) predictive genes.
See http://www.biomedcentral.com/content/ supplementary/bcr1506-S4.doc
Additional file 5
A word document containing a table that shows response prediction gene lists with expression ratios. See http://www.biomedcentral.com/content/
Acknowledgements
We thank Kerry Fenwick, Peter Kerr, Sunil Lakhani, and Marjan Iravani (all of whom were funded by the Breakthrough Breast Cancer Research Centre) and Margaret Hill and Geraldine Walsh (who were funded by RMH). The study and the manuscript preparation were funded by the Breakthrough Breast Cancer Research Centre. Neither of the above funding bodies contributed to the study design or collection, analysis, and interpretation of results. Likewise, there was no involvement by any funding body in the writing of the manuscript or the decision to submit it.
References
1. Galea MH, Blamey RW, Elston CE, Ellis IO: The Nottingham Prognostic Index in primary breast cancer. Breast Cancer Res Treat 1992, 22:207-219.
2. Olivotto IA, Bajdik CD, Ravdin PM, Speers CH, Coldman AJ, Norris BD, Davis GJ, Chia SK, Gelmon KA: Population-based validation of the prognostic model ADJUVANT! for early breast cancer. J Clin Oncol 2005, 23:2716-2725.
3. Cleator S, Ashworth A: Molecular profiling of breast cancer: clinical implications. Br J Cancer 2004, 90:1120-1124. 4. Fisher B, Brown A, Mamounas E, Wieand S, Robidoux A,
Margo-lese RG, Cruz AB Jr, Fisher ER, Wickerham DL, Wolmark N, et al.: Effect of preoperative chemotherapy on local-regional dis-ease in women with operable breast cancer: findings from National Surgical Adjuvant Breast and Bowel Project B-18. J Clin Oncol 1997, 15:2483-2493.
5. Wolmark N, Wang J, Mamounas E, Bryant J, Fisher B: Preopera-tive chemotherapy in patients with operable breast cancer: nine-year results from National Surgical Adjuvant Breast and Bowel Project B-18. J Natl Cancer Inst Monogr 2001:96-102. 6. Sotiriou C, Neo SY, McShane LM, Korn EL, Long PM, Jazaeri A,
Martiat P, Fox SB, Harris AL, Liu ET: Breast cancer classification and prognosis based on gene expression profiles from a pop-ulation-based study. Proc Natl Acad Sci USA 2003, 100:10393-10398.
7. van't Veer LJ, Dai H, van de Vijver MJ, He YD, Hart AA, Mao M, Peterse HL, van der Kooy K, Marton MJ, Witteveen AT, et al.: Gene expression profiling predicts clinical outcome of breast cancer. Nature 2002, 415:530-536.
8. van de Vijver MJ, He YD, van't Veer LJ, Dai H, Hart AA, Voskuil DW, Schreiber GJ, Peterse JL, Roberts C, Marton MJ, et al.: A gene-expression signature as a predictor of survival in breast cancer. N Engl J Med 2002, 347:1999-2009.
9. Wang Y, Klijn JG, Zhang Y, Sieuwerts AM, Look MP, Yang F, Talantov D, Timmermans M, Meijer-van Gelder ME, Yu J, et al.: Gene-expression profiles to predict distant metastasis of lymph-node-negative primary breast cancer. Lancet 2005, 365:671-679.
10. Ayers M, Symmans WF, Stec J, Damokosh AI, Clark E, Hess K, Lecocke M, Metivier J, Booser D, Ibrahim N, et al.: Gene expres-sion profiles predict complete pathologic response to neoad-juvant paclitaxel and fluorouracil, doxorubicin, and
cyclophosphamide chemotherapy in breast cancer. J Clin Oncol 2004, 22:2284-2293.
11. Bertucci F, Finetti P, Rougemont J, Charafe-Jauffret E, Nasser V, Loriod B, Camerlo J, Tagett R, Tarpin C, Houvenaeghel G, et al.: Gene expression profiling for molecular characterization of inflammatory breast cancer and prediction of response to chemotherapy. Cancer Res 2004, 64:8558-8565.
12. Chang JC, Wooten EC, Tsimelzon A, Hilsenbeck SG, Gutierrez MC, Elledge R, Mohsin S, Osborne CK, Chamness GC, Allred DC, O' Connell P: Gene expression profiling for the prediction of therapeutic response to docetaxel in patients with breast cancer. Lancet 2003, 362:362-369.
13. Folgueira MA, Carraro DM, Brentani H, Patrao DF, Barbosa EM, Netto MM, Caldeira JR, Katayama ML, Soares FA, Oliveira CT, et al.: Gene expression profile associated with response to dox-orubicin-based therapy in breast cancer. Clin Cancer Res
2005, 11:7434-7443.
14. Hannemann J, Oosterkamp HM, Bosch CA, Velds A, Wessels LF, Loo C, Rutgers EJ, Rodenhuis S, van de Vijver MJ: Changes in gene expression associated with response to neoadjuvant chemotherapy in breast cancer. J Clin Oncol 2005, 23:3331-3342.
15. Iwao-Koizumi K, Matoba R, Ueno N, Kim SJ, Ando A, Miyoshi Y, Maeda E, Noguchi S, Kato K: Prediction of docetaxel response in human breast cancer by gene expression profiling. J Clin Oncol 2005, 23:422-431.
16. Modlich O, Prisack HB, Munnes M, Audretsch W, Bojar H: Predic-tors of primary breast cancers responsiveness to preoperative epirubicin/cyclophosphamide-based chemotherapy: transla-tion of microarray data into clinically useful predictive signatures. J Transl Med 2005, 3:32.
17. WHO: World Health Organization Classification of Tumours. Pathology and Genetics of Tumours of the Breast and Genital Organs Lyon: IARC Press; 2003.
18. Cleator S, Makris A, Ashley SE, Lal R, Powles TJ: Good clinical response of breast cancers to neoadjuvant chemoendocrine treatment is associated with improved overall survival. Ann Oncol 2005, 16:267-272.
19. Ellis M, Davis N, Coop A, Liu M, Schumaker L, Lee RY, Srikan-chana R, Russell CG, Singh B, Miller WR, et al.: Development and validation of a method for using breast core needle biop-sies for gene expression microarray analyses. Clin Cancer Res 2002, 8:1155-1166.
20. Gruvberger S, Ringner M, Chen Y, Panavally S, Saal LH, Borg A, Ferno M, Peterson C, Meltzer PS: Estrogen receptor status in breast cancer is associated with remarkably distinct gene expression patterns. Cancer Res 2001, 61:5979-5984. 21. Sotiriou C, Powles TJ, Dowsett M, Jazaeri AA, Feldman AL,
Asser-sohn L, Gadisetti C, Libutti SK, Liu ET: Gene expression profiles derived from fine needle aspiration correlate with response to systemic chemotherapy in breast cancer. Breast Cancer Res
2002, 4:R3.
22. West M, Blanchette C, Dressman H, Huang E, Ishida S, Spang R, Zuzan H, Olson JA Jr, Marks JR, Nevins JR: Predicting the clinical status of human breast cancer by using gene expression profiles. Proc Natl Acad Sci USA 2001, 98:11462-11467. 23. Dudoit S: Statistical methods for identifying differentially
expressed genes in replicated cDNA microarray experiments.
Statistica Sinica 2002, 12:111-139.
24. Everitt BS: Cluster Analysis London: Arnold; 1993.
25. Lance G, Williams W: A general theory of classificatory sorting strategies: Hierarchical systems. Computer Journal 1967, 9:373-380.
26. Dudoit S, Fridlyand J: Classification in microarray experiments. In Statistical Analysis of Gene Expression Data Edited by: Speed T. Boca Raton: Chapman and Hall/CRC; 2003.
27. Wilcox R: Introduction to Robust Estimation and Hypothesis Testing San Diego: Academic Press; 1997.
28. Radmacher MD, McShane LM, Simon R: A paradigm for class prediction using gene expression profiles. J Comput Biol
2002, 9:505-511.
29. Tusher VG, Tibshirani R, Chu G: Significance analysis of micro-arrays applied to the ionizing radiation response. Proc Natl Acad Sci USA 2001, 98:5116-5121.
30. Sorlie T, Perou CM, Tibshirani R, Aas T, Geisler S, Johnsen H, Hastie T, Eisen MB, van de Rijn M, Jeffrey SS, et al.: Gene expres-sion patterns of breast carcinomas distinguish tumor
sub-Additional file 6
A PDF file showing Permutation to assess the
generalisability of the reduction in error rate observed by addition of the 'histology gene'.
See http://www.biomedcentral.com/content/ supplementary/bcr1506-S6.pdf
Additional file 7
A word document containing the legend for Additional data file 6.
classes with clinical implications. Proc Natl Acad Sci USA
2001, 98:10869-10874.
31. Sorlie T, Tibshirani R, Parker J, Hastie T, Marron JS, Nobel A, Deng S, Johnsen H, Pesich R, Geisler S, et al.: Repeated observation of breast tumor subtypes in independent gene expression data sets. Proc Natl Acad Sci USA 2003, 100:8418-8423. 32. Perou CM, Sorlie T, Eisen MB, van de Rijn M, Jeffrey SS, Rees CA,
Pollack JR, Ross DT, Johnsen H, Akslen LA, et al.: Molecular por-traits of human breast tumours. Nature 2000, 406:747-752. 33. Sgroi DC, Teng S, Robinson G, LeVangie R, Hudson JR Jr,
Elkahl-oun AG: In vivo gene expression profile analysis of human breast cancer progression. Cancer Res 1999, 59:5656-5661. 34. Iacobuzio-Donahue CA, Argani P, Hempen PM, Jones J, Kern SE:
The desmoplastic response to infiltrating breast carcinoma: gene expression at the site of primary invasion and implica-tions for comparisons between tumor types. Cancer Res
2002, 62:5351-5357.
35. Lindsay CK, Thorgeirsson UP, Tsuda H, Hirohashi S: Expression of tissue inhibitor of metalloproteinase-1 and type IV colla-genase/gelatinase messenger RNAs in human breast cancer.
Hum Pathol 1997, 28:359-366.
36. Zhang F, Riley J, Gant TW: Intrinsic multidrug class 1 and 2 gene expression and localization in rat and human mammary tumors. Lab Invest 1996, 75:413-426.
37. Jia SH, Li Y, Parodo J, Kapus A, Fan L, Rotstein OD, Marshall JC: Pre-B cell colony-enhancing factor inhibits neutrophil apopto-sis in experimental inflammation and clinical sepapopto-sis. J Clin Invest 2004, 113:1318-1327.
38. Gewirtz DA: A critical evaluation of the mechanisms of action proposed for the antitumor effects of the anthracycline antibi-otics adriamycin and daunorubicin. Biochem Pharmacol 1999, 57:727-741.
39. Chen B, Nelson DM, Sadovsky Y: N-myc down-regulated gene 1 modulates the response of term human trophoblasts to hypoxic injury. J Biol Chem 2006, 281:2764-2772.
40. Cleator S, Tsimelzon A, Ashworth A, Dowsett M, Dexter T, Powles T, Hilsenbeck S, Wong H, Osborne CK, O'Connell P, Chang JC: Gene expression patterns for doxorubicin (Adriamycin) and cyclophosphamide (Cytoxan) (AC) response and resistance.