Theses Thesis/Dissertation Collections
2-20-2012
Development of a process for identification of the
operational mode of industrial sites using high
dimensional multi-modal data
Jake Clements
Follow this and additional works at:http://scholarworks.rit.edu/theses
This Dissertation is brought to you for free and open access by the Thesis/Dissertation Collections at RIT Scholar Works. It has been accepted for inclusion in Theses by an authorized administrator of RIT Scholar Works. For more information, please [email protected].
Recommended Citation
by
Jake Clements
B.A. Computer Science, SUNY Geneseo, 2002
A dissertation submitted in partial fulfillment of the
requirements for the degree of Doctor of Philosophy
in the Chester F. Carlson Center for Imaging Science
Rochester Institute of Technology
February 20, 2012
Signature of the Author
Accepted by
ROCHESTER, NEW YORK
CERTIFICATE OF APPROVAL
Ph.D. DEGREE DISSERTATION
The Ph.D. Degree Dissertation of Jake Clements has been examined and approved by the dissertation committee as satisfactory for the
dissertation required for the Ph.D. degree in Imaging Science
Dr. John Schott, Dissertation Advisor
Dr. Peter Bajorski
Dr. Emmett Ientilucci
Dr. Matthew Coppenbarger
Date
CHESTER F. CARLSON CENTER FOR IMAGING SCIENCE
Title of Dissertation:
Development of a Process for Identification of the Operational Mode of Industrial Sites Using High Dimensional Multi-modal Data
I, Jake Clements, hereby grant permission to Wallace Memorial Library of R.I.T.
to reproduce my thesis in whole or in part. Any reproduction will not be for
com-mercial use or profit.
Signature
Date
by
Jake Clements
Submitted to the
Chester F. Carlson Center for Imaging Science in partial fulfillment of the requirements
for the Doctor of Philosophy Degree at the Rochester Institute of Technology
Abstract
Many algorithms exist to determine the physical contents of an image. Target
detection or anomaly detection algorithms, for example, use statistical and geometric
approaches in high dimensional space to locate objects within a scene. Instead of
target detection, however, it has become of interest of late to delve deeper into the
field of remote sensing in order to performprocess detection. Process detection refers
to the ability to identify the operational mode of an industrial facility. To accurately
complete this task will require a new set of analysis tools.
This thesis discusses a method that can be used to perform process detection
with multi-modal remotely sensed data. Using a local industrial facility, operational
modes were identified, as well as the subtle differences between them. Combinations
of hourly data, sparse data, and latent variables were combined through analytical
tools and a prediction of the process taking place at different moments was
perform-ing usperform-ing both real and simulated data sets.
An advanced analyst environment is also discussed, with a few demonstrations
from a test environment developed by a small team at RIT. Temporal analysis,
multi-modal data integration, and the use of process models to make latent observables are
discussed. This thesis shows the utility of such an environment and demonstrates
the need for the further development.
1 Introduction 20
2 Background 26
2.1 3D Data Registration and Analysis . . . 26
2.1.1 Analyst Environments . . . 27
2.1.2 Image Storage . . . 31
2.1.3 The AANEE Environment . . . 32
2.2 Site Identification . . . 32
2.2.1 Infrastructure Analysis . . . 34
2.2.2 Process Identification . . . 39
2.3 Observable Signals . . . 40
2.3.1 Data Collection Methods . . . 40
2.3.2 Obtaining Real Data . . . 46
2.3.3 Summary . . . 52
2.4 Data Interpretation . . . 52
2.4.1 Types of Metrics . . . 53
2.4.2 Weighting . . . 69
2.5 Summary . . . 70
3 Site of Interest: Data and Processes 72 3.1 Van Lare Site . . . 72
3.1.1 Wastewater Treatment . . . 73
3.1.2 Van Lare Process Model . . . 86
3.1.3 Operational Modalities . . . 91
3.2 Information Collection . . . 92
3.2.1 Data Collection . . . 93
3.2.2 Information Collection . . . 100
3.3 Summary . . . 105
4 Van Lare Mode Prediction 106 4.1 Flow Prediction . . . 106
4.1.1 The Data . . . 107
4.1.2 Testing with Real Data . . . 123
4.1.3 Testing with Simulated Data . . . 136
4.1.4 Summary . . . 148
4.2 Single Side Mode . . . 148
4.3 Shutdown Mode . . . 149
4.4 Bypass Mode . . . 151
4.5 Non-Likely Modes . . . 153
4.5.1 Chemical Weapon Production . . . 153
4.5.2 Environmental Hazard . . . 155
4.5.3 Biological Hazard . . . 158
4.6 Summary . . . 159
5 Summary 160 6 Future Work 162 6.1 Data Analysis . . . 162
6.2 A New Site . . . 163
6.3 Data Over Time . . . 163
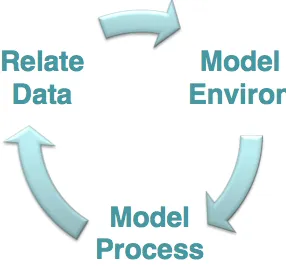
1.1 A three pronged approach to interactive site modeling with each piece being highly interrelated to the other two. . . 22
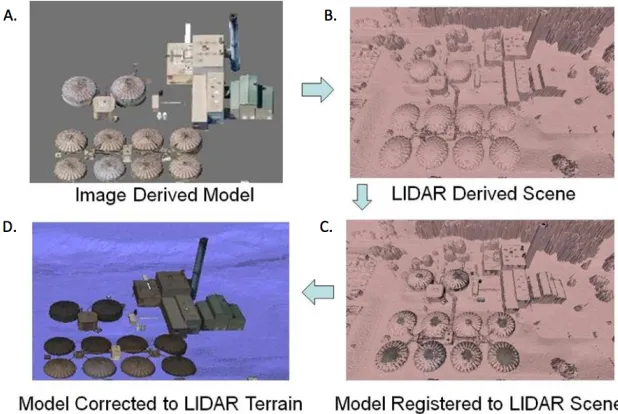
2.1 An example of 3D registration. A is an image derived model, B is a
LIDAR model. The two are shown registered to each other inC, and
D is a hyrbridization of the two models: high quality 3D structure
with spectral information. Images courtesy of Karl Walli. . . 27
2.2 Arc image of the building locations being overlaid on an RGB image.
A slight misregistration can be seen, but it is the same at all angles
and zooms, and easily compensated for by an analyst. Files courtesy
of Monroe County. . . 29
2.3 Arc image of roads overlaid on an RGB image, placed on top of a
digital elevation model. Files courtesy of Monroe County. . . 30
2.4 GE image with LWIR image laid on top of RIT campus. . . 31
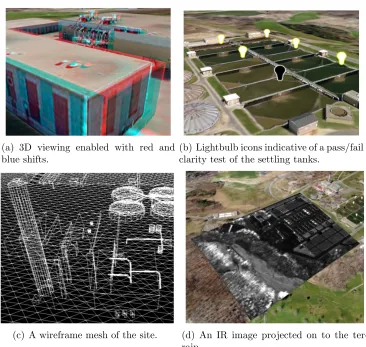
2.5 A few examples of the capabilities of the AANEE analysis
environ-ment. . . 33
2.6 This is a rather large plant which has countless vehicles all around.
There is also a closed road course on the left side which seems to
indicate this is a vehicle manufacturing facility. Image courtesy of
Google Earth. . . 35
2.7 A relatively small facility with a giant cooling pond. The large electri-cal transformers give away that this is a power plant. Image courtesy
of Google Earth. . . 35
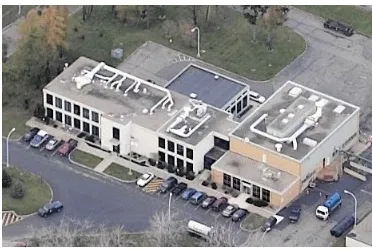
2.8 A building with several windows, cars parked out front, and various pipes and vents on the roof. This is an administration building with some small scale gas or chemical testing taking place within. Image courtesy of Bing Maps. . . 36
2.9 Two identical looking circular tanks with several pipes, performing the same process in parallel or similar sequential processes. Image courtesy of Bing Maps. . . 36
2.10 A facility with large buildings and ample vehicles, indicating a man-ufacturing facility of some kind, but of what is not easily determined without more information. Image courtesy of Google Earth. . . 37
2.11 A thermal infrared image showing hot underground pipes (bright white lines). Image courtesy of Petrie, 2001. . . 38
2.12 Fish-eye view of the entrance to Van Lare. . . 43
2.13 An example of mass media intelligence. The article is available at http://www.monroecounty.gov/des-index.php. . . 44
2.14 LWIR image of the Irondequoit pump house at the Van Lare facility and a transformer yard (outlined in red) that is directly related to the power usage of the building. . . 50
2.15 LWIR images of the transformer yard. . . 51
2.16 LWIR ROIs of the transformer yard. . . 51
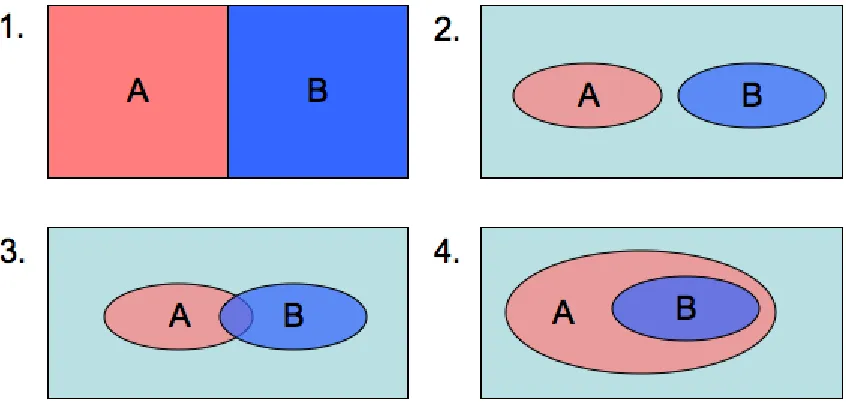
2.17 Venn diagrams of four cases using only two states. . . 54
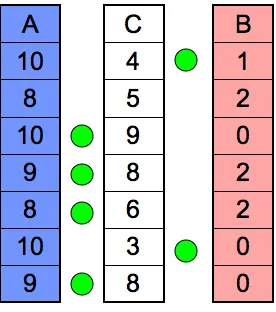
2.19 Comparing C~ to templates A and B. In this case a match is
deter-mined based on the relative closeness of each element of C~ is to the
corresponding template elements. . . 57
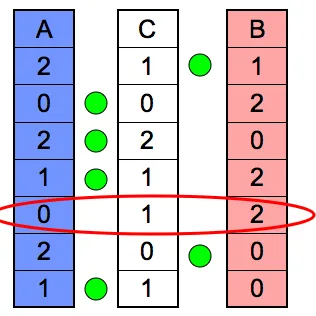
2.20 ComparingC~ to templates A andB and determining the probability
of each state based on matches. With one row producing no matches
there is also a chance thatC~ is in neither state. . . 58
2.21 A representation of each state as its own space with sub-states. . . . 59
2.22 The points (left) and the distance each point is to all other points
(right). . . 62
2.23 After points 3 and 4 are made a cluster, the distances are recalculated. 62
2.24 Cluster results for case 1. . . 63 2.25 Shows two different clustering results of the same data set with
dif-ferent maximum distances. . . 64
2.26 This shows four different clustering possibilities of the same points.
This demonstrates the need for accurate representations of the
distri-bution functions of each mode in order to obtain reliable confidences. 65
2.27 A visual example of classifying the purple test point into one of the
red, blue, or green clusters and then taking it further to attempt to
2.28 This diagram shows the operational mode identification process bro-ken down into six key parts. The blue section (yellow boxes) lists
the pieces already present that are needed for this project. The green
section (purple boxes) shows the three key pieces of site identification.
Those first two sections feed into the purple section (orange boxes)
where the observable identification process is shown. From there it
goes on to the data collection process (grey section, green boxes).
This follows on into the yellow section (blue boxes) where the
differ-ent signals will receive a weighting based on the confidence an analyst
associated with it. The last red section (aqua boxes) is where different
algorithms are utilized to predict the operational mode. If the results from this are good then prudent action can be taken. Otherwise it
will be necessary to re-examine the data and determine what can be
done to improve the results. . . 71
3.1 The deep rock tunnel system for storing wastewater underneath the
city of Rochester. Image courtesy of Monroe County. . . 75
3.2 The deep rock tunnel system for storing wastewater underneath
Iron-dequoit. Image courtesy of Monroe County. . . 76
3.3 The pump station and transformer yard that bring wastewater to the
Van Lare facility from Irondequoit. . . 76
3.4 West side screening and grit removal building, which uses large
mov-ing screens to grab the objects and pull them out of the liquid and
into a garbage bin, then spins the wastewater to cause grit to settle
to the bottom. . . 77
3.5 The east side screening and grit removal process which takes place in
two large buildings. The screens grab large objects out and discard
them as trash and the grit removal building slows the flow down to
allow grit to settle to the bottom. . . 78
3.6 Wastewater as it enters the plant and goes through the grit removal
3.7 West side aeration tanks, which are covered because the air is added
to the mixture through pipes at the bottom of the tank. . . 79
3.8 East side aeration tanks that vigorously stir the wastewater. . . 79
3.9 Settling tanks in which the flocculation process occurs, allowing most
organic material to be removed from the wastewater. The west side
uses several small rectangular tanks while the newer east side tanks
are much larger and circular. . . 80
3.10 Wastewater as it receives aeration and then enters the primary
set-tling process. . . 81
3.11 The six large secondary settling tanks. . . 81
3.12 Wastewater as it goes through the secondary settling process. Notice that while the top layer is mostly clear, it is still not ready to be
released into the lake. . . 82
3.13 A mazing tank used to mix chlorine in with the wastewater to kill off
harmful microorganism not handled by the activated sludge process. 82
3.14 Evaporators or thickeners, these large structures are long term
set-tling tanks for sludge. . . 83
3.15 The group of buildings that deal with sludge treatment. . . 84
3.16 These are zoomed in LANDSAT images of the Van Lare site. The
middle image is from 1980 and one can clearly see only a few grey pixels. The right image is from 1990. The same grey region of pixels
is there, but the arrows are pointing to two distinct new features,
which are the newer sets of primary and secondary settling tanks.
LANDSAT images courtesy of the USGS. . . 86
3.17 Van Lare Wastewater Treatment Plant as seen in Google Earth. . . 87
3.18 One of the unknown buildings from Figure 3.17, this building is a
combination of administrative offices and wastewater testing facilities.
Image courtesy of Bing Maps. . . 88
3.19 One of the unknown buildings from Figure 3.17, this building is used
3.20 Wastewater treatment process overlaid on an image of the plant. Blue arrows are wastewater, red arrows are sludge, and the green arrows
are air. Image courtesy of Google Earth. . . 89
3.21 Process model integrated into the AANEE software. The dots move
from left to right showing the flow of wastewater through the plant. 90
3.22 A diagram of the spectral regions that traverse through the
atmo-sphere and are utilized in remote sensing. Image courtesy of Schott,
2007. . . 94
3.23 Elevation models of Van Lare several years apart. Blue is low, red is
high, and one can see that a valley has been filed in, evidenced further
by the large red hump in the right-most image. Images courtesy of
Karl Walli. . . 95
3.24 Some of the pictures from the first trip to Van Lare. . . 96
3.25 Ground based LWIR images of Van Lare. . . 96
3.26 A graph showing tanks vs. flow generated from the points in Table 3.4 102
3.27 A discrete uniform probability function based on the input of another
variable. In the first image, the input value from the observed variable
is 5. In the second image the input value is 13, causing the data points
to shift to the right. . . 104
3.28 A continuous probability function based on the input of another vari-able. In the first image, the input value from the observed variable
is 5. In the second image the input value is 13, causing the curve to
shift to the right. The shape of the curve remains unchanged. . . 105
4.1 The probability distribution curves generated in Excel from the data
points in Table 4.4. Given a day of the month one can plug that value
into the given equations and get an approximate probability of each
4.2 The probability distribution curves generated in Excel from the data points in Table 4.5. Given a time of day one can plug that value into
the given equations and get an approximate probability of each flow
mode. . . 112
4.3 A graph and function that predict the flow based on the number of
inactive tanks. . . 113
4.4 The algorithm used to get a random slide of inactive tanks from 8
a.m. to 4 p.m. . . 115
4.5 The algorithm used to get a random slide of inactive tanks from 6
p.m. to 6 a.m. . . 116
4.6 The algorithm used to add a random amount of inactive tanks to the
simulated late summer and fall values. . . 116
4.7 The algorithm used to add a random amount of inactive tanks to the
simulated spring values. . . 117
4.8 The algorithm used to add a random amount of inactive tanks to the
simulated spring values. . . 117
4.9 An image of the secondary settling tanks on day when the biological
balance was not maintained perfectly and they ended up very cloudy.
Image courtesy of Bing Maps. . . 121
4.10 Templates made to determine the rate of flow based on all real data.
PC means principal component. . . 124
4.11 The VNIR band of each of the three real data collects. Notice the
inactive large primary settling tank in the July and August images. . 125
4.12 The results of putting real data into the templates shown in Figure
4.10. . . 126
4.13 A poor result from using random cluster centers to start the k-means
algorithm. The cluster centers are shown as red boxes. 5
medium-high flow mode instances are placed in a cluster by themselves simply
because they occurred during a period of high rain fall. . . 129
4.14 An image of the underground pipes at Van Lare with the arrows
4.15 A small collection of the items an analyst would want to investigate when trying to find the source of an environmental issue on or near
2.1 A collection of the possible overhead imagery data types and examples
of what they could be used to detect at an industrial site. . . 47
2.2 A collection of the possible remote ground detection data types and
examples of what they could be used to detect at an industrial site. . 47
2.3 A collection of the possible mass media intelligence data types and
examples of what they could be used to detect at an industrial site. . 48
2.4 A collection of the possible on site measurements and examples of
what they could be used to detect at an industrial site. . . 48
2.5 Ratio of LWIR signals, the difference in digital counts, and the percent
higher of the transformers to the area around them. . . 51
2.6 An example of the application of Dempster-Shafer theory. Here it is
assumed that all of the variables have the same reliability, and the
probability of each case is shown as the reliability changes. . . 60
2.7 Distance from center of each cluster shown in Figure 2.26 to a test
pointC = (4,4).We can see that changing the manner in which each
mode is described can change accuracy of the model. . . 65
2.8 An example of 2 states with 2 variables each with 2 states and the
probability of each occurring. s+t+u+v+w+x+y+z = 1 . . . 67
2.9 The final calculated conditional probabilities of a simple binary state
with 2 binary variable example. . . 68
2.10 A comparison of two binning techniques on a set of 10 numbers. In the left two columns bins A and B are equal sized, with those greater
than 0.5 going in B and those less than 0.5 going into A. The right
two columns have bins of different sizes, splitting the data at 0.35,
but both bins have the same number of members. . . 68
3.1 Vehicular traffic at Van Lare, 5/13/2009 . . . 97
3.2 Table of sampling interval, vehicle detections, and amount of data. . 97
3.3 A correlation matrix of the two influent pumps, the storm system
siphon, and the amount of rain over the previous 6 hours from June
1, 2007 - May 31, 2008. . . 100
3.4 A collection of estimated data points based on SME information. The
SME stated that there are typically 4-8 inactive tanks, which I took
as indicative of medium flow mode. If all of the tanks are inactive
then there is no flow, and it is assumed that if the plant is in the top
25% of high flow mode (189.4 mgd) then there are 0 inactive tanks.
Flow is measured in millions of gallons per day (mgd). . . 102
3.5 A correlation matrix of inactive settling and aeration tanks along with
wastewater flow through the plant. . . 103
4.1 The amount of correlation amongst rain and wastewater flow. . . 107
4.2 The number of principal components of rain used, how much variance
in the rain they cumulatively explain, and theR2 value of a regression
model when these PCs are used to predict the wastewater flow at Van
Lare. . . 108
4.3 A table showing the coefficients of the first five principal components
of the rain data. . . 108
4.4 Probability distribution function for flow per month. . . 109
4.5 Probability distribution function for flow per hour. . . 110
4.6 The reliabilities of the variables used in an application of
4.7 Applying the reliabilities in Table 4.6 to the data in Figure 4.10 pro-duces the results in this table. As is demonstrated here, it is more
likely for four variables to be correct with two incorrect than it is for
one to be correct with five incorrect. . . 127
4.8 Probability of Low, Medium, and High flow modes using the
geomet-ric approach on real data. . . 129
4.9 Adjustments to the prediction of flow based on the month of the year.
These are the values associated with mi in Equation 4.18. . . 130
4.10 Adjustments to the prediction of flow based on the hour of the day.
These are the values associated with hj in Equation 4.18. . . 131
4.11 A comparison of real data to the values predicted by a regression
model that used only real data. The numbers are in mgd. . . 132
4.12 The percentage of occurrences of Low flow mode with the time of day
and the season of the year. . . 133
4.13 The percentage of occurrences of Medium flow mode with the time
of day and the season of the year. . . 134
4.14 The percentage of occurrences of High flow mode with the time of
day and the season of the year. . . 134
4.15 The conditional probabilities of Low flow mode given the time of day
and the season of the year. . . 135
4.16 The conditional probabilities of Medium flow mode given the time of
day and the season of the year. . . 135
4.17 The conditional probabilities of High flow mode given the time of day
and the season of the year. . . 136
4.18 Probability of Low, Medium, and High flow modes using the
geomet-ric approach with a simulated tank variable given equal weighting. . 137
4.19 A comparison of real data to the values predicted by a regression
model that used simulated values for a tank variable. The numbers
4.20 Probability of Low, Medium, and High flow modes using the geomet-ric approach with a random variable given equal weighting on the
left, and half weighting on the right. . . 137
4.21 A comparison of real data to the values predicted by a regression
model that used a random variable in the place of a simulated tank
variable. The numbers are in mgd. . . 138
4.22 5 simulated scenarios that could happen at Van Lare. Test 1 is
ex-tremely low flow mode. Test 2 is low flow mode on the cusp of medium
flow mode. Test 3 is conflicted data. Test 4 is high flow mode on the
cusp of medium flow mode. Test 5 is extremely high flow mode. . . . 139
4.23 A template representing all of the potential variables, real and
simu-lated, being used to detect the flow level of the Van Lare plant. . . . 140
4.24 A template of the results of combining real data with simulated data
on the real data collects. . . 141
4.25 Reliabilities used for the Dempster-Shafer application shown in Table
4.26. . . 142
4.26 Probability of Low, Medium, and High flow modes using the
Dempster-Shafer approach on the simulated data. . . 142
4.27 Probability of Low, Medium, and High flow modes for each of the
simulated tests shown in Table 4.22 using the standard calculation approach of the template matching method. . . 143
4.28 Probability of Low, Medium, and High flow modes for each of the
simulated tests shown in Table 4.22 using Dempster-Shafer theory. . 143
4.29 The probabilities of each mode using the geometric method with
sim-ulated data. . . 144
4.30 Probability of Low, Medium, and High flow modes for each of the
simulated tests shown in Table 4.22 using the geometric approach. . 145
4.31 The results of the regression using Equation 4.19. The numbers are
in mgd. . . 147
4.32 The predicted level of flow for each of the scenarios show in Table
4.33 A basic template used to predict shutdown mode. . . 150
4.34 4 examples that use the shutdown mode template. . . 151
4.35 A basic template displaying some potential signals to look at in the
pursuit of a chemical weapon investigation. . . 155
4.36 A basic template displaying collected signals to look at in the pursuit
Introduction
In the remote sensing community image analysts are tasked with finding out what
information is contained within an image. Typically this is limited to what physical
objects are in the image, where they are, and how many of them are there. Through
these studies one can often tell the difference between a college and a high school,
or a nuclear plant and a water treatment plant. Clearly it is of interest to the
intelligence community to take this information to the next level. Now that one can say with certainty that one is looking at a nuclear plant, it is desirable to be able to
determine whether the plant is reprocessing spent fuel rods or enriching uranium to
weapons grade. Such differences will manifest themselves through several types of
signals, and it is important to have a quantitative method that effectively combines
the information from those signals into a probability of each possible state.
Shortly after September 11, 2001 our government tried to convince the country
to support it in its invasion of Iraq. While full support was never obtained, the
government was able to obtain enough of a backing by showing Congress evidence
of weapons of mass destruction in Iraq. The invasion followed, the war raged on for
several years, and none of the weapons were ever found. This is a situation in which our intelligence completely failed and it demonstrates the need for new approaches
to intelligence analysis.
Presently there is so much information being placed in front of the image analysts
that it has become difficult for them to sort it all out and ably separate the relevant information from the irrelevant. This thesis discusses an approach that has been
developed, as well as a hypothetical computer environment, that can assist analysts
so that they can more easily take in information, sift through historical data, and
draw conclusions with higher confidence. Through the work described in this thesis
these findings can now be linked together with other sources of information so that
an analyst can accurately describe the processes taking place within a facility of
interest. This approach is relatively simple in terms of its technical interface to
accommodate the broad expertise range (often non technical) of most analysts.
Objectives
The AANEE Project
One can imagine a data repository in which all forms of intelligence data are stored
and geo-referenced, an environment in which to seamlessly interact with data, and advanced algorithms to assist the analyst in various tasks such as target detection
or site identification. That ideal environment is still a long way off, but it has been
labeled part of the Advanced ANalyst Exploitation Environment (AANEE) project.
This project has been split into three portions: development of a three dimensional
interactive environment in which to store the data, advanced registration techniques
to relate the data, and development of a process for testing and evaluation of
ex-ploitation algorithms that utilize the other two as well as feed in new data. The first
two portions of the project are being undertaken by other researchers but are
men-tioned here because they are intimately related to the work being proposed herein as shown in Figure 1.1.
The ideal AANEE environment is one in which there are 3D models of all
build-ings and terrain. A large variety of data types would be available, including all
forms of imagery, human intelligence, and other signal data such as RF and seismic.
An analyst should be able to listen to a building “talk” about its purpose and
Figure 1.1: A three pronged approach to interactive site modeling with each piece being highly interrelated to the other two.
should be possible to scroll through time, to see changes that have been made either
in the structure or in the signals present. Any combination of data should then be
able to be extracted for more in depth analysis through advanced algorithms that
are unable to run in real time. The output from these algorithms, however, should
then be able to be fed back in to the environment, so as to provide more data to a
future analyst.
Such an environment would need a user interface that is easily extensible to
many disciplines. For each building to know its function it will be necessary to have
process models of the facility. Developing process models for all aspects of a facility
will require a subject matter expert. In order to bring in large quantities of data it
will be necessary to have a data reader for each datatype. Lastly this should not be
limited to a single facility, but should instead cover the world, so that all sites can
be monitored, either to track weapon production at a foreign site or to track the all
hazardous chemical usage at domestic sites.
The ideal scenario is too massive for a university research group to undertake. A fully functioning version of this idea is something this thesis seeks to convince others
to develop by exploring some of the ways to bring data together and the use of
analysis tools that can help. Some parts of the environment have been implemented
tools envisioned for this dream. Since one of the goals of the AANEE project is to have the process described in this thesis implemented in the interactive environment,
some of the preliminary tests will be demonstrated throughout this thesis.
A Method for Process Identification
The primary objective of the proposed research is to develop and demonstrate a
process for the in depth analysis of multi-source, multi-angle, multi-temporal data
of a single site. This method starts with the assumption that three dimensional data
registration exists and that there is already an interactive environment in place in
which to examine the data. The process then follows a series of steps, beginning
with intimately identifying a target site, followed by signal analysis and quantitative
analysis of the signals.
Site Identification
When an analyst is first tasked with a site he/she needs to follow a series of steps to
learn everything there is to know. Site identification refers to the manner in which an
analyst can determine the various modalities of a facility. This is broken down into
three parts. First, infrastructure analysis is done so that the various subprocesses
can be identified. These are then combined together to reveal the main function
as well as the flow of all of the materials as they traverse the site. The different operational states can then be described (production level, on/off, efficiency - all
site dependent), so that differences among them become evident.
Signal Analysis
It is desirable to find a way to integrate data driven techniques (such as target
detection from imagery) with process models derived from domain experts. Analysts
should be able to link these through logical processes that are designed to identify, model, and/or predict observable signals. Signal analysis is a preparation technique
a particular site. The observable signals across a broad range of modalities (types of intelligence data or INTs) that may allow one to differentiate between modes
are identified. One will have to determine the relationship each observable signal
has to the operational modes of the site. These signals are a representation of the
relationship of the different processes and their different manifestations. The range
of values each signal may have and how these are manifested in the different types
of sensor modalities needs to be understood, as well as how a change in one signal
may affect other signals.
Analysis Tools
The final stage of this process is combining the observable signals in some form
of analysis technique to predict the operational mode of the site. For this project
three different algorithms, each building off the relational statistics of the various
observable signals in different complexity, are examined. The first and most basic is
template matching, which will be an easy to build model requiring relatively small
amounts of data, as long as the physical relationships are known or approximated.
Second is a geometrical approach to clustering vector representations of the data,
which requires significant amounts of data collected over weeks or months. Lastly direct statistical methods are discussed which can make the most precise
calcula-tions, but may require months or years of data collection. Since waiting months is
not desirable (even weeks can be too long), it may become necessary to utilize a
cooperative site. This will enable one to use simulated, estimated, or statistical data
in order to determine the relationship each observable has with each mode with a
fairly high initial degree of confidence.
In regards to confidence, one may want to incorporate a confidence quantity in
each observable. This practice will be explored as well. Many different factors may
be taken into consideration when talking about confidence. For example, data col-lected from a brand new experimental sensor may not be as reliable as data colcol-lected
from a well researched, well calibrated sensor that has been around for years. The
of the data (e.g., US, France, Britain) might be of concern. Calculating confidence to an exact number is not often possible as it is typically considered a quality, not
a quantity. However, estimates can be made and a weighting can be given to each
of the observables used for process identification.
This process is analyzed through the use of a friendly industrial site using a large
amount of real data, specifically the Van Lare Wastewater Treatment plant. This
plant offers a wide array of signals and operations, ranging from open air processes
to subterranean input and output. This site is described in great detail in Section
3.1. The operational modes are identified and detected accurately. As a final test
some artificial scenarios have been developed, and simulated data based on the real physical relationships of the variables is used to test the analysis tools in extreme
situations.
The contribution of this thesis is to demonstrate the possibilities of such an
environment, as well as identify the issues and requirements in both the data and the
analysis tools. The current intelligence analysis methods used by our government
lacks the ability to accurately determine the operational mode of a facility. The
process developed here does not completely solve this problem, however it greatly
Background
2.1
3D Data Registration and Analysis
Since 3D data registration is assumed to be a conquered subject for the AANEE
project, this section focuses on different analyst environments and the manner in which they handle this problem. A true solution to the problem with an easily
attainable environment is not presently available, but near approximations do exist.
Image registration deals with aligning two or more images so that objects in all
of the images line up together (Schott, 2007). Since not all of the information being
used in this project is imagery it is necessary and prudent to extend this idea to
all of the data. While precise registration is not necessary for the exploitation tools
as implemented for this initial study, it would allow for a program to automatically
update the results of analysis tools once they have been built for a site.
Two dimensional registration links images together at a pixel level. 3D image registration extracts the geometrical information from the data in order to recover
structure. An example of this process is shown in Figure 2.1 where an image derived
model is registered to a LIDAR model. LIDAR is a remote sensing paradigm used
to collect 3D information, while images are 2D at each band. Using advanced
photogrammetry techniques it is possible to derive low quality models from imagery.
When this model is registered to a high quality LIDAR model, the result is a high
quality model with spectral information (Walli, 2010).
Figure 2.1: An example of 3D registration. A is an image derived model, B is a LIDAR model. The two are shown registered to each other in C, and D is a hyrbridization of the two models: high quality 3D structure with spectral information. Images courtesy of Karl Walli.
The goal is to find, for example, a way in which to tie a time sampled observation
of a road to a newspaper article about a car accident and a thermal image of a facility.
Commercial environments that attempt to do this have many deficiencies which is why construction of an environment to explore possible new tools was initiated in
this thesis. For completeness, what follows in the next section is a brief discussion
of some commercial analyst environments.
2.1.1
Analyst Environments
Current image analysis environments allow for some data integration, but rarely is
multi-INT data brought together in the same place. There are several projects
avail-able for free download that offer image analysis tools. The University of Manchester
is called NeatVision, which are just two examples. These programs allow for both computer vision (target detection, object recognition) and medical image analysis.
The software deals mostly with grey scale images, though, with no mention of three
dimensional registration which would be required for multi-modal, multi-angle data
(TINA, 2008; NeatVision, 2008).
More advanced environments are available such as Google Earth and ArcGIS.
These more advanced software packages allow for the importation of all sorts of
im-age data, including three dimensional models that can be made with CAD software
or extracted from LIDAR point clouds. Within these software packages are some
advanced registration techniques that, while not perfect, allow analysts to view
mul-tiple data sources with only minor difficulties. Lacking from these software packages is the integration of the data with process models and/or prediction models. An
analyst can point out an object and declare it to be a tank with ninety percent
cer-tainty, and the position of the object can be tracked over time, but there is nothing
that relates that object to the environment in which it was found (Google Earth,
2010; ArcGIS, 2010). The remote sensing community believes that the near future
will not bring about vast changes in sensor design but instead revolutionary
ad-vances in analytical environments. There is a push for sensor fusion that will allow
more information to be extracted from current remote sensing systems (Gail, 2007).
This effort is designed to develop and test tools that might be incorporated into such an analyst exploitation environment. It is important to be able to compare
new tools based on their ease of use, performance, and how complex of a task each
can handle.
Data assimilation refers to the manner in which the data is brought together
and collectively analyzed. There are several tools already in existence that were
used during the course of this research, the top two being ArcGIS and Google
Earth. Google Earth (GoogleEarth.com) is a powerful image analysis tool that
is being used by the National Geospatial Intelligence Agency (NGA) (Messinger,
2007). ArcGIS (ArcGIS.com) is a popular software package being used by several government agencies, including Monroe county officials (Lukas, 2007). Both software
layer them on top of each other. One can mark points of interest in each image and see where they line up in other images. Both were used in the early stages of
this project in order to test their capabilities and limitations and to see how they
compare to the final goal of the AANEE project.
ArcGIS
ArcGIS (Arc) is a well known imagery storage system that is used by several
gov-ernment agencies. It has similar capabilities to GE, however it does not have a free
version available. The advantage that Arc and GE professional have is that they tie images together through the global positioning system (GPS). This allows for
significantly more accurate importation of imagery. Some image formats have their
GPS coordinates built into the image header file so that one merely has to select the
image to be imported and the software takes care of the rest. This is demonstrated
in Figures 2.2 and 2.3. The latest version of Arc is capable of doing much of the
basic analyses required for this project, but one would still have to build and test
their own analysis models and integrate them through the user interface. It is also
primarily a 2D environment (Esri.com, 2010).
Figure 2.3: Arc image of roads overlaid on an RGB image, placed on top of a digital elevation model. Files courtesy of Monroe County.
Google Earth
Google Earth (GE) has both a free version and a professional version available for
use. The free version, while not as powerful as the professional version, will likely
provide all that one would need for this experimental research project. It provides
full color, high resolution, nadir imagery of the majority of the United States and a
good portion of the rest of the world. Through the image import tool one can have their own images overlaid on the Google scene as seen in Figure 2.4. Each image can
be tagged with a time stamp, and points of interest can then be tracked temporally.
Because of GE’s low cost, widespread use in the intelligence community, and
accessibility it was decided that software developed in this research would be able
to communicate with it freely. Some images and models were able to be exported
from GE and imported into the exploratory AANEE software, and vice versa. This
task goes outside the scope of this research, but is within the scope of the AANEE
project as a whole, and was handled as a joint effort by Karl Walli and Colin Doody
(Walli, 2010). The software package aided in the analysis portion of the project (the part of AANEE directly related to the research presented in this thesis) by providing
Figure 2.4: GE image with LWIR image laid on top of RIT campus.
recording of observables. In order for all of this to be possible, however, an efficient
manner of image storage and retrieval is necessary.
2.1.2
Image Storage
Image storage such that quick and easy retrieval is possible is a very difficult task.
There are several pieces of information that are relevant to each image, such as date
and time of capture, instrument used, available bands, resolution, weather, where
the shot was taken from, GPS coordinates of the image corners, and the content
contained within. Most database systems were originally designed to handle large
quantities of alpha-numeric data. However, many are not yet ready to handle image
data.
A thorough image database would need to be able to store the original input
image as well as any images that are simply processed forms of the original image,
and easily be able to differentiate between the two. Any tags that have been made
in the image, such as points of interest or textual additions from an observer, need
to be stored, as well as returned when one is trying to retrieve a different image
with the same physical contents. Mehrotra suggests that processed images should
be linked with the process that was used to make them (Mehrotra, 1995). While
the source of this proposed system is over ten years old, only temporary methods
Attempting to accomplish all of these tasks is a doctoral project in itself and goes beyond the scope of this project.
Esri and Oracle have designed a database system that is used in ArcGIS 10. It
does allow for the integration of spatial data and business information. It can also
handle multiuser access to a large quantity of image data. However, the system is
not to a point where it can handle running image analysis algorithms on its imagery
and efficiently store the results. Esri has recently partnered with the NGA to begin
working on such a system (Esri.com, 2010).
2.1.3
The AANEE Environment
The limitations of current analyst environments demonstrate a need for the AANEE
project. Using interactive gaming technology, the team built a 3D environment in
which to view and interpret registered multi-modal data. Several different tools were developed and tested so that an analyst may be immersed within data and
perform more advanced analyses. A few simplistic models were tested in order
to demonstrate some basic capabilities, shown in Figure 2.5. In order to take full
advantage of this environment it was necessary to develop a process to bring different
signals together for analysis and obtain descriptive information of greater complexity
than just the physical characteristics. For this thesis it is assumed that an AANEE
environment with 3D registered multi-source data, models of the plant, and process
simulation (for estimations/simulations of variables) is fully functional. This is
used to understand how new analysis paradigms might be facilitated in such an environment. In many cases both data and functionality may need to be simulated
since the goal is to explore new approaches long before full capabilities exist to help
determine if this is a productive approach.
2.2
Site Identification
For this study it is assumed that the physical location of a site has already been
(a) 3D viewing enabled with red and blue shifts.
(b) Lightbulb icons indicative of a pass/fail clarity test of the settling tanks.
[image:34.612.141.507.214.561.2](c) A wireframe mesh of the site. (d) An IR image projected on to the ter-rain.
project the term ‘site identification’ is referring to identifying all of the pieces of the site, both what the different objects are and what they do. More precisely:
the interrelationships amongst the buildings and infrastructure that are isolated or
demarcated by a security perimeter. This is done in two steps. First isinfrastructure
analysis, where the functions or processes or individual structures are identified.
The other step is process identification, where the main function of the facility is
determined by putting the pieces together.
2.2.1
Infrastructure Analysis
When one encounters a site for the first time it is often easiest to investigate the
layout of the buildings and roads on the site first, as these are typically available
for viewing from airborne imagery. Deciphering the main function of the plant,
however, may prove difficult without knowing all of the input and output materials.
Buildings, Roads, and Machinery
What is often the most accessible information through traditional remote sensing
methods is the site infrastructure. Buildings, roads, pools, and electrical transformer
yards are large objects that are not easily hidden and change very little over short
periods of time. Many clues about a site are evident from its infrastructure. Different
types of facilities will need different types of cooling towers, in different numbers, and possibly in multiple locations. Others might need pools of water or other chemicals
for various processes. One can get an idea as to the number of workers on the site
and the number of different shifts by counting the number of cars in the parking lot
throughout the day. The two sites shown in Figures 2.6 and 2.7 provide examples
Figure 2.6: This is a rather large plant which has countless vehicles all around. There is also a closed road course on the left side which seems to indicate this is a vehicle manufacturing facility. Image courtesy of Google Earth.
Buildings are functional objects; they are rarely put up without knowing what is intended to go inside. Using this information, one can assume that each building
often represents one or more different phases of the process taking place on a site,
[image:37.612.230.416.217.342.2]like the example shown in Figure 2.8.
Figure 2.8: A building with several windows, cars parked out front, and various pipes and vents on the roof. This is an administration building with some small scale gas or chemical testing taking place within. Image courtesy of Bing Maps.
Multiple buildings of similar dimensions often implies that the buildings house
the same equipment, such as in Figure 2.9. An analyst can use this information
to figure out how many phases there are to the process running at the site and
compare the buildings to those on known sites. This helps the analyst draw an
accurate conclusion as to the purpose of the facility on a target site (Allen, 2008).
Figure 2.9: Two identical looking circular tanks with several pipes, performing the same process in parallel or similar sequential processes. Image courtesy of Bing Maps.
[image:37.612.250.398.503.630.2]with very large motors. Motors and engines give off radio waves while they run, and they are often fairly unique to the type of motor. While these signals are unlikely
to be picked up from airplanes, one could envision a passive RF detector placed on
the ground nearby, potentially reading the signals given off by the motors. These
signals should help clue an observer as to how many motors are running at a given
time within the site of interest. Motors generate heat while in operation. Should
the motor be large enough, or should there be enough of them in operation, the heat
will be significant enough to be able to detect the activity from outside the building.
The facility in Figure 2.10 is not as obvious to classify as the sites shown in
Figures 2.6 and 2.7. There is either one giant building or several smaller buildings
that are all connected; the only thing that is clear is that there are definite points of separation along the roof showing they are different ages, materials, or both.
To get a sense of scale, compare the size of the buildings with the size of the cars
in the surrounding parking lots. Every segment is quite large, indicating some
very large machinery must be inside, but without more information it is difficult
to determine what processes are taking place within. With more historical data it
might be possible to identify when each segment was constructed, and possibly track
the changes in terrain to see how much earth was moved with each addition. More
insight can be obtained by examining the input and output materials in order to
[image:38.612.255.392.509.638.2]help identify such facilities.
Input and Output Sources
A site of interest is similar to a mathematical function in that it performs some
operation on its inputs to produce an output. Input sources are often numerous,
and each one may need to be accounted for. One can watch the outside of a site and
count deliveries as they are being made and get key information such as quantity
and frequency. Most industrial facilities will need a source of water, electricity,
fuel, and waste outlets. Most modern sites also require cell phone service and high-speed internet access (Commercial Real Estate, 2011). Unfortunately, most of these
are typically done underground making them difficult to detect, though not always
impossible as demonstrated by Figure 2.11. The physical demands a facility has on
its environment are often key clues as to the exact process taking place within. It
is also possible to track shifts of the employees working at a site, allowing one to
[image:39.612.239.411.388.535.2]become familiar with how many people are working during each shift of the day.
Figure 2.11: A thermal infrared image showing hot underground pipes (bright white lines). Image courtesy of Petrie, 2001.
For most sites the dominant output is the primary function of the facility. But
there are multiple types of of output that can, like input, take several forms. Some
products likely have to be physically taken off site, and it is not always easy to
discern the nature of these products. Some might be waste that is being taken to a
produce any or all of these, and the method in which these products are taken off site will often vary. A site can also have output in the form of a gaseous or liquid plume,
potentially released underground. Many types of facilities have cooling towers or
smoke stacks and it is often of interest to know how often these towers are active
and to what degree.
Once all of these have been collected it is often possible to determine the main
function of a site as well as get an idea as to the size of the site. Size is referring
not to the physical size of the site but the quantity of output and customer base
being serviced. For example, one might be able to determine that a site is in fact
a nuclear power facility and it is responsible for approximately 250,000 homes and
businesses. In the circumstance that the site is not friendly it is unlikely that one would be able to get an intimate look at the input and output of a site. In such a
situation one will have to rely on various remote sensing techniques. Underground
gas and liquid plumes have to end somewhere, and are likely to have some effect
on the environment, while liquids and gases on site can be monitored with spectral
imagery. One could get more information on materials being brought to and from
a facility with trucks by following them on the ground or with UAVs.
2.2.2
Process Identification
After thorough analysis of the buildings and other physical elements of the site it
is important to determine their interrelationships and identify the key process(es)
taking place therein. Even if the main function is known, one will want to analyze every structure and build a flow diagram of the various materials as they travel
through the site, and note the different processes taking place at each location.
It is important to make sure that nothing is missing, and that there are not any
extra buildings or pieces of infrastructure. In order to truly know a site one must
be familiar with the role of every component (Schneider, 2011). This is necessary
because it helps one to determine the alternative processes that could be taking
place. One does not analyze a toy factory because it makes toys, but more to know
being used appropriately.
Say an analyst learns that the facility in Figure 2.10 regularly has rolls of white
paper dropped off and magazines picked up. Logically, one would infer that the
site is actually a printing press (it is actually the Quad Graphics plant in Saratoga
Springs, NY), and identifying the facility with this process provides a lot more
information than Paper → Printing → Magazines. Ink and silicone are applied to
the paper, strong cleaning chemicals are required to clean the ink rollers in between
jobs, and various adhesives are needed for the binding process. It is up to the analyst
to use this information to figure out what types of alternative processes could be
done with these various chemicals and determine the signals that would manifest in
those situations.
2.3
Observable Signals
2.3.1
Data Collection Methods
Once a site has been named, its possible processes determined, and its different
operational modes identified it may now be possible to determine the signals that
will help an analyst differentiate said modes. The observable signals are linked to the
different modalities we are identifying. Subtle differences that help identify varying
amounts of production are clues that might aid one in determining the difference between a chemical production plant that is doing as it claims, or secretly making
chemical weapons. There are certain key pieces of data that can and need to be
observed in order to tie everything together into a single coherent package. An in
depth discussion on specific observables for the Van Lare site used in this study is
included in Chapter 4. What follows here is a discussion on the different methods
by which data can be collected and some examples of the multiple forms of data
that each method can collect. This thesis seeks to describe a generic process with an
extensible architecture so that different forms of data can be incorporated as they
Overhead Imagery
All overhead imagery is, of course, a function of the ground sample distance, or
pixel size, of an image. This project assumes reasonable resolution is available
in all formats in a fully registered, interactive AANEE environment. From basic
overhead RGB imagery it will be possible to detect a large quantity of the desired
information. When first given a new site of interest the first thing almost any analyst
does is look at the panchromatic or RGB imagery to get a feel for the site design and infrastructure. Through this it is possible to get the first estimation of site
operations and to locate key points of interest such as entry and exit points as well
as delivery stations and administrative buildings. Specific to the Van Lare plant it
is possible to determine the number of aeration tanks and settling tanks in use, as
well as construction areas where something is either being repaired or upgraded.
Through hyperspectral image data it is possible to learn much more about the
site of interest. Different materials have different spectral properties and it is often
possible to determine the make-up of the roof and walls of a building. The physical
make-up of a building, as well as its shape as mentioned before, provides information as to the purpose of the building. The visible and short-wave infrared regions of the
spectrum are dominated by reflected radiance, and would need to be collected for
material identification only every time a new building or other construction object
is added to the site (Schott, 2007). Hyperspectral data also allows an analyst to
find gas plumes and determine constituents in ponds or pools (O’Donnell, 2005).
The Van Lare site has several open settling tanks and aeration tanks, as well as
a chemical mixing tank. The final settling tanks are supposed to be mostly clear
but this is not always the case. At times equipment can be broken or chemical and
biological processes may not be taking place in optimal conditions. This can lead to the quality of the effluent water not being as high as normal standards (Bartlett,
2007; Lukas, 2007).
Knowing the relative temperature of various buildings, transformers, and other
infrastructure is essential for noticing the subtle differences between operational
Oblique imagery (like the images available on Bing maps) is useful in bringing the analyst information that is available on the sides of the building but cannot be
detected from the roof. Such incidents occur when a large machine is running on a
lower level and the thermal signature does not reach the upper floors (Schott, 2007;
Pictometry, 2007). Historic imagery could also prove to be quite useful. Old images
can show when a building is being constructed or a new piece of equipment is being
installed. One might see pipes or conduits from building to building or tank to
building. One might see the depth of an excavation before a tank goes in, and then
compare that to the depth of the tank once installed but still not in use or empty
for repairs.
Remote Ground Detection
Through ground based surveillance around the perimeter of a plant additional types
of information can be recorded. Such reconnaissance can yield data in multiple
for-mats. One could obtain ground-based obliques of several buildings and transformers
on the site, in the visible or in infrared.
Physically leaving a person on the ground outside of a plant to record information
is the best way to track the vehicular traffic at a site, however, in a real situation where the site is potentially in hostile territory, such surveillance is not possible. In
order to keep with the idea that this is a proof of concept project and not made
specifically for the Van Lare site it is necessary to consider all scenarios and base
the process off of the most difficult. It is possible, therefore, to imagine a situation
where a sensor is monitoring the entrances into a site. Most sites with any security
have very few points of entrance and exit. A wide angle lens could be used to provide
additional coverage, as shown in Figure 2.12.
Getting a grasp of the vehicular traffic is important for getting a better
under-standing of site operations. Through this, it will be possible to estimate the employee quantity and scheduled shifts. More importantly is tracking the industrial
deliver-ies, pick-ups and drop-offs, that make their way onto the site. An analyst will want
Figure 2.12: Fish-eye view of the entrance to Van Lare.
nature of the visit. Specifically to Van Lare, it is known that wastewater treatment
plants use chemicals to treat the water to kill bacteria and keep the PH balanced. There are also trucks that come to pick up treated sludge, septic companies that
empty their trucks, and restaurants that unload their “scum” - greases and oils that
were used in cooking (Lukas, 2007).
Most large facilities utilize hand radios for employees to maintain communication.
During normal activities there should be an average level of communication that is
necessary to keep the facility running properly. Should a random incident occur,
radio traffic is likely to increase for a brief period of time in order to notify all plant
employees of the situation and what needs to be done to bring it back to normal.
Passive radio receivers are cheap and can be set up outside a facility to monitor such traffic.
Mass Media Intelligence
It is always important to take advantage of people that are doing work for you.
Reporters and journalists have the general responsibility of keeping their eye on the
world and notifying the public about interesting events. Through Internet,
or in the area surrounding a site of interest.
Underground improvements that take place within the city of Rochester are not
things we are going to be able to see through typical surveillance methods. These
activities are taking place a great distance away from our site of interest, so it is
unlikely we would even have a sensor there to detect these changes. These are
important to note, however, as improvements to the storm drainage system or sewer
system have a direct impact on Van Lare operations and were likely initiated by
plant employees or county employees. In the article shown in Figure 2.13 we can
see that there was a large city wide project taking place that eliminated several
small wastewater treatment facilities in the 1990s. This caused significantly more
wastewater to be directed to the Van Lare treatment plant. The facility had to put in the large settling tanks, shown later in Figure 3.9(b), to prepare for the increase
in volume.
Figure 2.13: An example of mass media intelligence. The article is available at http://www.monroecounty.gov/des-index.php.
Several other events are likely to take place on or around a facility, some of which
may be relevant to the site, but many that are not. For example, anytime there is a smell complaint made by residents near Van Lare a full report has to be made
and documented by county officials (Lukas, 2007). When a wastewater treatment
plant is running properly there should not be any odor (Bartlett, 2007). Obviously
going according to the standard operating procedure. One would have to look at the time delay that occurs from the actual incident to the time when the actual report is
being made in order to determine the cause. There are several possible explanations
for odor to become a problem to the residents. A malfunction in the air purifiers
that are used to remove the odor from the air or too much volume and an inability to
provide everything with the necessary treatments, for example. A specific incident
that was described by a plant employee was determined to be caused by high winds.
Other documented events that may have an effect on a plant are criminal
activ-ities in the area. Muggings, murders, robberies, and vehicular accidents are news
worthy events that could potentially influence the activities or operations at
vari-ous sites of interest, so these occurrences should be noted, should they happen, for completeness of the project. A vehicular accident involving an industrial vehicle en
route to or from a plant is likely the most relevant event to potentially take place,
but it would have to be a catastrophic event in order for it to have any real impact
on the plant.
Some industrial facilities are dependent on the weather, and this is likely the
most important and influential piece of information from mass media intelligence
for Van Lare. While Van Lare is in a relatively stable weather area and only affected
by rain and snow, other facilities might have to compete with violent thunderstorms,
tornados, hurricanes, or earthquakes. These events can lead to shut downs, spills, or even explosions. An analyst may be monitoring a plant simply to see if it is capable
of standing up to such a catastrophic event.
On Site Measurements
While on site measurements do not qualify as remote sensing they do provide
valu-able information used in process identification. These can be obtained in the event
that UN investigators or some other regulatory organization were ever to investigate a site of interest or by taking measurements from a similar site. There are finite
methods available to obtain an end product given the ingredients. For example, to
treat-ment plants in Geneseo, NY and Cazenovia, NY. While Van Lare is significantly larger than the other two, the inputs, processes, and outputs are the same. Van Lare
does take a few extra steps but this is likely due to the inability of the processes to
scale up to the level needed at this plant (Bartlett, 2007; Lukas, 2007).
Other measurements that might prove to be useful are measurements of
prod-ucts as they traverse through a site. It could prove useful to have concentration
information of the different ingredients at each stage of production to get a good
estimation of how much of each chemical is used and see if this correlates correctly
with how often they receive a delivery. As with Van Lare, biological concentrations
may also prove useful to know.
A collection of some of the different signal types and the data they can collect is available in Table 2.4. All of these could combine to give a detailed description of a
facility, as well as determine all of its functions and operational modes. Fortunately
there are several pieces that overlap, as it is highly unlikely that one would have
access to all of these modalities at one time. For example, major environmental
incidents such as a contaminant found in some nearby water source would likely
be found with some spectral imager as well as reported in some form of media.
Unfortunately the only way to verify everything taking place within a sealed building
is to have an on-site measurement team. Such things are rarely allowed in most
areas of the world, but analysis of a surrogate site could also yield promising results. Employee and facility records may be altered at a nefarious site, but if one can
locate where or when the documentation has been altered it could help in determine
exactly what a site is trying to hide (e.g., a high level of operation during a time
when records indicate limited activity).
2.3.2
Obtaining Real Data
One needs to determine exactly what it is one is looking for and identify the
observ-able signals that can aide in obtaining this information. A person can then determine
which sensor can be used to record the necessary signals. From there it becomes
Table 2.1: A collection of the possible overhead imagery data types and examples of what they could be used to detect at an industrial site.
Overhead Imagery
RGB
Perimeter identification and status Infrastructure identification
Infrastructure on/off Number of vehicles
VNIR Calm vs. turbid water
Thermal Power usage
Heat sources
Spectral
Gas plume detection and identification Material identification
Constituent retrieval from liquids
Table 2.2: A collection of the possible remote ground detection data types and examples of what they could be used to detect at an industrial site.
Remote Ground Detection
Oblique Thermal Power usage
Active pumps
Passive RF Communication monitoring
Number of motors in operation
RGB Imports and exports
Perimeter security
Spectral
Gas plume detection and identification Material identification
Table 2.3: A collection of the possible mass media intelligence data types and examples of what they could be used to detect at an industrial site.
Mass Media Intelligence
TV, Radio, or Internet News
Environmental reports Increased crime
Major incidents New infrastructure
Public Records Budget items
List of employees (government)
Weather Rain, wind, and temperature measurements
Major incidents
Table 2.4: A collection of the possible on site measurements and examples of what they could be used to detect at an industrial site.
On Site Measurements
Infrastructure Inspection Check for minor leaks
Verify infrastructure relationships Collect samples
Facility Records
List of employees Accounting
Pick-ups and deliveries Other recorded information
Physical Properties Material quantities
the signal and what it means. All of the items shown in Table 2.4 are quantifiable and will have a range, a mean value, and a variance. One can gather the signals
from a collection of these items together as observation vectors. As vectors they
can be computationally analyzed and used to aid analysts in drawing conclusions
about a site of interest. Some things, such as t