Published by Maney Publishing (c) IOM Communications Ltd
of the grid after deformation was analysed, and the in-plane component of the plastic strain
calculated and compared with the numerical results obtained through finite element modelling of
the test. In a comparison between experimental data and the results of a finite element (FE) model
of the test that assumed perfect tool alignment, the fields of temperature agreed very well, while
that for the in-plane component of strain was reasonable but inaccurate. However, significant
misalignment of the tools was found in the experiments (a common occurrence in plane strain
compression testing). When comparison was made with an FE model that included the geometry
of the tool misalignment, the agreement was excellent. The paper discusses these effects and
others such as the influence of 3D effects in the modelling.
Keywords:Grid, Insert, Plane strain compression, Aluminium alloy, AA5182, Finite element
Introduction
The rolling process always results in a very hetero-geneous deformation across the thickness of the slab, which in turn implies the development of a gradient of deformation textures.1 This heterogeneity of deforma-tion and texture affects the final rolled sheet leading to well known industrial problems such as earing. To help overcome these issues, the rolling process has been the subject of many studies over the past years, focusing on microstructural evolution and modelling. However, these studies are problematic owing to the fact that during rolling the material is locally affected by a range of temperatures, strains and strain rates that are difficult to simulate in a controlled way. For this reason, plane strain compression tests are commonly used to represent the material behaviour in thermomechanical processes such as hot rolling. In a modern compression testing machine, important parameters such as the imposed strain, strain rate and temperature can be controlled to preset values or functions. The output in terms of nominal stress–strain values, usually at preset values of strain rate and temperature, provides a definite descrip-tion of the behaviour of the material unencumbered by the complexity of what happens to it in the rolling mill.
In this context, it is important to evaluate the temperature and the deformation along the centre plane of the specimen, which is the area used for texture and microstructural studies. It is also important to establish the degree of confidence associated with the use of finite element models to predict such quantities.
Although the gross mechanics of the plane strain compression (PSC) test appear to be rather simple, the material deforms inhomogeneously, the details depend-ing upon external parameters such as the quality of tool lubrication and the material deformation characteristics themselves.2 Metallurgical studies require that a small sample is taken from a part of the deformed test specimen where deformation is fairly uniform so allowing the correlation between the observed metallur-gical changes and the local mechanical state. Typically, after a compression test has been performed, a small specimen (usually 10610 mm) is cut from the middle of the sample and used for texture and microstructure studies. The analysis of this specimen requires the values of the components of the strain as input, and these values are usually considered constant and equal to the applied ones. This assumption does not take into account the whole field values of the strain and the possible variations within the deformed area. Mirza and Sellars3,4 observed an inhomogeneous strain field after modelling hot PSC tests of stainless steel and alumi-nium, and showed that the heterogeneity of deformation is affected by the initial geometry of the specimen but is independent of the type of material and strain rate. In
IMMPETUS, Department of Mechanical Engineering, The University of Sheffield, Mappin Street, Sheffield S1 3JD, UK
Published by Maney Publishing (c) IOM Communications Ltd
this scenario, it is essential to validate the local values of strain obtained through finite element (FE) modelling and investigate the effects of common experimental problems such as tool misalignment that affect the distribution of the strain.
Owing to the physical conditions associated with the compression test (high temperature, large deformation and high strain rate), it is not possible to employ traditional methods of measurement. In some cases, an embedded pin has been used to reveal deformation in rolling.5,6 The disadvantages of this technique are the detachment between pin and material and the limited area where the deformation can be measured. Grids have been used to measure the deformation in hot rolling7and cold extrusion8 and in general to calculate large strains during compression at room temperature.9 Timothyet al.7used an engraved insert embedded in a sample in a rolling experiment and the grid survived large deformation. If an insert is used, it is essential that the insert does not detach from the specimen during deformation since in that case, the grid would not be representative of the deformation of a sample without insert. Moreover, the grid has to be strong enough to survive high pressure, large deformation and oxidation at high temperatures.
In the present work, a gridded insert was used with the engraved surface facing the centre plane of the specimen. The components of the logarithmic plastic strain were calculated by analysing the grid after deformation and were compared with the results from FE models.
Experimental
The tests were performed on a Servotest thermomecha-nical compression machine which is capable of produ-cing temperatures of up to 1100uC and strain rates of up to 100 s21.
Four identical samples were centrally slotted in order to embed the 30 mm long insert (Fig. 1 top). One face of the insert was polished to 1mm finish and engraved with a regular 161 mm grid pitch using a height gauge equipped with a carbide tipped scriber. The average depth of the grooves was measured with a mechanical profilometer resulting in 50mm on average while the average width of the grooves composing the grid was 0.2 mm. The insert and slot were machined so that a transition fit was achieved. The gridded face of the insert was located on the centre plane of the specimen. To avoid damage to the grid when assembling the sample, the workpiece was first warmed up in order to allow the cold insert to slide in easily.
Two slots were machined on the sides of the samples to accommodate the holders of the compression machine. Two of the samples gave similar results whereas the remaining two could not be considered because the grid did not survive the test.
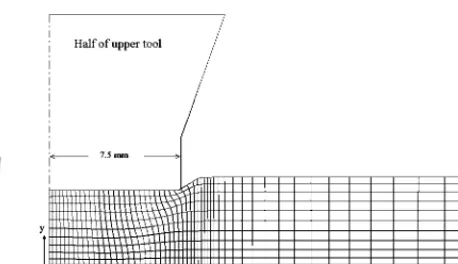
The temperature was measured during the test by means of a type K thermocouple inserted in a hole accurately drilled so that when fully inserted, the thermocouple head was very close to the centre plane of the specimen. It is important that the hole for the thermocouple does not reach the gridded surface of the insert as shown in Fig. 2.
Failure to do so would cause damage to the grid owing to extrusion of material from the insert towards the hole. It was observed in early tests that the resulting grid could be damaged in the central area which is the most significant for the purpose of the present work. The thermocouple was put in place and secured by punching the immediate surrounding of the hole in order to avoid any loss of contact between the head of the thermo-couple and the material during the test.
The aluminium alloy used for the present work (Table 1) was a commercial alloy with a high percentage of magnesium. The specimens were machined from a billet that had been produced through a complex industrial rolling process.
1 a view of sample with gridded insert in which insert was hand engraved with 161 mm grid pitch and ther-mocouple was used to record temperature throughout test and b schematic diagram of tools and sample in plane strain compression test
Published by Maney Publishing (c) IOM Communications Ltd
The sample was heated up to 400uC following the temperature–time curve in Fig. 3, then held at 400uC for 60 s and eventually compressed at a strain rate of 0.7 s21and a reduction ratio of 20% (that corresponds to an applied plastic strain ofy0.22).
[image:3.595.290.517.48.195.2]The compression itself was performed by the upper tool of the machine while the lower tool was stationary. The temperature of both tools was the same as the sample. Graphite powder was used to lubricate the sample/tool interface.
Figure 4 shows one of the samples after deformation. As can be seen, there was no detachment between insert and workpiece in both transverse and longitudinal directions. Moreover, the face of the sample in contact with the grids was found to have grids in relief showing further evidence of close contact.
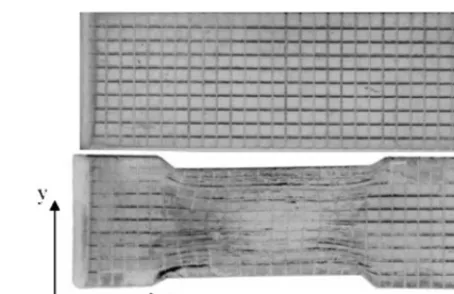
[image:3.595.41.270.50.241.2]After being cooled down with compressed air, the specimen was carefully cut and the insert was extracted. Figure 5 shows the undeformed and deformed grids. The grid survived the test and the engraved lines can clearly be seen.
The components of the logarithmic strain were calculated by relating the coordinates of the vertices of each deformed element of the grid with the original square element. This was achieved with the aid of a
Matlab script10 which allowed automatic extraction of the coordinates from a scanned image of the deformed grid. Automatic recognition of the coordinates of the intersections was not possible, given the difficulty of adjusting the brightness and contrast of the picture on the whole insert. For this reason, manual plotting with the computer mouse was finally chosen as the method for coordinate extraction. An assessment of the accuracy of this technique led to acceptable relative errors of up to 2.4% (Ref. 10).
Finite element model
By making use of symmetry conditions, one need model only a quarter of the sample. The model adequately simulated the real situation of both sample and insert for a total ofy13 200 nodes (Fig. 6). The mesh was built using elements suitable for coupled thermomechanical analysis. The simulation took 19 h CPU time on a Pentium IV 3.2 GHz processor equipped with 1 GB RAM memory. Owing to the tools being at the same temperature as the sample, little heat exchange was expected. Hence, the tools were not meshed and were considered as rigid bodies.
The finite element code used for the present work (ABAQUS/Standard 6.4) is an implicit commercial code that employs a standard Coulomb friction algorithm to model contact interactions, assuming that no relative motion occurs between the two surfaces if the shear
Table 1 Composition of 5182 aluminium alloy, wt-%
Al Mg Fe Zn Si Mn Cu Cr Ti
93.2–95.8 4–5 Max. 0.35 Max. 0.25 Max. 0.2 0.2–0.5 Max. 0.15 Max. 0.1 Max. 0.1
3 Temperature recorded by thermocouple during test: compression itself lasted,1 s
4 Overview of sample after compression test (left) and top view of sample (right): no detachment was observed between insert and workpiece in both transverse and longitudinal directions
[image:3.595.98.460.557.668.2]Published by Maney Publishing (c) IOM Communications Ltd
stress across their interface is less than the critical stress defined as
tcr~mP (1)
wheremis the coefficient of friction and P the contact pressure. The coefficient of friction between tools and sample (graphite lubricated) was measured by means of a Bowden and Leben type friction rig made available by the Tribology Group of the University of Sheffield. The resulting coefficient of friction was 0.1, a value that has been used in other studies when modelling contact between aluminium and steel in compression tests when graphite is used as a lubricant.3 The unlubricated contact between insert and workpiece was modelled using a coefficient of friction of 0.5 in agreement with the current literature with reference to aluminium to aluminium dry contact.11
Material
The material behaviour was modelled using an inverse hyperbolic sine function (fin equation (2)), with para-meters fitted to stress/strain data obtained through hot plane strain compression tests.12,13 This relationship models a viscoplastic behaviour linking the flow stress with temperature, strain and strain rate
s~f(e,e:,T) (2)
In this numerical model, the fraction of plastic work per unit volume dissipated as heat was assumed to be 95 (Ref. 14) and 50% of the heat generated by friction was absorbed by the sample.
Constant strain rate and tool velocity
During a plane strain compression test with constant strain rate, the tool moves according to equation (3). In other words, at any given instant, the ratio between the linear velocity of the toolvand the remaining thickness of the sample h has to be constant and equal to the applied strain rate
: e~v
h (3)
A Fortran program was written to feed ABAQUS with the correct velocity values during the compression.
2D and 3D models
A two-dimensional (2D) model was also built supposing plane strain conditions on the centre plane of the
sample. This condition implies that no deformation is expected along z direction on the centre plane of the sample. The aim of this model was to investigate whether a less demanding 2D model could be used instead of a three-dimensional (3D) one to predict the strain components without loss of accuracy. Figure 7 shows the 2D geometry: symmetry conditions were used to model only a quarter of the whole geometry.
Results
[image:4.595.288.517.47.179.2]The temperature rise due to plastic deformation was measured during the test and compared with the numerical results extracted from an element at the same position as the head of the thermocouple. The experi-mental and numerical temperature profiles are shown in Fig. 8. No significant difference was found between the 2D and 3D temperature profiles.
[image:4.595.289.517.589.747.2]The 3D numerical model allowed the evaluation of the gap (contact opening) between insert and workpiece. Figure 9 shows the amount of opening on the contact surface in the form of a contour plot. As can be seen, the maximum gap between insert and workpiece was 0.27 mm in a small area close to the surface. The gap occurred in an area where the tools were not in touch with the sample, suggesting that the friction between tool and sample/insert contributed to preventing detach-ment along the transverse direction. This phenomenon led to sticking contact conditions in the area where the strain was measured.
The components of the logarithmic plastic strain were extracted from the 2D finite element models and compared with the measured ones. Figure 10 shows a
metry, only a quarter of full geometry was modelled 6 Three-dimensional geometry and mesh: mesh is
refined in insert and close to contact area; only quar-ter of geometry was modelled; tool is not shown
Published by Maney Publishing (c) IOM Communications Ltd
comparison between finite element and experimental contour plots of the three components of the logarithmic plastic strain.
The comparison in Fig. 10 has been obtained by considering a model with no misalignment of the tools during the test. In fact, misalignment is common in a compression test: in the case of the insert where the data in Fig. 10 was extracted, an offset of y1 mm was measured between the two tools, the upper tools being shifted towards the right. Figure 11 shows that by considering a model with realistic amount of misalign-ment, the match between numerical and experimental plots improves considerably. A very similar deformation
9 Contact opening between workpiece and insert on cen-tre plane
10 Numerical (left) and experimental (right) contour plots of components of logarithmic plastic strain: numerical values were obtained assuming perfect alignment between tools
Published by Maney Publishing (c) IOM Communications Ltd
field was observed considering a slight rotation of the upper tool.
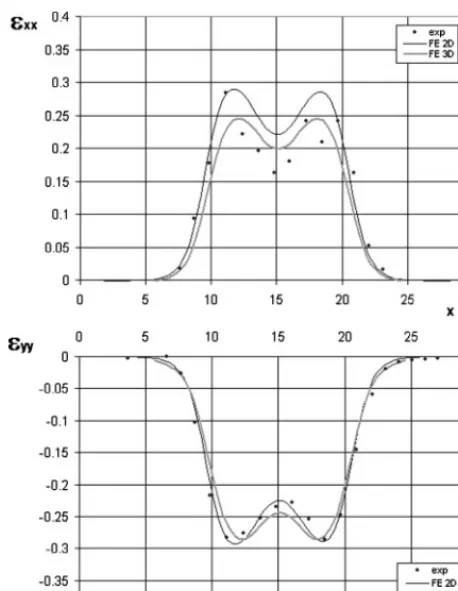
The elements on the centreline of the insert were analysed separately in order to highlight the differences between 2D and 3D models (Fig. 12). The 2D and 3D plastic strains were both extracted from the centroid of the elements. A difference of 15% was found between the maximum values of the xx components whereas ,8% difference was found for the yy component in this particular area of the insert.
This difference can be explained by considering Fig. 13 where the zz component of the plastic strain is shown after being extracted from the 3D model. The strain along thezdirection reaches a maximum where the maximum difference between 2D and 3D is observed. This suggested that the plane strain condition for this geometry was not fully achieved on the centre plane.
Discussion
The observed lack of detachment, confirmed by the numerical model, proved that close contact was achieved between insert and workpiece during the test. Moreover, the fact that a grid was found on the surface of the slot facing the gridded face of the insert was further evidence of negligible relative motion between insert and work-piece. Other engraving techniques, such as photoetching, are being considered in order to reduce the width of the grid. Nevertheless, the necessity for thinner gridlines must take into account the need for a strong grid capable of undergoing large deformations at high temperatures.
Accurate prediction of the deformation in the central area of the sample implies that the components of the
strain obtained by FE modelling can be used in microstructural studies with confidence. This is important when dealing with texture studies since differences between measured and predicted textures can be attrib-uted to the texture model itself rather than to the input data. To address this issue, the FE model used in the present work was checked against the experimental data. The measured components of the logarithmic plastic strain were found to be in good agreement with the numerical values when considering a slight misalignment of the tools. However, owing to the relatively large grid pitch, the measurement of the strain was more accurate in the central area of the insert rather than closer to the tools where steep gradients of deformation were found. This issue could be overcome by using different techniques that allow the creation of a grid with a smaller pitch such as microlithography techniques.15
As can be seen in Figs 10 and 12, the deformation was not uniform along the centreline of the insert and the maximum deformation was not achieved at half the length of the insert buty3 mm away on both sides. This non-uniformity of the strain translates into a substantial difference between the applied strain (0.22) and the local strain in the proximity of the centre of the insert. If the centreline is considered, this leads to variation of the computed exxof up to 20% within a distance of 3 mm from the centre.
The measured temperature profile was very close to the predicted one. This is very important considering that the flow stress is directly linked to the temperature and the code selects a particular value of the stress– strain curve at any time depending on the current temperature according to equation (2).
The comparison between the 2D and 3D models on the centreline showed that the 3D model was slightly more accurate than the 2D one in predicting the strain. The presence of some deformation along the transverse direction suggested that the plane strain assumption in the 2D model is not fully valid but can still be accepted depending on the desired accuracy. Moreover, a wider sample would probably assure plane strain conditions on the centre plane.
Conclusions
An insert with an engraved grid was used to measure the deformation in a plane strain compression test. The grid
12 Comparison between components of logarithmic plas-tic strain calculated by code (2D and 3D model with aligned tools) and measured on insert (dots) for a row of elements along centreline
[image:6.595.42.271.48.344.2]Published by Maney Publishing (c) IOM Communications Ltd
and plotted for the whole centre plane of the insert, showing a non-uniform distribution and considerable variation of the deformation in the central area of the insert, with values of the strain significantly different from the applied strain.
Acknowledgements
The authors are grateful to the UK Engineering and Physical Sciences Research Council for financial support with grant number GR/S04956/01. The authors would also like to thank Mr R. Mills, Mr A. Zorcolo and Dr M. Marshall (Tribology Group, The University of Sheffield) for the experimental support.
Technol., 1991,7, 255–261.
8. J. Monaghan:J. Mater. Process. Technol., 1998,77, 305–313. 9. H. T. Goldrein, S. J. P. Palmer and J. M. Huntley:Opt. Lasers
Eng., 1995,23, (5), 305–318.
10. C. Boldetti, C. Pinna, I. C. Howard and G. Gutierrez: Proc. Int. Conf. on ‘Advances in experimental mechanics’, 111–116; 2005, Aedermannsdorf, Trans Tech Publications.
11. I. V. Kragelsky and V. V. Alisin: ‘Tribology - lubrication, friction and wear’; 2001, London, Professional Engineering Publishing. 12. H. Shi, A. J. Sellars, R. Shahani and R. Bolingbrode:Mater. Sci.
Technol., 1997,13, 210–216.
13. J. Talamantes-Silva, J. H. Beynon and C. Pinna:Aluminium, 2002,
78, 10.
14. E. M. Mielnik: ‘Metalworking science and engineering’; 1991, New York, McGraw-Hill