Optical-coherence tomography, extension to imaging of
low coherence interferometry
Adrian Gh. Podoleanu
a, Radu G. Cucu
a, John. A. Rogers
b, Justin Pedro
b,
George Dobre
a, Marta Gomez
a, Haida Liang
c, Ben T. Amaechi
d, Susan Higham
ea
Applied Optics Group, School of Physical Sciences, University of Kent, Canterbury,
CT2 7NH, United Kingdom
b
Ophthalmic Technologies Inc., Toronto, M3J 3E5, Canada
c
School of Biomedical and Natural Sciences, Nottingham Trent University, Clifton Lane,
Nottingham NG11 8NS, UK
d
Cariology Group, Department of Community Dentistry, University of Texas Health Sciences
Center at San Antonio, San Antonio, TX 78229, USA
e
Cariology Group, Department of Clinical Dental Sciences, University of Liverpool, Liverpool, UK
ABSTRACT
Results are presented in using low coherence interferometry in quantifying the reflectivity and imaging of different objects, such as tissue, paintings and fruits. All images have been obtained using en-face flying spot technology. This allows simultaneous generation of optical coherence tomography and confocal scanning images.
Keywords: Keywords: low coherence interferometry, en-face optical coherence tomography, confocal microscopy, tissue imaging
1. INTRODUCTION
Optical-coherence tomography (OCT) is a non-invasive high-resolution imaging modality which employs non-ionising optical radiation. OCT derives from low-coherence interferometry. This is an absolute measurement technique which was developed for high- resolution ranging and characterisation of optoelectronic components1. The first application of low-coherence interferometry in the biomedical optics field was for the measurement of eye length2. Adding lateral scanning to a low-coherence interferometer, allows depth resolved acquisition of 3D information from the volume of biologic material3. The concept was initially employed in heterodyne scanning microscopy. OCT has the potential of achieving high-depth resolution, which is determined by the coherence length of the source. Optical sources are now available with coherence lengths below 1 µm. When combined with confocal microscopy, OCT adds improved depth resolution and sensitivity.
Using sources with extremely short coherence length4, submicron depth resolution is achievable even when the microscope objective is far away from the investigated target. This is one of the most important features of OCT which explains the high level of interest for OCT in ophthalmology. Confocal imaging was initially applied for high resolution imaging of the eye. In confocal microscopy, the depth resolution is inverse proportional to the square of the numerical aperture of the microscope objective. Because the retina is 2 cm away from the eye lens, which takes the role of the microscope objective, for a non dilated pupil size the numerical aperture is below 0.1. Therefore, the depth resolution in imaging the retina with confocal laser scanning ophthalmoscopy is limited by the combined effect of a low numerical aperture and aberrations of the anterior chamber, to values larger than 0.3 mm. Using OCT however, a depth resolution better than 3 µm is achievable when imaging the retina. OCT does not require contact, in contrast to confocal microscopy which does.
Correspondence to: A. Podoleanu, [email protected]
In terms of the product between the depth resolution and penetration depth, OCT fills the gap between confocal microscopy and ultrasound imaging. This product is approximately (0.1 µm x 500 µm) in confocal microscopy, (1 µm x 3000µm) in OCT and (50 µm x 5000 µm) in high frequency ultrasound.
2. MAIN CHARACTERISTICS OF OCT
1. OCT uses wavelengths within the band 600 nm to 2000 nm where the main constituents of the tissue, water, pigments, etc exhibit low absorption.
2. The main driving force behind OCT development is its high depth resolution. The wider the optical spectrum line-width, the smaller the coherence length and the better the depth resolution.
3. For interference to take place, a strict phase relation is required between the interfering waves. Multiple scattered events lose the phase information. Therefore, only single scattered photons contribute to the interference. Consequently, the maximum penetration depth in OCT is given by the depth wherefrom single scattered photons still originate. This depth is about 1.5 mm in skin using wavelengths within the 800 nm band and about 2 mm when using 1300 nm due to lower scattering at longer wavelengths.
4. Photodetection at the interferometer output involves multiplication of the two optical waves, therefore the weak signal in the object arm, backscattered or transmitted through the tissue is amplified by the strong signal in the reference arm. This explains the higher sensitivity of OCT when compared with confocal microscopy, which for instance in skin can produce images only to a depth of 0.5 mm.
5. Since all OCT system are built around a confocal microscope, the transverse resolution is determined by diffraction.
To obtain 3D information about an object, the imaging system is equipped with two scanning means; one to scan the object in depth and another to scan the object transversally, usually composed of two orthogonal scanners. Depending on the order in which these scans are operated and on the scanning direction associated with the line displayed in the raster of the final image delivered, different scan planes are possible. OCT systems, using CCD cameras or arrays of sensors or arrays of emitters eliminate the need of scanning. In Kent, we prefer to use what is called, T-scanning, which are transversal reflectivity profiles. These can be used to generate both cross sections as well asen-face images like in microscopy.
3. THE EXPERIMENTAL CONFIGURATION
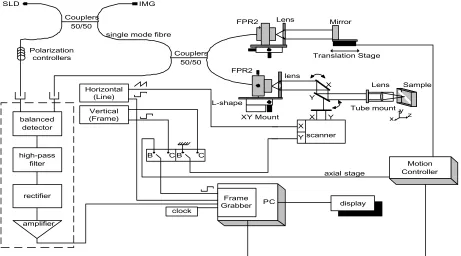
The optical configuration5 uses two single mode directional couplers with a superluminiscent diode as the source. The scanning procedure is similar to that used in any confocal microscope, where the fast scanning is en-face (line rate) and the depth scanning is much slower (at the frame rate)6. The en-face scans provide an instant comparison to the familiar sight provided by direct view or via a conventional microscope7. Features seen with the naked eye could easily be compared with features hidden in depth. Sequential and rapid switching between the en-face regime and the cross-section regime, specific for the en-face OCT systems developed by us, represents a significant advantage in the non-invasive imaging. Images with different orientations can be obtained using the same system. As shown in Fig.1, in the
en-face regime, the frame grabber is controlled by signals from the generators driving the X-scanner and the Y-scanner. One galvo-scanner is driven with a ramp at 500 Hz and the other galvo-scanner with a ramp at 2 Hz. In this way, an
en-face image, in the plane (x,y) is generated at constant depth. The next en-face image at a new depth is then generated by moving the translation stage in the reference arm of the interferometer and repeating the (x,y) scan. Ideally, the depth interval between successive frames should be much smaller than the system resolution in depth and the depth change applied only after the entire en-face image has been collected. However, in practice, to speed up the acquisition, the translation stage was moved continuously. Alternatively, a scanning delay line could be used, which can achive faster depth scanning rates8. In the images presented below, no other phase modulation was employed apart from that introduced by the X-galvanometer scanner9. In Podoleanu et al10, we demonstrated the role played by the image size in balancing the effects of an external phase modulator and of the modulation produced by the transversal scanner. If the image is sufficient large, then the distortions introduced by not using a phase modulator are insignificant.
4. THEORY
From the interference theory, the photodetected signal for a particular wavelength, λ, in the spectrum of the optical source is:
⎥⎦
⎤
⎢⎣
⎡
λ
π
Π
+
+
α
=
O
R
2
OR
cos(
2
d
)
4
P
i
ph 0(1)
where α is the photodetector responsivity, O the target reflectivity, R the reference mirror reflectivity and P0 the power
incident on the object. The optical path difference (OPD) between the two optical paths in the two arms is d = |lr– lo|,
where lr is the length of the reference arm and lo the length of the object arm. The interference amplitude depends also
on the degree of polarisation, described by the factor Π?i.e. the degree of similarity of the orientation of the electric fields in the two optical beams.
The first two terms represent time non-varying components and determine noise, usually O<<R. The third term describes the interference; this is periodic and depends on the optical path difference (OPD) and wavelength, λ. Each time the reference mirror is moved by an extra λ/2 (which determines a round trip OPD of λ), the photodetected signal strength repeats itself. Hence, maxima and minima are recorded as the reference mirror is moved.
If the optical source is purely monochromatic (an ideal laser source), its spectrum is reduced to a narrow component of a well defined wavelength. In this case, equation (1) represents a fringe signal, with an infinite number of peaks as the OPD is changed. Such system cannot be used for depth selection. However, if the optical spectrum contains a spread of components, ∆λ, then configurations such as presented in Fig. 1 can select in depth. This arises from the fact that equation (1) has to be superposed for each wavelength within the source spectrum range ∆λ. This superposition essentially involves the cosine terms and will lead to cancellation of the signal at the photodetector for most OPD values. Clearly however, for an OPD = 0 most wavelengths will superpose constructively giving a signal at the
Couplers 50/50
IMG
Couplers 50/50 single mode fibre
balanced detector high-pass filter rectifier amplifier Y scanner X Y Translation Stage Mirror Motion Controller PCFrame Grabber display clock Horizontal (Line) Vertical (Frame)
B CB C
X Y
axial stage
X Lens Sample lens
XY Mount FPR2
L-shape
[image:3.612.77.538.233.489.2]Tube mount y x z Lens FPR2 Polarization controllers SLD
D111!11 tiflG luncrion
DGUt11G-G11111JG
n4 brupJGuqi mm
0 00 (110 OI 00 02 00 02 00
EU WGJ
100111 HLIJ1CG
photodetector. The coherence length lcof the optical source determines the width of the envelope of the fringe pattern
and hence the depth resolution. The coherence length lc and ∆λ, are related by:
l
c=
4
ln
2
2π
λ
∆λ
(2)
and thus the larger ∆λ ??the shorter lc and hence the better the OCT depth resolution. For |OPD| > lc, the temporal
extension of the superposed waves must be considered.
OCT imaging technology is based on A-scans or T-scans. A-scans represent axial reflectivity profiles. T-scans represent lateral reflectivity profiles. A-scans are obtained by holding the lateral position fixed while the optical path difference is scanned.
T-scans are obtained with the mechanism of depth scanning fixed while the ray is scanned laterally over the sample object. Irrespective of the case, the 1D scans can be represented as convolution of the reflectivity profiles with a sampling function.
)
z
(
)
z
(
O
)
z
(
P
`
)
z
(
i
ph=
α
0η
⊗
γ
(3)while for T-scans:
)
x
(
)
x
(
O
P
`
)
x
(
i
ph=
α
0⊗
η
(4)whereα’ is a constant which incorporates the photodetector responsivity while
γ
(
z
)
represents the correlation function of the source. This is also the sampling function for A-scan based imaging11.η
(
z
)
andη
(
x
)
represents the axial and respectively the transversal distribution of the confocal microscope point spread function at the core of the interferometer. The functionη
(
x
)
is the sampling function for T-scan based imaging. The volume sampled per pixel issimilar in both cases, and is given by the square of the lateral size sampled from the object via
η
(
x
)
(lateral resolution), [image:4.612.165.417.286.458.2]multiplied by the depth extension selected by
γ
(
z
)
(depth resolution).5. RESULTS
OCT has extensively been used in ophthalmology in imaging both anterior and posterior pole, and is now being extended to different types of tissue. OCT provides depth resolved information of reflectivity, phase, and polarisation of the backscattered signal. This signal is intimately related to functional disturbances, which usually precede morphological changes. No other imaging technology12 can offer non-invasive non-contactin-vivo real time subsurface images with such a high depth resolution.
Using very low optical powers in the infrared, OCT can provide subsurface images with micron resolution. Emphasis is put here on the en-face OCT method, which allows a straightforward comparison with images produced by confocal microscopy13.
We demonstrate here the OCT versatility with images collected from three categories of objects: bovine teeth in vitro, paintings and fruits.
5.1. Teeth in-vitro
Freshly extracted bovine incisor teeth were collected and then processed as described in reference14 . A -scans from teeth are shown in Fig. 2. The B-scan images in Fig. 3 are result of compounding several T-scan images collected at different vertical positions of the frame scanner. Using different prototypes of en-face OCT systems, we demonstrated that it is possible to detect and quantitatively monitor the demineralisation of teeth. While both transversal (Figure 3) and longitudinal (Figure 4) OCT images showed the caries lesion as volumes of reduced reflectivity, the longitudinal images additionally showed the depth of the lesion into the tooth tissue. OCT detected early enamel caries, showed the depth of the caries inside the tooth tissue, and quantitatively demonstrated the degree of demineralisation of the tissue. This method was shown to correlate well with an established method of quantifying demineralisation15.
5.2. Paintings
Cross-sectional images of an 18th century painting are shown in Fig. 5. The upper scan reveals that part of the varnish that has been detached from the painting. The thickness of the varnish near the edge of the detachment as well as its refractive index can be estimated using low coherence reflectometry. The lower scan shows that varnish was applied after the damage which resulted in paint loss. Varnish was applied on the bare canvass on the lower part of the scan while on top of the paint on the upper region of the scan. Not shown here, en-face OCT can be is used to provide high resolution images of the under-drawings and detect small defects in paintings16 .
Sound tooth tissue
Demineralised (Carious) tissue
∆x
∆y
Sound enamel tissue
Demineralised (carious)enamel tissue
∆x
[image:5.612.320.525.355.484.2]∆y
[image:5.612.104.289.355.482.2]Fig. 3. C-scan OCT image at 0.5-mm depth. Lateral size: 5 × 5 mm.
Fig. 4. Longitudinal OCT image from the middle of the transverse image in Fig. 3 showing a caries lesion. ?∆x = 5
5. 3. Fruits
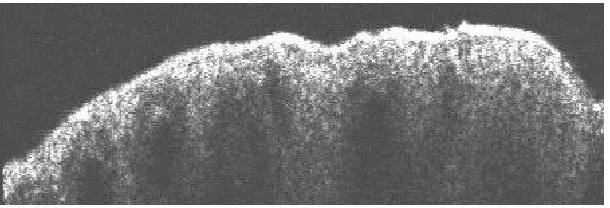
A cross section image through a mandarin is shown in Fig. 6. The skin thickness can be quantified with an accuracy comparable to the coherence length of the optical source in the sample, i.e., approx. 10 µm. The shape and density of pockets inside the fruit are clearly visible.
CONCLUSIONS
We have shown that low coherence interferometry, in its OCT version, can provide high resolution information on the internal structure of different objects. The present study highlights the potential of OCT for diagnostic, whether for demineralization of teeth, for art conservation or for harvest characterization. A-scans, B and C-scan images can be used separately or in combination to provide 3D information. So far, OCT has been extensively used in ophthalmology in special and in medicine in general. Imaging of paintings and fruits are potential extensions of this high resolution imaging technology outside medicine. All images presented were obtained with superluminiscent optical sources, at wavelengths of 840 nm or 1300 nm, with depth resolutions of better than 15 µm and transverse resolutions determined by the confocal apertures used, better than 20 µm.
ACKNOWLEDGMENTS
[image:6.612.86.472.103.241.2]Marta Gomez acknowledges the support of the Marie Curie training site “Training on optical devices, configurations and techniques applied in biomedical optics”, sponsored by the European Commission 00349 grant in the University of Kent. A. Podoleanu acknowledges the Leverhulme Trust for a research fellowship.
Fig. 5. Left: An 18th century panel painting; Top-Right: OCT cross-section image along the top line-segment marked on the painting; Bottom-Right: OCT cross-section image along the lower line-segment on the painting. The B-scan images are of 10 mm lateral and 2 mm in depth measured in air.
[image:6.612.151.456.381.485.2]REFERENCES
1. S. A. Al-Chalabi, B. Culshaw, D. E. N. Davies. Partially coherent sources in interferometric sensors. First Internat. Conf. Optical Fibre Sensors 26-28 April 1983, I.E.E. London, 132-135.
2. S. A. Al-Chalabi, B. Culshaw, D. E. N. Davies. Partially coherent sources in interferometric sensors. First Internat. Conf. Optical Fibre Sensors 26-28 April 1983, I.E.E. London, 132-135.
3. D. Huang, E. A. Swanson, C. P. Lin, J. S. Schuman et al. Optical coherence tomography, Science 1991 254:1178-1181.
4. W. Drexler, U. Morgner, R. K. Ghanta, F. X. Kartner, J. S. Schuman, J. G. Fujimoto, “Ultrahigh-resolution ophthalmic optical coherence tomography”, Nature Medicine, 7, 502-507 (2001).
5. A. Gh. Podoleanu, J. A. Rogers, D. A. Jackson, S. Dunne “Three dimensional OCT images from retina and skin” Opt. Express, Vol. 7, No. 9, p. 292-298, (2000), http://www.opticsexpress.org/framestocv7n9.htm..
6 . B. R. Masters, “Three-dimensional confocal microscopy of the human optic nerve in vivo,” Opt. Express, 3, 356-359 (1998), http://epubs.osa.org/oearchive/source/6295.htm
7. J. A. Izatt, M. R. Hee, G. M. Owen, E. A. Swanson, and J. G. Fujimoto, "Optical coherence microscopy in scattering media," Opt. Lett. 19, 590-593 (1994)
8. C. C. Rosa, J. Rogers, and A. G. Podoleanu, "Fast scanning transmissive delay line for optical coherence tomography," Opt. Lett. 30, 3263-3265 (2005),
9. A. Gh.P odoleanu, G. M. Dobre, D. J. Webb, D. A. Jackson, “Coherence imaging by use of a Newton rings sampling function”, Optics Letters, 21(21), 1789, 1996.
10. A. Gh. Podoleanu, M. Seeger, G. M. Dobre, D. J. Webb, D. A. Jackson and F. Fitzke “Transversal and longitudinal images from the retina of the living eye using low coherence reflectometry,” Journal of Biomedical Optics, 3, 12, 1998
11. Y. Pan, R. Birngruber and R. Engelhardt, Contrats limit of coherence gated imaging in scattering media, Appl. Optics, 1997, 36:13, 2979-2983.
12. A.Gh. Podoleanu, Optical coherence tomography, British Journal of Radiology, 2005, Invited review article, British J Radiol.2005; 78: 976-988.
13. A.Gh.Podoleanu, G. M. Dobre, R. G. Cucu, R. Rosen, Sequential OCT and Confocal Imaging, Opt. Letters, 29 (4): 364-366 Feb. 15 2004.
14. B. T. Amaechi, A. Gh. Podoleanu, S.M. Higham, D. Jackson, Correlation of Quantitative Light-induced Fluorescence and Optical Coherence Tomography Applied for Detection and Quantification of Early Dental Caries, Journal Biomedical Optics, 8(4); 642-647; 2003.
15. B. Amaechi, A. Podoleanu, G. Komarov, J. Rogers, S. Higham, D. Jackson, Application of Optical Coherence Tomography for imaging and assessment of early dental caries lesions, Laser Physics, Special Issue No.2, Laser Methods in Medicine and Biology, Vol. 13, No. 5,703-710, May 2003.