P
ROTEOMIC AND
TRANSCRIPTOMIC ANALYSIS
OF THE PROTOZOAN PARASITE
N
EOSPORA CANINUM
Thesis submitted in accordance with the requirements of the
University of Liverpool for the degree of Doctor in Philosophy
by Sarah J Vermont
A
UTHOR
’
S DECLARATION
Apart from help and advice acknowledged, this thesis represents the unaided
work of the author
...
Sarah J Vermont
A
CKNOWLEDGEMENTS
First and foremost, I would like to thank my supervisors, Professor Jonathan Wastling and Dr. Andy Jones, not only for accepting me as a student, but for all their expertise, advice and support along the way. They have not been the only people to whom I have turned for help: to everyone (past and present) in Infection Biology; Nadine, Sanya, Beccy, Sophie, Stu, Dong, Andy, Hos, Sarah T, Corrado, Mariwan and Poom; a massive thank you. Similarly, to members of the PFG group and especially Duncan, thank you for your patience and understanding in mass spectrometry assistance! Without Gianluca, Achuchuthan, Kat, Ritesh and the rest of the Bioinformatics group I could never had understood my data. A special thank you is due to Dr. Iain Young, not only for inspiring me to attempt a PhD in the first place, but also for being a fantastic and supportive boss in my three years as a halls tutor.
My PhD has involved collaborations on a number of projects: Professor Arnab Pain, Adam, Peter, Professor Andrew Hemphill, Thierry; thank you all for your involvement and fruitful discussions. To Steffi and Professor Jonathan Howard, thank you for making me welcome in your labs in Cologne and for all your help with the ROP18 work.
Thank you also to the BBSRC and Intervet for providing the funding that allowed me to carry out this work and to the University of Liverpool for 4 more brilliant years.
My partners in crime, Emma and Jenna, along with Alex and Monika, have made studying for my PhD especially enjoyable and entertaining; Maz and Luke have been so generous in letting me invade their home these last few weeks - thank you all.
Proteomic and transcriptomic analysis of the protozoan parasite Neospora caninum Sarah J Vermont
ABSTRACT
Neospora caninum is an economically significant parasitic protozoan causing the disease neosporosis in cattle and dogs. Although a close relative of the zoonotic apicomplexan Toxoplasma gondii, the two organisms exhibit differing host ranges and infection dynamics. T. gondii is a model organism that has been much studied, and a great deal is known about the genes and proteins involved when it invades a host cell. This thesis explores protein expression in the proliferative and invasive tachyzoite stage of N. caninum, in particular the expression of proteins pertaining to the apical complex of organelles; those responsible for entry and establishment within a host cell. Almost 20 % of the predicted proteome has been identified by this analysis to be expressed in the tachyzoite stage, with approximately 50 % of the predicted repertoire of apical proteins being detected.
The discovery of differences between these two parasites’ highly syntenic genomes could lead to a better understanding of the process by which T. gondii is able to cause disease in humans, while N. caninum has not been observed to do so. One finding of the recent genome sequencing and annotation project in N. caninum was that a key T. gondii virulence determinant, rhoptry gene 18 (ROP18) was pseudogenised in N. caninum. This finding was investigated further in this thesis to demonstrate that the pseudogenisation of ROP18 was conserved across a range of N. caninum isolates and that in vitro, N. caninum was not able to subvert the murine interferon-gamma (IFN-γ) immune response using ROP18 in the way that virulent T. gondii tachyzoites do.
The tissue-dwelling Coccidia have a multi-stage life cycle which includes a latent tissue cyst-encapsulated stage called the bradyzoite. Tachyzoites convert to this more quiescent form when induced by cellular stress, and are able to remain as such for long periods, even years. At times of weakened host immunity, bradyzoites can recrudesce to produce an active infection, which can cross the placenta in a pregnant animal to infect the foetus. This a major route by which N. caninum infection is maintained within cattle herds, therefore the biology of stage conversion from tachyzoite to bradyzoite and vice-versa is of interest to researchers. An RNA-Seq analysis of cultured tachyzoites and bradyzoites identified a marked reduction in rhoptry gene expression, and differing expression profiles of other invasion-related genes from the micronemes and dense granules.
C
ONTENTS
List of figures List of tables List of abbreviations
CHAPTER 1:INTRODUCTION
1.1 Neospora caninum 1
1.2 Lifecycle and epidemiology 1
1.3 Economic impact of neosporosis 3
1.4 Host cell invasion and the apical complex 4
1.4.1 Micronemes 6
1.4.2 Rhoptries 7
1.4.3 Dense granules 8
1.5 Neospora and Toxoplasma – similarities and differences 8
1.6 Host immune response and pathology 10
1.7 Proteomics 11
1.7.1 Electrophoresis 11
1.7.2 Reverse-Phase High Performance Liquid Chromatography (LC) 12
1.7.3 Tandem mass spectrometry (MS/MS) 12
1.7.4 Multidimensional protein identification technology (MudPIT) 13 1.7.5 Bioinformatics – Peptide/Protein Identification 13
1.8 Transcriptomics 14
1.8.1 RNA-Seq 14
1.9 Current status of the N. caninum genome, proteome and transcriptome 15
1.10 Aims and objectives 15
CHAPTER 2:AN ANALYSIS OF THE TACHYZOITE PROTEOME
2.1 Introduction 18
2.1.1 Global proteomic analyses on N. caninum and related Apicomplexa 18
2.1.2 Peptide data as an aid to genome annotation 19
2.1.3 Aims and objectives 20
2.2 Materials and methods 21
2.2.1 Cell culture 21
2.2.1.1 Host cell passage 21
2.2.1.2 Parasite passage 21
2.2.1.3 Parasite isolation 21
2.2.2 Proteomic analyses 22
2.2.2.3 One dimensional electrophoresis (1-DE) 22
2.2.2.4 In-gel tryptic digestion 23
2.2.3 Reverse-phase high performance liquid chromatography and tandem
mass spectrometry (LC MS/MS) 23
2.2.4 Multidimensional protein identification technology (MudPIT) 24 2.2.5 Analysis of tachyzoite lysate on an Orbitrap Velos mass spectrometer 25
2.2.5.1 In-solution digestion and analysis 25
2.2.5.2 1-DE and in-gel digestion 25
2.2.5.3 Orbitrap Velos mass spectrometry 26
2.2.6 Protein identification using multiple search engines 26 2.2.7 Assignment of proteins to MIPS Functional Catalogue categories 26
2.2 Results 28
2.3.1 One dimensional gel electrophoresis (1-DE) and mass spectrometry (LC MS/MS) analysis of whole tachyzoite lysate 28 2.3.2 Multidimensional proteomic identification technology (MudPIT)
analysis of whole tachyzoite lysate 30
2.3.3 Analysis of tachyzoite lysate using an Orbitrap Velos mass 32 spectrometer
2.3.3.1 In-solution analysis 32
2.3.3.2 1-DE separation prior to LC MS/MS 33
2.3.4 OFFGEL separation 34
2.4 Discussion 35
CHAPTER 3:BIOINFORMATIC MINING OF THE GENOME FOR PREDICTED APICAL PROTEINS
3.1 Introduction 39
3.1.1 Definitions 39
3.1.2 ToxoDB 39
3.1.3 The Basic Local Alignment Search Tool (BLAST) 40
3.1.4 Aims and objectives 42
3.2 Materials and methods 43
3.2.1 Identification of potential apical genes 43
3.3 Results and discussion 44
3.3.1 Microneme genes 44
3.3.2 Rhoptry genes 49
3.3.3 Dense granule genes 55
3.3.4 Discussion of bioinformatic resources 59
CHAPTER 4:PROTEOMIC ANALYSIS OF THE APICAL ORGANELLES
4.1 Introduction 60
4.1.1 Excretory/secretory antigen (ESA) analysis 60
4.1.2 Rhoptry/dense granule - enriched fraction analysis 62
4.1.3 Aims and objectives 62
4.2 Materials and methods 63
4.2.1 Excretory/secretory antigen analysis 63
4.2.1.1 Preparation of ESA material from parasite cultures 63 4.2.1.2 Tricarboxylic acid (TCA) precipitation of ESA 63 4.2.1.3 One dimensional gel electrophoresis (1-DE) of ESA 63 4.2.2 Rhoptry (R) and rhoptry/dense granule (R/DG) fractions 64 4.2.2.1 Preparation of rhoptry and rhoptry/dense granule fractions 64 4.2.2.2 TCA precipitation of R and R/DG fractions 65
4.2.2.3 1-DE of R and R/DG fractions 65
4.2.3 Trypsin digestion of samples for mass spectrometry 65 4.2.4 Liquid chromatography and tandem mass spectrometry analysis (LC
MS/MS) 66
4.2.5 Bioinformatic Analyses 66
4.2.5.1 Protein identification using Mascot 66
4.2.5.2 Assignment of proteins to MIPS Functional Catalogue
categories 66
4.2.5.3 Signal peptide predictions 67
4.3 Results 68
4.3.1 Analysis of excretory/secretory antigens from N. caninum 68 4.3.2 Rhoptry and rhoptry/dense granule-enriched fraction analyses 71
4.4 Discussion 77
4.4.1 Optimization of an ESA protocol for N. caninum 77
4.4.2 Enrichment for apical proteins 77
4.4.3 Apical proteins identified 78
4.4.3 Coverage of the N. caninum proteome 80
CHAPTER 5:ROP18 FUNCTIONAL ANALYSIS
5.1 Introduction 82
5.1.1 Rhoptry gene ROP18 82
5.1.2 Sequencing of the ROP18 region to confirm presence of stop codons 84 5.1.3 Analysis of transcriptomic and proteomic data for evidence of ROP18
products 84
5.1.4 The interferon-γresponse to coccidian infection and the role of 85 ROP18
5.2 Materials and methods 87
5.2.1 ROP18 sequencing by PCR 87
5.2.2 Minisatellite analysis of the five strains 88
5.2.3 Examination of proteomic data for ROP18 peptides 89
5.2.4 Immunity-Related GTPase (IRG) experiments 89
5.2.4.1 Cell and parasite culture 89
5.2.4.2 Immunological reagents and immunofluorescence analysis 89
5.3 Results 91
5.3.1 Examination of proteomic data for ROP18 peptides 91
5.3.2 PCR sequencing of the ROP18 region 91
5.3.3 Immunofluorescence analyses 92
5.3.3.1 IRG a6 92
5.3.3.2 IRG b1-b2 94
5.3.3.3 IRG b6, IRG m2 and IRG b10 95
5.3.3.4 IRG a6 phosphorylation 95
5.4 Discussion 98
CHAPTER 6: DIFFERENTIAL ANALYSIS OF GENE EXPRESSION DURING TACHYZOITE TO BRADYZOITE STAGE CONVERSION
6.1 Introduction 102
6.1.1 Bradyzoites and recrudescence of infection 102
6.1.2 RNA-Seq 103
6.2 Pilot study of the N. caninum transcriptome 104
6.2.1 Analysis of the pilot data 105
6.2.2 Objectives for the bradyzoite/tachyzoite RNA-Seq analysis 107
6.3 Materials and methods 108
6.3.1 Sample collection 108
6.3.2 Total RNA extraction by hybrid chloroform/RNeasy method 108
6.3.3 Isolation of mRNA by Poly(A) selection 109
6.3.4 Quality Control 109
6.3.5 Sequencing 110
6.3.6 Data analyses 110
6.4 Results 112
6.4.1 Sample preparation and sequencing 112
6.4.2 Spearman’s Rank Correlation of Biological Replicates 112
6.4.3 Differential expression 113
6.4.4 Cluster Analyses 115
6.4.5 Highly expressed genes 125
6.4.6 Differential expression of genes involved in metabolism 126
CHAPTER 7:DISCUSSION
7.1 Apical proteins and the potential for further study 135 7.2 Important apical proteins not identified in the tachyzoite 136 7.3 ROP18 pseudogenisation and what it might mean from a population
perspective 137
7.4 Additional life cycle stages 140
7.5 Concluding remarks 141
L
IST OF FIGURES
Figure 1.1 Lifecycle of Neospora caninum 2
Figure 1.2 Diagram of a Neospora caninum tachyzoite 5
Figure 1.3 Summary of the invasion process in Apicomplexa 5
Figure 1.4 Tachyzoite and bradyzoite tissue cysts 10
Figure 2.1 1-DE gel of N. caninum whole tachyzoite lysate 28
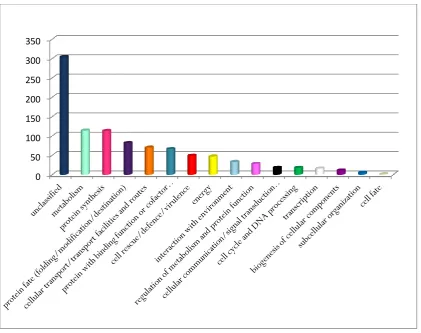
Figure 2.2 Functional classification of proteins identified in whole tachyzoite lysate analysed
by 1-DE and LC MS/MS 30
Figure 2.3 Venn diagrams showing MudPIT non-redundant protein identifications from whole
tachyzoite lysates 31
Figure 2.4 1-DE gel of tachyzoite lysates for Orbitrap 34
Figure 3.1 Example gene page from ToxoDB 40
Figure 3.2 Example of a protein-protein BLAST alignment 41
Figure 3.3 MIC2 gene duplication 47
Figure 3.4 Apparent expansion at the MIC17 locus 48
Figure 3.5 N. caninum ROP42 appears to have been incorrectly annotated as ROP8 54
Figure 4.1 Schematic of the isolation of rhoptries from T. gondii 64
Figure 4.2 1-DE gel of excretory/secretory preparation 68
Figure 4.3 Functional classification of proteins identified by 1-DE analysis of the
excretory/secretory preparation 69
Figure 4.4 Enrichment for proteins with predicted signal peptides by different proteomic
samples 70
Figure 4.5 1-DE gel of rhoptry and rhoptry/dense granule–enriched fractions 71
Figure 4.6 Venn diagram illustrating redundancy between rhoptry and rhoptry/dense granule
fractions 72
Figure 4.7 Functional classification of proteins identified by 1-DE analysis of the rhoptry and rhoptry/dense granule-enriched fraction
73
Figure 4.8 Enrichment of cell rescue, defence and virulence proteins 74
Figure 5.1 Artemis genome viewer showing a 6 frame translation of the N. caninumROP18
region 84
Figure 5.3 Minisatellite analysis of the five N. caninum strains to confirm amplification of DNA
from different strains 92
Figure 5.4 N. caninum parasitophorus vacuole IRG loading 93
Figure 5.5 N. caninum parasitophorus vacuole IRG a6 loading 94
Figure 5.6 N. caninum parasitophorus vacuole IRG b1-b2 loading 94
Figure 5.7 Phosphorylation of IRG a6- T102 was observed in T. gondii infected MEFs but not in N. caninum-infected MEFs, despite loading of IRG a6 onto the PV 96
Figure 5.8 IRG a6 phosphorylation as a percentage of IRG a6 positive parasitophorous
vacuoles 96
Figure 5.9 Phosphorylation of IRG-a6 in T. gondii type I (RH) and type II (ME49) isolates 97
Figure 6.1 Normalised expression levels for all genes for which expression was detected
transcriptomically or proteomically 105
Figure 6.2 Venn diagram showing gene expression detected in the transcriptome and the
proteome 106
Figure 6.3 Comparison of Day 3 cultures to Day 4 and Day 6 106
Figure 6.4 Changes in mRNA expression of key genes when comparing Day 6 N. caninum
cultures to Day 3 107
Figure 6.5 Bioanalyzer traces of representative samples which passed quality control 109
Figure 6.6 Bradyzoite-associated genes clustered over the time course 116
Figure 6.7 Dense granule-associated genes clustered over the time course 118
Figure 6.8 Rhoptry-associated genes clustered over the time course 120
L
IST OF TABLES
Table 2.1 MIPS Functional Categories 27
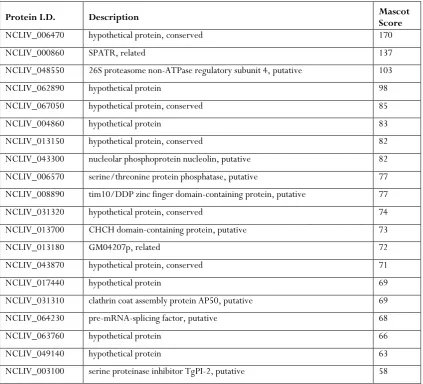
Table 2.2 Novel protein identifications from the Orbitrap Velos tachyzoite analysis 32
Table 3.1 Putative list of microneme genes 45
Table 3.2 Putative list of rhoptry genes 50
Table 3.3 Putative list of dense granule genes 56
Table 4.1 Apical proteins identified in one or more of the following: whole tachyzoite analysis, excretory/secretory antigen analysis and rhoptry and dense granule analyses
75
Table 5.1 N. caninum strains analysed by PCR 87
Table 5.2 Primers used for ROP18 sequencing 87
Table 5.3 Primary antibodies used and their dilutions 90
Table 6.1 Tachyzoite/bradyzoite RNA-Seq samples 108
Table 6.2 Summary of reads and mapping to the Neospora caninum genome 112
Table 6.3 Spearman’s Rank correlation of biological repeats 113
Table 6.4 Summary of differential expression from DESeq analysis 114
Table 6.5 Membership of bradyzoite-associated gene clusters, with mean FPKM values for
the two biological replicates 117
Table 6.6 Membership of dense granule-associated gene clusters, with mean FPKM values for
the two biological replicates 119
Table 6.7 Membership of rhoptry-associated gene clusters, with mean FPKM values for the
two biological replicates 121
Table 6.8 Membership of microneme-associated gene clusters, with mean FPKM values for
the two biological replicates 124
Table 6.9 Ten most highly expressed genes for each time point, by FPKM 126
L
IST OF ABBREVIATIONS
1-DE One-dimensional electrophoresis
2-DE Two-dimensional electrophoresis
AMA Apical membrane antigen
APS Ammonium persulphate
BLAST Basic Local Alignment Search Tool
bp Base pairs
BSA Bovine serum albumin
cDNA Complementary DNA
CID Collision-induced dissociation
D.E. Differentially expressed
DAPI 4′,6-Diamidine-2′-phenylindole dihydrochloride
ddH20 Milli-Q grade water, resistivity 18.2 Ω.cm
DNA Deoxyribonucleic acid
DO media Dulbecco's modified Eagle's medium, 2 Mm glutamine, 10 mM HEPES
DTT Dithiothrietol
EDTA Ethylenediaminetetraacetic acid
ESA Excretory/secretory antigen sample
ESI Electrospray ionisation
EST Expressed sequence tag
EtOH Ethanol
EuPathDB Eukaryotic Pathogen database
FIKK Serine/threonine protein kinase in Plasmodium spp
FPKM Fragments per kilobase of exon per million fragments mapped
GO Gene Ontology
GRA Dense granule protein
GTPase Guanosine-triphosphatase
HCl Hydrochloric acid
HPLC High-performance liquid chromatography
IAA Iodoacetemide
IFN-γ Interferon-gamma
IL-10 Interleukin-ten
IL-12 Interleukin-twelve
IMDM Iscove’s-modified Dulbecco’s medium
IRG Immunity-related GTPase
LAMP Liverpool Library of Apicomplexan Metabolic Pathways
LC Liquid chromatography
LTQ Linear-trap quadrupole
m.o.i. Multiplicity of infection
m/z Mass-to-charge ratio
M2AP MIC2-associated protein
MALDI Matrix-assisted laser desorption-ionisation
MAPK Mitogen-activated protein kinase
MAR Microneme adhesive repeat
MCP Microneme adhesive repeat-containing protein
MEF Mouse embryonic fibroblast
MgCl2 Magnesium chloride
MIC Microneme protein
MIPS Munich Information Center for Protein Sequences
MOPS 3-(N-morpholino)propanesulfonic acid buffer
mRNA Messenger RNA
MS Mass spectrometry
MS/MS Tandem mass spectrometry
MudPIT Multidimensional protein-identification technology
NTPase Nucleosidetriphosphatase
PAGE Polyacrylamide gel electrophoresis
PBS Phosphate-buffered saline
PlasmoDB Plasmodium database, member of EuPathDB
Poly(A) RNA Polyadenylated RNA
PV Parasitophorous vacuole
PVM Parasitophorous vacuole membrane
QTL Quantitative trait loci
R Rhoptry sample
R/DG Rhoptry/Dense granule sample
RNA Ribonucleic acid
RNA-Seq RNA sequencing
RON Rhoptry neck protein
ROP Rhoptry protein
ROPK Rhoptry kinase
RP Reverse phase
RPKM Reads per kilobase of exon per million reads mapped
SCX Strong cation-exchange
S/T domain Serine/threonine domain
SAG Surface antigen
SDS Sodium dodecyl suphate
SNP Single nucleotide polymorphism
SRS SAG-related surface protein
SUB Subtilisin protease
TCA cycle Tricarboxcylic acid cycle
TEMED Tetramethyladenamine
TFA Trifluoroacetic acid
TOF Time-of-flight
ToxoDB Toxoplasma and Neospora database, member of EuPathDB
1
C
HAPTER
1:
I
NTRODUCTION
1.1 Neospora caninum
Neospora caninum is a parasitic protozoan which invades and replicates in mammalian host cells, causing the important veterinary disease neosporosis. It is a member of the eukaryotic phylum Apicomplexa, along with some important medical and veterinary pathogens worldwide: such as Plasmodium (the causative agent of malaria), Toxoplasma (toxoplasmosis), Cryptosporidium (cryptosporidiosis) and Eimeria (coccidiosis) among others. The Apicomplexa are named with reference to their specialised ‘apical complex’ – a collection of organelles with roles in the process of host-cell invasion (Dubremetz et al. 1998a). These parasites are obligately intracellular for most of their life cycle, so an understanding of the process of invasion could lead to the development of drugs and vaccines to interfere with this vital step.
There are two species of Neospora: N. caninum and N. hughesi; which, alongside Toxoplasma gondii, two species of Hammondia and six species of Besnoitia, make up the subfamily Toxoplasmatinae, of the Sarcosystidae (Hemphill & Gottstein 2000; Mugridge et al. 1999; Tenter & Johnson 1997). N. caninum has a canid definitive host (Lindsay, Dubey & Duncan 1999; McAllister et al. 1998) and can infect a range of mammals as intermediate hosts, although it has the most significant impact as a pathogen of cattle. In addition to dogs (Canis familiaris), several sylvatic definitive hosts may exist; coyotes (Canis latrans) and grey wolves (Canis lupus) (Dubey et al. 2011)have been confirmed to shed oocysts (Gondim et al. 2004),
while foxes remain unconfirmed as definitive hosts (Almeria et al. 2002).
1.2 Lifecycle and epidemiology
2
developing foetuses (Barber & Trees 1998; Dubey et al. 1988b; Dubey, Koestner & Piper 1990; Dubey & Lindsay 1989; Dubey, Schares & Ortega-Mora 2007). The exact process of sexual reproduction is not yet proven, but it is thought that oocysts are produced from gametogeny and syngamy in the intestinal epithelial cells (Williams et al. 2009). They are then shed via the faeces into the environment (McAllister et al. 1998), where they sporulate to produce two sporocysts, each containing four sporozoites. When intermediate hosts ingest material contaminated by oocysts (horizontal transmission), the sporozoites hatch and differentiate into tachyzoites, which likely disseminate via the circulatory system by invading mononuclear phagocytic cells (Gibney et al. 2008; Williams et al. 2009). Tachyzoites can invade a range of cell types but appear to have a predilection for central nervous system (CNS) and placental tissues (Dubey 2003). They replicate within parasitophorous vacuoles (PVs) by endodyogeny (Dubey et al. 2004; Speer & Dubey 1989), a form of internal budding resulting in two daughter cells (Roberts, Schmidt & Janovy 2009). Figure 1.1 shows a representation of the N. caninum life cycle, in cattle, the intermediate host of major veterinary importance.
3
Vertical transmission of an infection, passed down to subsequent generations via the placenta, can be from a newly acquired exogenous infection or recrudescence of an endogenous infection (Trees & Williams 2005). The relative importance of the different routes of transmission has been under scrutiny but it appears that both horizontal and vertical routes play a role in maintaining infection levels and therefore ensuring the continuation of the parasite population (Williams et al. 2009). Endogenous vertical transmission efficiencies in dairy herds have been reported to be as high as 78-95% (Davison, Otter & Trees 1999a; Pare, Thurmond & Hietala 1997) however and this is considered to be the principle route by which N. caninum transmission occurs (Dubey, Buxton & Wouda 2006; Dubey, Schares & Ortega-Mora 2007; Williams et al. 2009). As a result, a vaccination that could prevent recrudescence of bradyzoites in cows and heifers would have a significant impact on the population of this parasite.
1.3 Economic impact of neosporosis
Neospora caninum causes the disease neosporosis, which manifests most significantly in cattle, especially from an economic perspective, but also causes pathology in dogs.
Canine neosporosis manifests as a debilitating neuromuscular dysfunction, mainly affecting puppies and young dogs under six months, although clinical disease can occur in older dogs (Dubey 2005). The infection can be obtained from ingesting infected tissues (such as an intermediate host) as well as congenitally transmitted, and tissue cysts can remain even if there is clinical recovery (Dubey et al. 2007).
4
1996, 1997). With dairy farmers under enormous strain in today’s market to make any profit at all, it is of the essence that a vaccine be developed to effectively control the spread of this disease.
1.4 Host cell invasion and the apical complex
5
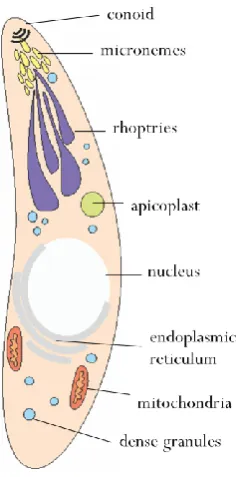
Figure 1.2: Diagram of a Neospora caninum tachyzoite. Organelles are labelled, diagram not to scale: a tachyzoite measures approximately 7.5 x 2 µm (Speer et al. 2009).
Tachyzoite invasion into a host cell is a key stage towards implementing the pathologies associated with apicomplexan parasites. It is fairly well conserved within the phylum and consists of a complex sequence of events (Mital & Ward 2008) summarized in Figure 1.3.
Figure 1.3: Summary of the invasion process in Apicomplexa. The parasite attaches to a host cell and reorientates so that the apical tip is aligned with the host cell surface. Entry to the host cell is an active process reliant on parasite proteins. Once internalised, a parasitophorous vacuole is established within which replication occurs.
[image:20.595.247.367.73.312.2]6
cell surface (Dubremetz et al. 1998b; Nichols, Chiappino & O'Connor 1983) before forming an intimate ‘moving junction’ with the host cell membrane, dependent upon secreted proteins from the micronemes and rhoptries (Besteiro et al. 2009). The whole process of invasion is rapid, lasting only a few seconds, but the organelles are thought to discharge their contents sequentially; micronemes are quickly followed by rhoptries, then dense granules, whose proteins are involved in establishment of the host-parasite interaction once the zoite has internalised within the parasitophorous vacuole (PV) (reviewed in (Dubremetz et al. 1998b)). The parasitophorous vacuole membrane (PVM) is comprised mostly of host cell plasmalemma with integrated parasite proteins (Beckers et al. 1994), host transmembrane proteins are excluded so that the vacuole is unable to fuse with lysosomes (Mordue et al. 1999a; Mordue et al. 1999b) and is hence protected from host immune defences. Host organelles, including mitochondria and endoplasmic reticulum, accumulate around the PV (de Melo, de Carvalho & de Souza 1992), with parasite PVM-host organelle interactions mediated by parasite proteins (Sinai & Joiner 2001). Whilst the invasion process has been well characterised in T. gondii and other Apicomplexa such as Plasmodium spp, less is known about whether N. caninum behaves in exactly the same way.
1.4.1 Micronemes
7
efficient host cell entry (Jewett & Sibley 2004). The subtilisin protease T. gondii SUB1 is required for host cell surface processing of MICs upon their release from the micronemes and a deficiency in SUB1 results in poor cell attachment and gliding motility (Lagal et al. 2010).
Cowper et al. (2012) predict that the MICs are likely to be responsible for the range of tissue type and host cell tropisms exhibited by different coccidian Apicomplexa and suggest that an HxT motif, lacking in the N. caninum orthologue of T. gondii MIC13, could potentially be a basis for the difference in zoonotic capability between the two organisms, as it mediates binding of α2,9-disialyl which has been identified on some human cells.
1.4.2 Rhoptries
The rhoptries are not only essential to host cell invasion but a number of rhoptry kinases have recently been implicated as determinants of virulence in T. gondii. Rhoptry proteins primarily comprise the RONs, or rhoptry neck proteins, which localise to the long neck-like part of the organelle under immunostaining (Bradley et al. 2005) and the ROPs, which are secreted from the bulbous rhoptry body. RON2, RON4, RON5 and RON8 form a complex in T. gondii with the microneme protein Apical membrane antigen 1 (AMA1) that localises to the moving junction, forming a tight contact between the parasite and host membranes (Alexander et al. 2005; Besteiro, Dubremetz & Lebrun 2011; Besteiro et al. 2009; Tyler & Boothroyd 2011).
8
ROP5, ROP16 and ROP18 have all been shown to confer virulence in different strains of T. gondii: ROP5 exists in different copy numbers between different strains (Reese et al. 2011; Reese & Boothroyd 2011), ROP16, which traffics to the host cell nucleus, phosphorylates STAT6 and in this way modulates host interleukin-12, a proinflammatory cytokine (Denkers et al. 2012; Saeij et al. 2007). ROP18 subverts the host interferon-gamma (IFN-γ) immune response by phosphorylating an immunity related GTPase that would otherwise cause rupture of the PV. ROP38 is expressed at higher levels in less virulent T. gondii strains and down regulates the MAPK (Mitogen-activated protein kinase) pathway of the host cell to interfere with apoptosis and cell proliferation (Peixoto et al. 2010). Most of these findings have yet to be confirmed in N. caninum, though it is hypothesised that host cell invasion is largely analogous to that observed in T. gondii. An analysis of protein expression in N. caninum tachyzoites will aid understanding of the similarities and differences in the invasion process between the two organisms.
1.4.3 Dense Granules
The GRA family of dense granule proteins (reviewed in Nam (2009), regarding T. gondii) are largely secretory proteins that also contain transmembrane domains. GRA1 is secreted into the PV lumen (Sibley et al. 1995) while GRA2, GRA4 and GRA6 are associated with an intravacuolar membranous network (Labruyere et al. 1999). GRA3, GRA5 and GRA10 are secreted into the PVM for direct interaction with the host cytoplasm (Ahn et al. 2006). T. gondii GRA7 gets phosphorylated during host cell invasion and associates with ROP2 and ROP4, probably on the PVM (Dunn et al. 2008). These proteins, along with ROP1, GRA3 and GRA1, form punctate strands (‘beads-on-a-string’ (Ravindran & Boothroyd 2008)) extending into the host cell, to and from the nascent PV, that are observed to partially overlap with each other by immunostaining (Dunn et al. 2008). These strands may be organised along microtubules and are likely to be involved in intracellular trafficking of proteins (Ravindran & Boothroyd 2008). The dense granule proteins are therefore involved with establishing and maintaining PV during and after host cell invasion and provide a mechanism for molecular interaction between the parasite and the host.
1.5 Neospora and Toxoplasma – similarities and differences
9
the beginning of the 20th century (Hemphill & Gottstein 2000). However, due to their close
relatedness and the many genetic, physiological and morphological similarities, much research in N. caninum has benefitted from prior knowledge of T. gondii biology.
However, despite the close synteny of their genomes (DeBarry & Kissinger 2011; Reid et al. 2012), there are notable differences between T. gondii and N. caninum, which has led to them being placed in separate genera (Dubey et al. 1988a). One example is their host specificity. While T. gondii appears to be able to infect almost any warm blooded cell type, N. caninum exhibits more specificity: it has so far not been demonstrated to be zoonotic (Dubey, Schares & Ortega-Mora 2007; McCann et al. 2008), despite readily infecting human cells in vitro. Elucidating the molecular basis of this difference could be important towards discovering ways of preventing infection.
Although apparently identical by light microscopy, there are ultrastructural differences between the two organisms (Speer & Dubey 1989; Speer et al. 1999). N. caninum tachyzoites are slightly larger than T. gondii; at 7.5 x 2 µm; and numbers of organelles vary between the two. Micronemes are more numerous in N. caninum, while dense granules are numerous in both (Speer et al. 1999). N. caninum possess six to sixteen rhoptries compared to four to ten in T. gondii (Speer et al. 1999). Compared to tachyzoites, bradyzoites of both species contain fewer rhoptries. Interestingly, the electron-dense rhoptries of N. caninum tachyzoites are similar to those of the mature bradyzoites of both species, whereas those of T. gondii are spongy and electron-lucent (Speer et al. 1999). T. gondii cyst walls are smooth and less than 0.5 µm thick: N. caninum tissue cysts have an irregular, thick cyst wall (≤ 4 µm) but are smaller when compared to T.gondii tissue cysts, containing 20-100 and 50-500+ bradyzoites respectively (Speer et al. 1999). Figure 1.4 (adapted from Dubey, Buxton & Wouda (2006) and Dubey, Lindsay & Speer (1998)) shows histological images of a tachyzoite and a bradyzoite tissue cyst of N. caninum, the latter with a thick cyst wall; and a tissue cyst of T. gondii with a comparatively thinner cyst wall.
10
none further than other than additional members of the Canis genus have been identified to date.
Figure 1.4: Tachyzoites and bradyzoite tissue cysts. A) A large group of apparently intracellular N. caninum
tachyzoites (arrow); B) A thick walled (arrow) N. caninum tissue cyst within a neuron in the spinal cord of a 3-day old calf; C) T. gondii tissue cyst freed from mouse brain, cyst wall (arrow) enclosing hundreds of bradyzoites. Haematoxylin & Eosin x 600 (A & B), unstained impression smear (C), adapted from Dubey, Buxton & Wouda (2006) and Dubey, Lindsay and Speer (1998).
1.6 Host immune response and pathology
11
significant increase in IFN-γ levels and the timing of this event is crucial to whether the foetus is aborted, born persistently infected, or born healthy (Trees & Williams 2005; Williams et al. 2000). Bovine neosporosis differs from ovine toxoplasmosis in that while both involve exogenous infections acquired during pregnancy, ovine toxoplasmosis does not commonly involve recrudescence of endogenous infection or have an effect on successive pregnancies (Innes et al. 2007).
1.7 Proteomics
Advances in proteomic techniques in recent years have made possible the high throughput analysis of complex mixtures of proteins. This has enabled the move to a ‘systems biology’ approach to research, as opposed to the study of individual proteins in isolation. To improve resolution of mixtures however, it is common practice to separate proteins out prior to enzymatic digestion, or alternatively digest the lysate prior to separation in peptide space. Peptides can be identified sensitively and accurately by mass spectrometry then assigned to proteins by bioinformatic searching of predicted protein databases.
1.7.1 Electrophoresis
Complex mixtures of proteins can be separated out on a gel matrix by the application of an electric field. Polyacrylamide gel electrophoresis (PAGE) of proteins denatured with the detergent sodium dodecyl sulphate (SDS) is a widely used and well established method for reliable separation according to molecular weight (Shapiro, Vinuela & Maizel 1967).
The commonly used method developed by Laemmli (1970) employs a short layer of large-pore gel to concentrate dilute/large volume samples into a thin front; which then passes on to a longer, small pore-sized resolving gel where the molecules separate out, allowing for improved resolution of the protein mixture. This discontinuous one dimensional gel method is referred to as 1-DE for the remainder of this thesis.
12
Once separated on a gel, bands or plugs of protein can be excised and digested with proteolytic enzymes and the resulting peptides identified by mass spectrometry. Trypsin, a commonly used enzyme in proteomics (Rosenfeld et al. 1992; Shevchenko et al. 2006; Shevchenko et al. 1996), cleaves proteins after lysine and arginine residues, leaving a mixture of peptides which can be bioinformatically predicted in order to generate databases against which mass spectrometric data can be searched.
1.7.2 Reverse-phase high performance liquid chromatography (LC)
For complex mixtures of peptides, it is beneficial to introduce further stages of separation in order to simplify the sample and allow for better resolution of the different peptides it comprises. High performance liquid chromatography (HPLC) is a process whereby molecules contained within a liquid mobile phase are forced through a stationary phase contained within a closely-packed column, under pressure. In the stationary phase, compounds bind to the column based upon their chemical properties. For reverse phase (RP) HPLC, this means non-polar molecules are retained while non-polar molecules are first to elute. The mobile phase solvent buffer is altered along a gradient, by gradually increasing the acetonitrile content, in order to elute the more polar molecules by increasing hydrophobicity (Simpson 2003).
1.7.3 Tandem mass spectrometry (MS/MS)
A property known as the mass to charge ratio (m/z) is utilized by mass spectrometry technology to differentiate peptides. Proteomic mass spectrometry requires peptides to be converted to the gas phase by an ionisation source. When a mass spectrometer is coupled downstream to an LC system, this is usually an electrospray ionisation source (ESI), as found on an LTQ (linear trap quadrupole) mass spectrometer (Thermo Finnigan). Gas phase ions are identified by an initial survey spectrum (MS) then the three most abundant peptides fragmented by collision-induced dissociation (CID) before a second scan is performed to measure the m/z of the resulting fragments (MS/MS).
13
1.7.4 Multidimensional protein identification technology (MudPIT)
MudPIT technology utilises an additional strong cation exchange (SCX) LC column upstream of an RP column to provide enhanced separation of peptides. As such, prior gel separation is not required and proteins are digested to peptides as a complete sample. Twelve salt step gradients elute peptides from the SCX to the RP column, which is then coupled to a mass spectrometer, for example an LTQ, for analysis as described above. Bioinformatic analysis of the twelve resultant data files is complex, due to the fact that peptides to one protein could, in theory, be identified in any number of the twelve fractions. This is in contrast to techniques that adopt protein-space separation, where enzymatic digestion is applied to pre-simplified mixtures of proteins (Washburn, Wolters & Yates 2001; Wolters, Washburn & Yates 2001).
1.7.5 Bioinformatics – peptide/protein identification
14 1.8 Transcriptomics
Proteomic techniques analyse proteins, the end result of transcription and translation from genetic material. The field of transcriptomics is interested in the intermediate product, RNA. The analysis of messenger RNA (mRNA) levels within a system can provide a snapshot of a rapidly changing environment to give information about cellular processes earlier than would be possible by proteomics. Microarray has been a popular technique for studying transcription, it requires synthesis of thousands of complementary DNA (cDNA) probes which are attached to a chip, before hybridisation of cDNA reverse-transcribed from mRNA in the sample. The chip is then scanned to provide an expression profile. Other ways of measuring mRNA expression include quantitative polymerase chain reaction (qPCR), which is highly accurate but more suited to smaller numbers of sequences of interest, and expressed sequence tag (EST) profiling, which sequences short regions of expressed genes and was useful for genome research before being largely superseded by the advent of RNA-Seq.
1.8.1 RNA-Seq
Next-generation sequencing technology has opened up opportunities in genome research by making the technique faster, cheaper and most importantly, available to the wider scientific community. One method that has been developed as a result is RNA-Seq, the sequencing of cDNA libraries created from reverse transcribing mRNA in a sample. This technique is not only highly sensitive, but provides absolute quantitation, and as such has become hugely popular in recent years.
Sanger capillary sequencing (Sanger, Nicklen & Coulson 1977) requires in vivo cloning of DNA in E. coli prior to sequencing with dye-labelled terminator dNTPs. Next generation sequencing has removed the need for in vivo cloning and uses either DNA synthesis (Illumina, 454) or ligation (SOLiD) instead. The 454 platform is a higher throughput alternative to Sanger sequencing that uses emulsion PCR in place of clone libraries, to perform ‘pyrosequencing’ (Margulies et al. 2005). It produces similar length reads, of approximately 500 base pairs, so is suitable for sequencing DNA or RNA for which there is no reference sequence available, as the long read lengths aid bioinformatic data processing.
15
added which have a fluorescent dye attached, which acts as a reversible terminator. The flow cell is imaged then the dye removed (but not the base) and the next base added; and so on (Holt & Jones 2008), until the whole product has been sequenced. Because all bases are added at once, there is competition for incorporation; this increases accuracy compared to Sanger sequencing in which four separate reactions take place, however read lengths are much shorter (50-100 base pairs) so a good reference genome to align to is a requirement.
The SOLiD platform performs sequencing by rounds of ligation of dinucleotides to adapters (Shendure et al. 2005). This method is highly accurate due to the fact that each base is read twice (as the second nucleotide and then the first nucleotide), so genuine single nucleotide polymorphisms require two fluorescent colour changes. SOLiD also produces short reads, but sample preparation and data processing are complex compared to the Illumina platform.
A new third-generation sequencing method: ‘single molecule sequencing’ (Harris et al. 2008) has recently been introduced, which requires only tiny amounts of starting material; but it is not yet widely available.
1.9 Systems biology
The study of biological events is in the process of moving on from a ‘reductionist’ approach, where components are examined individually, to a ‘systems biology’ approach, due to the advances in technology described above. The advent of the genomic era and the ability to analyse whole transcriptomes and proteomes has led on from hypothesis driven experiments focusing on single genes to hypothesis-generating studies, based on the integration of all these data, to provide an overview of the system as a whole (Wastling et al. 2012). This is particularly valuable in parasite biology due to the importance of understanding the interaction of the parasite with its host; and the Apicomplexa are some of the most comprehensively studied to date (Wastling et al. 2009).
1.10 Current state of the N. caninum genome, proteome and transcriptome
16
al. 2008b; Lee et al. 2005). No RNA-Seq experiments had been published for N. caninum and although mRNA expression had been examined by annealing control primer-based PCR (Kang et al. 2008a), the transcriptome data presented in Reid et al. 2012 and the pilot study discussed in Chapter 6.2 were the first RNA-Seq analysis performed on N. caninum tachyzoites. In comparison, T. gondii, C. parvum and Plasmodium spp. have been extensively studied and large proportions (25 % and more) of their predicted proteomes have been identified experimentally (Xia et al. (2008), Sanderson et al. (2008) and multiple experiments for Plasmodium (Belli, Walker & Flowers 2005) hosted on PlasmoDB (Aurrecoechea et al. 2009)).
The N. caninum genome is assembled into pseudochromosomes (Reid et al. 2012) based upon the fourteen published chromosomes of T. gondii (Toxo DB, Gajria et al. 2008). The analyses in DeBarry and Kissinger (2011) and Reid et al. (2012) found a high degree of synteny between the two organisms, with over 90 % of the genome comprising one-to-one orthologues and only 113 and 231 genes (excluding surface antigens) specific to N. caninum and T. gondii respectively. In addition, the G+C content was very similar (54.8 % in N. caninum and 52.3 % in T. gondii) as was the percentage of the genome that encoded proteins (29.7 % in N. caninum and 28.3 % in T. gondii, compared to 53.0 % in P. falciparum). Reid et al. (2012) also estimated that 32.1 % of the N. caninum/T.gondii genome consisted of eukaryotic genes, 28.8 % of Apicomplexan genes and the remaining 39.1 % of genes were coccidian specific. The majority of the divergence between N. caninum and T. gondii appeared to be attributed to surface antigen genes and to those encoding apical proteins, which will be discussed in more detail in this thesis.
A more comprehensive analysis of the N. caninum proteome and transcriptome was necessary to better understand the genes and proteins important to an infection; and the release of an annotated genome sequence made this a possibility.
17 1.11 Aims and objectives
The aim of this project was to advance understanding of N. caninum biology by taking a systems view of the genes and proteins important to this parasite. Identifying proteins expressed by the invasive tachyzoite life stage, in particular those released by the micronemes, rhoptries and dense granules, would provide an insight into the process of host cell entry, an event that underpins Apicomplexan parasitism.
The recent sequencing of the N. caninum genome was a major factor in facilitating the analysis of the proteome and transcriptome. There had been only limited proteomic studies published for N. caninum, so the peptide data produced from a global analysis of the tachyzoite proteome was an asset to the genome annotation. The accuracy and completeness of the genome annotation has a direct effect on the quality of the proteomic identifications derived from searching against the gene models, therefore this analysis was seen as an essential prerequisite to the rest of the study.
Simplifying the proteome to contain proportionally more apical proteins in comparison to structural and housekeeping proteins allowed a more focused analysis of these proteins of interest. This was achieved by a combination of two approaches: an examination of the excreted/secreted proteome by stimulating the parasites to discharge the contents of their apical organelles; and by attempting to separate the organelles into different fractions for analysis.
Bioinformatic study comprised an invaluable part of the project, both in analysis of proteomic data and for in silico investigations into the predicted subproteomes. Various proteins are difficult to detect in experimental proteomics (von Hagen 2008), due to differences in expression levels, chemical and structural characteristics which affect solubility and differences in peptide flight during mass spectrometry (Bell et al. 2009), so by using bioinformatics it was hoped to supplement the data generated by proteomic experiments.
18
The ability to convert to a latent bradyzoite stage and later recrudesce is an important aspect of N. caninum transmission, and is responsible for much of the pathology associated with neosporosis in dairy herds. RNA-Seq provided a high-throughput platform from which to analyse the process by which stage conversion occurs, and to examine the differences in expression of key genes between the tachyzoite and bradyzoite stages.
19
C
HAPTER
2:
A
N ANALYSIS OF THE TACHYZOITE PROTEOME
2.1 INTRODUCTION
The overall aim of this thesis was to improve the understanding of host cell invasion by N. caninum by identifying and studying the proteins involved in the process. In order to achieve this, and due to the fact that there had been only limited proteome data published for this organism to date, a global proteome analysis for the tachyzoite stage was undertaken. It was hoped that the data would benefit the genome sequencing project by providing peptide evidence to reinforce the predicted gene models. The accuracy and completeness of the genome annotation has a direct effect on the quality of the data derived from searching against the gene models. Therefore, this analysis was seen as an essential prerequisite to the rest of the study.
Proteomic analyses by one and two dimensional electrophoresis (1-DE and 2-DE, respectively), followed by high performance liquid chromatography coupled to a tandem mass spectrometer (LC MS/MS), of the related organisms T. gondii and C. parvum had previously yielded substantial coverage of their respective predicted proteomes (Sanderson et al. 2008; Xia et al. 2008). These studies acquired peptide data for a wide range of protein types and presented a global view of protein expression for the T. gondii tachyzoite and C. parvum sporozoite life stages, providing an insight into which groups of proteins may be important during this time of rapid multiplication and invasion. These methods were therefore adopted for this equivalent study on the N. caninum tachyzoite, although with some slight adaptations as will be discussed in this chapter.
2.1.1 Global proteomic analyses on N. caninum and related Apicomplexa
20
other and to RH strain T. gondii. The combined number of proteins identified from these studies is less than 100 proteins, which, for an organism with a predicted 7082 protein coding genes (Reid et al. 2012), equates to < 1.5 % coverage, which is probably a result of the lack of sequence data available at this time. From the existing data for T. gondii and C. parvum, approximately 30% of the predicted proteins were detected by proteomic methods in lysates of tachyzoites or sporozoites (Sanderson et al. 2008; Xia et al. 2008). It is important to note that these analyses examine one life stage only, and that some proteins are likely to be specific to other life stages not analysed.
At the time this study commenced, there were a predicted 5587 proteins for N. caninum, compared to 7993 for T. gondii ME49. The Xia et al. (2008) study used a combination of 1-DE and LC MS/MS of whole cell lysate, including separate preparations of soluble and insoluble fractions, 2-DE and LC MS/MS, and multi-dimensional protein identification technology (MudPIT) to identify a total of 2252 non-redundant proteins. When these multiple experiments are broken down and looked at individually, it becomes clear that the MudPIT platform (2121 non-redundant identifications) followed by 1-DE LC MS/MS (939) are the highest yielding in terms of protein identifications. A further 40 non-redundant proteins were identified in the 2-DE experiments (547 overall). Whilst 2-DE can achieve superior protein separation to 1-DE, the aim of this study was to identify as many proteins as possible, and it was therefore decided that 2-DE was unlikely to provide much additional benefit over 1-DE and MudPIT experiments.
In comparison, Plasmodium falciparum is probably the most well characterised Apicomplexan, with proteomes identified over a whole range of life-stages. Total protein identifications number 3969 (multiple studies, data hosted on PlasmoDB) of the 5772 predicted genes (Aurrecoechea et al. 2009). This is an example of what can be achieved with a model organism for which the entire life cycle can be replicated in culture.
2.1.2 Peptide data as an aid to genome annotation
21
Over the duration of this study, the N. caninum genome annotation was being curated by collaborators at the Sanger Institute, so peptide data generated from these experiments was used to resolve queries about the existence of genes or their intron/exon boundaries. For instance, gene models for which the predictions had low confidence could be searched against the protein/peptide data and if present, their putative existence could be confirmed. Whilst a lack of proteomic detection is not sufficient evidence to deny the existence of a protein, the identification of even one significant uniquely matched peptide provides a reasonable level of confidence that a protein is present within a sample.
2.1.3 Aims and objectives
22
2.2 MATERIALS AND METHODS.
2.2.1 Cell culture
NcLiv-strain tachyzoites were passaged twice weekly onto a layer of African Green Monkey Kidney Fibroblasts (Vero cells) in 25 cm2 tissue culture flasks, supported by IMDM (Iscove’s
Modified Dulbecco’s Medium, Lonza). The medium was supplemented with 10 % (v/v) foetal calf serum (Labtech International), 100 U/ml penicillin and 100 µg/ml streptomycin sulphate (Sigma-Aldrich) and filter sterilised prior to use in a 0.2 µm pore-size membrane, attached to a vacuum pump.Cells and parasites were maintained at 37 oC and 5 % CO
2. 2.2.1.1 Host cell passage
Host cell passage was performed by washing the confluent cell monolayer in 5 ml 1 M HEPES Balanced Salt Solution (Sigma-Aldrich) before incubating the cells for 5 minutes in 5 ml Trypsin-Versene (EDTA) mixture (Lonza), at 37 oC and 5 % CO
2. The cell suspension was
centrifuged for 5 minutes at 1500 x g, and then resuspended in 5 ml IMDM. A haemocytometer was used to count a sample of the cells, before they were seeded at a ratio of 1 x 10⁵ per 5 ml IMDM/25 cm2 flask.
2.2.1.2 Parasite passage
Approximately 24 hours post seeding, when the vero cells had reached 10-20 % confluence, they were infected with 4 x 10⁵ tachyzoites, which were then allowed to grow for 3-4 days to
coincide with egress before harvesting with a sterile cell scraper. Parasites were then either passaged into new cells, or isolated for use in experiments.
2.2.1.3 Parasite isolation
After harvesting the cells/parasites, host cell debris was removed by filtration through 47 mm diameter 3 µm pore-sized Nucleopore polycarbonate membranes (Whatman). Parasites were then washed twice in phosphate-buffered saline (PBS) pH 7.4 by centrifugation at 1500 x g, for 10 minutes at 4 oC. They were washed a final time by centrifugation at 13 000 x g for 5
min, the supernatant discarded, and pellets (each containing approximately 1 x 10⁸
tachyzoites) were either used immediately for a downstream experiment, or stored at -20 oC
23 2.2.2 Proteomic analyses
2.2.2.1 Preparation of tachyzoite lysates
Samples were lysed and solubilised in sample loading buffer (50 mM Tris HCL (pH 6.8), 2 % (w/v) sodium dodecyl sulphate (SDS), 0.2 % (w/v) bromophenol blue, 10 % (w/v) glycerol, 100 mM dithiothrietol (DTT)) at concentration of 5 µg tachyzoite protein/µl and subjected to three cycles of heating to 95 oC for 3 minutes and vortexing for 3 minutes, followed by
centrifugation at 13 000 x g for 5 minutes.
2.2.2.2 Bradford assay
Protein concentration was estimated by carrying out a Bradford assay (Bio-Rad Protein Assay) on an equivalent sample of tachyzoites, lysed and solubilised as described above in the sample loading buffer minus SDS and bromophenol blue, due to their incompatibility with the assay reagents. This assay is based on the principle of Coomassie dye binding to protein, and comprises a comparison to bovine serum albumin standards of known concentration as detailed in Bradford (1976). The samples and standards (10 µl of each, in triplicate) were pipetted into a 96-well plate and 200 µl dye reagent added to each well and mixed thoroughly. The plate was incubated at room temperature for a minimum of 5 minutes and the absorbance measured at 595 nm. A standard curve was produced from the absorbencies of the standards and the sample concentration calculated accordingly.
2.2.2.3 One dimensional electrophoresis (1-DE)
For 1-DE, 16 cm discontinuous gels were poured based on the Laemmli method (Laemmli 1970), as follows: 12 % (v/v) acrylamide resolving gel contained 40 ml acrylamide/bisacrylamide (30 %), 25 ml 1.5 M Tris/HCl pH 8.8, 1 ml 10 % (w/v) SDS, 33.5 ml ddH20 (ultrapure water, Milli-Q grade, resistivity 18.2 Ω.cm), 500 µl ammonium
persulphate (APS) and 100 µl tetramethyladenamine (TEMED); the 5 % (v/v) acrylamide stacking gel contained 3.4 ml acrylamide/bisacrylamide (30%), 5 ml 0.5 M Tris/HCl pH 6.8, 200 µl 10 % (w/v) SDS, 13.6 ml ddH20, 200 µl APS and 20 µl TEMED.
A total of 200 µg tachyzoite lysate was loaded onto the gel alongside 10 µl Precision Plus Protein Standard (Biorad). Samples were run through the 5 % (v/v) acrylamide stacking gel in 1 x SDS running buffer (25 mM Tris base, 192 mM glycine, 0.1 % SDS in ddH20) for
24
Gels were fixed at room temperature in fixing solution (40 % (v/v) ethanol/10 % (v/v) acetic acid) overnight, and then rinsed twice in ddH2O before staining with Colloidal Coomassie for
24 hours (20 % (v/v) methanol, 0.08 % (w/v) Coomassie Brilliant Blue G250, 0.8 % (v/v) phosphoric acid, 8 % (w/v) ammonium sulphate). After further rinsing in ddH2O, bands were
excised from the gel and stored individually in 1 % (v/v) acetic acid at 4 oC.
2.2.2.4 In-gel tryptic digestion
Gel bands were destained twice for 15 minutes at 37 oC in a solution of 50 % (v/v)
acetonitrile/50 mM ammonium bicarbonate. Reduction of cysteines was performed by a 30 minute incubation in 50µl of 10 mM DTT/100 mM ammonium bicarbonate, followed by alkylation in 50 µl 100 mM iodoacetamide (IAA)/55 mM ammonium bicarbonate for 1 hour, in the dark; both at 37oC. The gel bands were then dehydrated for 15 minutes at 37 oC with
100 % (v/v) acetonitrile, which was then left for a further 10 minutes for the solvent to evaporate, before rehydrating with 15-25 µl (enough to ensure the gel plug was completely covered) 10 ng/µl sequencing grade trypsin (Roche Diagnostics)/25 mM ammonium bicarbonate. After 1 hour at 37 oC, the tubes were topped up with 15-25 µl of 25 mM
ammonium bicarbonate and returned to incubate overnight. The reaction was stopped by freezing the following morning, and the digested bands were stored at -20oC until required for
mass spectrometric analysis.
2.2.3 Reverse-phase high performance liquid chromatography and tandem mass spectrometry (LC MS/MS)
LC MS/MS was carried out using an LTQ ion trap mass spectrometer (Thermo Fisher Scientific) with an electrospray ionisation source, coupled downstream to an online nano pepMap100 c18 RP column (3 µm, 100 Å, 75 µm i.d. x 15 cm) on a Dionex Ultimate 3000 HPLC system (Dionex). A C18 trapping column (300 µm i.d. x 5 mm) desalted the peptides prior to their entry onto the analytical column, which was equilibrated with buffer comprising of water/2 % (v/v) acetonitrile/0.1 % (v/v) formic acid at a flow of 300 nl min-1.Tryptic
peptides were eluted using a 3 hour programme. Conditions were as follows: a linear gradient of 0-50 % (v/v) acetonitrile/0.1 % (v/v) formic acid over 140 minutes followed by 100 % (v/v) acetonitrile/0.1 % formic acid for 20 minutes and a further 20 minutes of 0 % (v/v) acetonitrile/0.1 % (v/v) formic acid. A 500 fmol µl-1 solution of glufibrinopeptide (m/z
785.8, [M+2H]2+) was used to tune the LTQ. The resulting MS/MS spectra (.raw files) were
25
using the parameters: threshold cut-off 100, group scan default 100, minimum group count 1, minimum ion count 15, peptide tolerance +/- 1.5. These were then merged into search-compatible .mgf files.
2.2.4 Multidimensional Protein Identification Technology (MudPIT)
Sample preparation and MudPIT was carried out at the Yates’ Lab, Scripps Research Institute, La Jolla, CA, USA, by Dr. Helena Prieto. Briefly, tachyzoite pellets (cultured as described in 2.2.1 by Rebecca Norton, Liverpool) were resuspended to approximately 800 µg ml-1 in 100
mM Tris/HCl pH 8.5, lysed by three freeze/thaw cycles and separated into soluble and insoluble fractions by centrifugation for 30 minutes at 16 000 x g. Invitrosol (Invitrogen) was added to the supernatant (soluble fraction) at 1 % (v/v), before it was heated for 5 minutes at 60 oC, vortexed for 2 minutes, denatured with 2 M urea, reduced with 5 mM Tris
(2-carboxyethyl) phosphine hydrochloride and carboxyamidomethylated with 10 mM IAA. Next, 1 mM calcium chloride and trypsin was added at a ratio of 1:100 (enzyme:protein), followed by incubation at 37 oC overnight. The pellet (insoluble fraction) was resuspended in 10 %
(v/v) Invitrosol (Invitrogen), heated and vortexed as before, sonicated for 1 hour, diluted to 1 % (v/v) Invitrosol with 8 M urea/100 mM Tris/HCL pH 8.5, reduced and alkylated as before, then digested with endoproteinase Lys-C for 6 hours. The solution was then further diluted to 4 M urea with 100 mM Tris/HCl pH 8.5 and finally digested with trypsin, as above (2.2.2.4).
26
2.2.5 Analysis of tachyzoite lysate on an Orbitrap Velos mass spectrometer
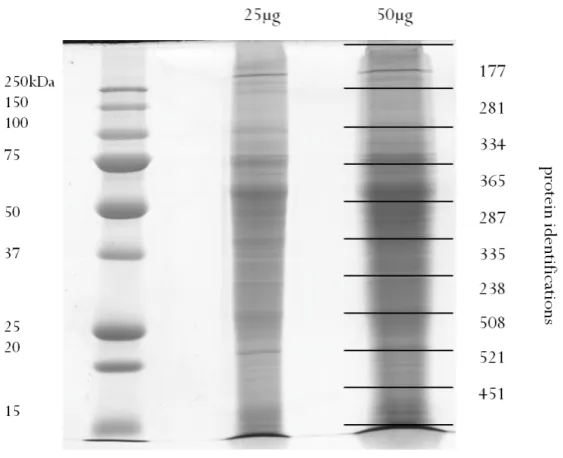
Two different sample preparation approaches were taken as follows: a tachyzoite lysate was prepared and digested ‘in-solution’ prior to analysis in a single run on an Orbitrap Velos mass spectrometer, and 50 µg of tachyzoite lysate was separated on a 10 cm 12 % acrylamide gel prior cutting into 10 bands for in-gel digestion and Orbitrap analysis.
2.2.5.1 In-solution digestion and analysis
A pellet of 1.43 x 10⁸ tachyzoites was solubilised in 200 µl 50 mM ammonium bicarbonate and
then sonicated in a sonicating waterbath at 30 % amplitude for three cycles of 10 seconds on, 50 seconds off. An additional 100 µl was added to the sample and the sonication repeated. The sample was centrifuged at 13 000 x g for 10 minutes at 4 oC and the supernatant collected. A
50 µg aliquot of the sample (as determined by Bradford assay (2.2.2.2)) was diluted in 25 mM ammonium bicarbonate to a volume of 160 µl, prior to the addition of 10 µl 1 % Rapigest (Waters) (0.05 % (w/v) final concentration). The sample was heated to 80 oC for 10 minutes,
with a brief vortex at the half way point; 10 µl of DTT (3 mM final concentration) was added and the sample incubated for 10 minutes at 60 oC, before being cooled to room temperature.
IAA was added to a final concentration of 9 mM and the sample incubated in the dark for 30 minutes at room temperature. Trypsin was added at a 50:1 trpsin:protein ratio and the digest incubated overnight at 37 oC. Trifluoroacetic acid (TFA) was added to a final concentration of
0.5 % (v/v) and the digest incubated for 45 minutes at 37 oC. Finally, the sample was
centrifuged for 15 minutes at 13 000 x g at room temperature and the supernatant collected for subsequent mass spectrometric analysis.
2.2.5.2 1-DE and in-gel digestion
27 2.2.5.3 Orbitrap Velos mass spectrometry
Mass spectrometry was performed by Stuart Armstrong (Liverpool) as follows: peptide mixtures (1 µg) were analyzed by on-line nanoflow liquid chromatography using the nanoACQUITY-nLC system (Waters) coupled to an LTQ-Orbitrap Velos (ThermoFisher Scientific) mass spectrometer equipped with the manufacturer’s nanospray ion source. The analytical column (nanoACQUITY UPLCTM BEH130 C18 15 cm x 75 µm, 1.7 µm capillary
column) was maintained at 35 oC and a flow-rate of 300 nl/min. The gradient consisted of
3-40 % acetonitrile in 0.1 % formic acid for 90 minutes then a ramp of 3-40-85 % acetonitrile in 0.1 % formic acid for 3 minutes. Full scan MS spectra (m/z range 300-2000) were acquired by the Orbitrap at a resolution of 30,000. Analysis was performed in data dependant mode. The top 20 most intense ions from MS1 scan (full MS) were selected for tandem MS by collision induced dissociation (CID) and all product spectra were acquired in the LTQ ion trap. Ion trap and orbitrap maximal injection times were set to 50 ms and 500 ms, respectively.
2.2.6 Protein identification using multiple search engines
The .mgf files resulting from mass spectrometric analysis were either submitted to Mascot (Matrix Science) or to a multiple search engine algorithm (Jones et al. 2009) which employs Mascot, OMSSA (Geer et al. 2004) and X!Tandem (Craig & Beavis 2004; Fenyo & Beavis 2003). To make protein identifications, data was searched against a locally-mounted database comprising the N.caninum gene predictions (various releases (Reid et al. 2012), hosted on ToxoDB (Gajria et al. 2007)). Unless otherwise stated, search parameters were as follows: fixed carbamidomethyl modification of cysteine, variable oxidation of methionine, one missed trypsin cleavage, peptide tolerance ±1.5 Da, fragment ion tolerance ±0.8 Da and peptide charge state of +1, +2 and +3. Target protein identifications at a false discovery rate (FDR) of 1 % were accepted as correct. For data searched using Mascot alone, a cut-off score of 50 was applied.
2.2.7 Assignment of proteins to MIPS Functional Catalogue categories
28
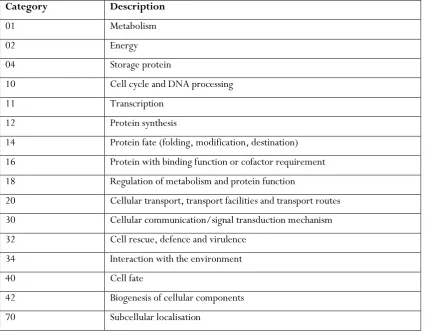
[image:43.595.108.535.319.651.2]functional catalogue and a consensus category assigned. If there was no ‘biological process’ GO term assigned, the ‘molecular function’, followed by ‘cellular component’ GO term was used instead. If there was no GO term, but the gene description on ToxoDB contained information alluding to the function of the protein, then literature searching was employed to qualitatively determine the most appropriate MIPS category. Any protein that was known to be invasion-related was assigned to category 32: cell rescue, defence and virulence. If there was no GO term or other indicator of function on ToxoDB, or in the literature, a Basic Local Alignment Search Tool (BLAST) search (NCBI) was performed to identify possible orthologues for which a function was known. Any proteins for which this yielded no useful result, were assigned ‘unclassified’. Table 2.1 shows the MIPS Functional Categories used for this analysis.
Table 2.1: MIPS Functional Categories
Category Description
01 Metabolism
02 Energy
04 Storage protein
10 Cell cycle and DNA processing
11 Transcription
12 Protein synthesis
14 Protein fate (folding, modification, destination)
16 Protein with binding function or cofactor requirement
18 Regulation of metabolism and protein function
20 Cellular transport, transport facilities and transport routes
30 Cellular communication/signal transduction mechanism
32 Cell rescue, defence and virulence
34 Interaction with the environment
40 Cell fate
42 Biogenesis of cellular components
29
2.3 RESULTS
2.3.1 One dimensional gel electrophoresis (1-DE) and mass spectrometry (LC MS/MS) analysis of whole tachyzoite lysate
[image:44.595.262.370.235.524.2]The 16 cm gel resulting from 1-DE (Figure 2.1) showed good resolution of protein bands and was loaded with sufficient protein to enable downstream detection of peptides. A total of 129 contiguous bands were excised manually and taken forward for tryptic digestion.
Figure 2.1: 1-DE gel of N. caninum whole tachyzoite lysate. Lane one: protein standards, lane 2: 200µg tachyzoite lysate. A total of 129 contiguous bands were excised for tryptic digestion and LC M S/MS as indicated at 5-band intervals in the figure.