ABSTRACT
ARGENTA, CHRISTOPHER FINAN. Recognizing Teams and Their Plans: General Plan Recognition in Multi-Agent Domains (Under the direction of Dr. Jon Doyle).
The ability to observe the actions of individual agents and from those to infer which are working together as teams and what they are attempting to accomplish is the focus of Multi-Agent Plan Recognition (MAPR) research. MAPR is a subset of the Plan, Activity, and Intent Recognition (PAIR) research topic in Artificial Intelligence (AI). Most current MAPR solutions tend to target recognizing activities in specific domains, rely on matching observations to human generated libraries of “sequences to look for”, depend on base rates, and/or forensically analyzing the structures of complete synchronized traces. Our contributions avoid all of these simplifications to the MAPR challenge while focusing on persistent non-interfering teams and team-level goal-oriented plans.
In this research, we extend MAPR research by introducing three new recognition algorithms that are application independent (i.e., general), match observations to planning domain descriptions, and provide on-line recognitions after every serial observation. Our initial algorithm, Event Sequence Alignment (ESA) generates its own plan library and compares it to observations. Our second and third algorithms extend Plan Recognition as Planning (PRAP) to multiple agents with discrete and probabilistic versions of Multi-Agent PRAP (MAPRAP). For each algorithm we detail its design and evaluate its recall, precision, and accuracy as a function of time (i.e., observations) and across three multi-agent domains. We introduce our framework for evaluating and several methods for predicting performance.
© Copyright 2017 Chris Argenta
Recognizing Teams and Their Plans: General Plan Recognition in Multi-Agent Domains
by
Christopher F. Argenta
A dissertation submitted to the Graduate Faculty of North Carolina State University
in partial fulfillment of the requirements for the degree of
Doctor of Philosophy
Computer Science
Raleigh, North Carolina
2017
APPROVED BY:
_______________________________ _______________________________
Dr. Jon Doyle Dr. James C. Lester
Committee Chair
_______________________________ _______________________________
DEDICATION
BIOGRAPHY
ACKNOWLEDGMENTS
I greatly appreciate my advisor Dr. Jon Doyle for his support and patience with me on this long and slow journey. He has committed so much of his time over the years and I have greatly enjoyed our discussions. I was frequently the beneficiary of his insight and I continued to learn from him in so many ways throughout this process.
TABLE OF CONTENTS
List of Tables ... viii
List of Figures ... x
Chapter 1 Recognizing Teams and Their Plans ... 1
1.1 Overview of the Problem ... 3
1.2 Motivation for this Research ... 5
1.2.1 Real-World Applications ... 5
1.3 An Illustrative Example of MAPR ... 7
1.4 What is New in this Research ... 10
1.5 Assumptions and Limitations ... 12
Chapter 2 Background and Relevant Research ... 14
2.1 Recognition: Making Sense of Complex Behaviors from Observations ... 14
2.1.1 Differentiating Plan, Activity, and Intention Recognition (PAIR) ... 14
2.1.2 Classifying the Recognizer/Observer Model ... 15
2.1.3 Knowledge Representation and Reasoning used in PAIR Research ... 16
2.1.4 Multi-Agent Plan Recognition (MAPR): Detecting Coordinated Behaviors ... 22
2.2 Planning Background: Purposeful Agent Behaviors ... 24
2.2.1 Key Concepts from Generalized Planning Research ... 25
2.2.2 Extending Planning to Multi-Agent Teams ... 29
2.3 Goal Recognition Design ... 33
2.4 Challenges for PAIR/MAPR Research ... 34
Chapter 3 Recognition Evaluation Framework ... 37
3.1 Objectives for Recognizers ... 38
3.2 Approach to Recognition Research ... 39
3.2.1 Framework ... 40
3.2.2 Recognizer Interface ... 43
3.2.3 Parametric Evaluation ... 48
3.2.4 General Evaluation Metrics ... 50
3.2.5 Recognition Over Time ... 52
Chapter 4 Domains for Multi-Agent Plan Recognition ... 54
4.1 Assumed Domain Properties ... 54
4.1.1 No Dependency on Base Rates ... 55
4.1.2 Each Goal can be Achieved by a Team of Any Size ... 55
4.1.3 Concurrently Acting but Independent Teams ... 55
4.1.4 Actions that do not Trivialize Recognition ... 56
4.2 Building Problem Instances ... 57
4.2.1 Environment Parameters ... 57
4.2.2 Scene Parameters ... 58
4.3 Domains Studied ... 60
4.3.1 Team Blocks World ... 62
4.3.2 Collector ... 69
4.3.3 Storybook ... 77
Chapter 5 Event Sequence Alignment ... 86
5.1.1 Using a Planner to Generate a Plan Library ... 90
5.1.2 Comparing the Plans Synthesized by Different Planners ... 93
5.1.3 Assessing Similarity with Globally Sequence Alignment ... 97
5.1.4 Specific Assumptions and Limitations for ESA-based Recognizer ... 99
5.2 Sequence Analysis of Plan Libraries for Domain Characterization ... 100
5.2.1 Sequence Distinctiveness and Convergence from a Plan Library ... 100
5.2.2 Sequence Entropy over a Plan Library ... 103
5.2.3 Event Sequence Alignment and Clustering and Total Observed Variation ... 104
5.2.4 Overall Domain Characterizations... 106
5.2.5 Other Applications of ESAC and TOV Research ... 106
5.3 Recognition Results ... 107
5.3.1 Summary of Results for ESA Recognition ... 108
5.3.2 Conclusions ... 110
5.3.3 Detailed Results Focusing on Differences in Domains ... 112
5.4 Run-Time Performance Assessment ... 122
5.5 Specific Challenges and Future Work ... 126
Chapter 6 Discrete Multi-Agent Plan Recognition (MAPRAP) ... 128
6.1 Approach to Recognition ... 130
6.1.1 Extending PRAP to Teams ... 132
6.1.2 Run Time Performance and Pruning the Search Space ... 133
6.1.3 Specific Assumptions and Limitations of MAPRAP ... 135
6.2 Recognition Results ... 136
6.2.1 Summary of Results of MAPRAP Recognition ... 137
6.2.2 Conclusions ... 139
6.2.3 Detailed Results Investigating Domains and Team Compositions ... 142
6.3 Run-Time Performance Assessment ... 149
6.4 Specific Challenges Future Work ... 151
Chapter 7 Probabilistic Multi-agent Plan Recognition as Planning (P-MAPRAP) ... 152
7.1 Approach to Recognition ... 154
7.1.1 Scoring Consistency between Hypothesis and Observations ... 156
7.1.2 Prioritizing Highest Scoring Interpretations ... 157
7.1.3 Recognizing In Degraded Conditions ... 158
7.1.4 Specific Assumptions and Limitations of P-MAPRAP ... 159
7.2 Recognition Results ... 160
7.2.1 Summary of Results for P-MAPRAP Recognition ... 161
7.2.2 Conclusions ... 163
7.2.3 Detailed Results Investigating Domains and Team Compositions ... 165
7.3 Effects of Dropped Observations Recognition Results ... 172
7.3.1 Summary of Results for P-MAPRAP with Dropped Observations ... 172
7.3.2 Conclusions for P-MAPRAP with Dropped Observations ... 175
7.4 Effects of Suboptimal Team Plans on Recognition Results ... 176
7.4.1 Summary of Results for P-MAPRAP with Suboptimal Team Plans ... 177
7.4.2 Conclusions for P-MAPRAP with Suboptimal Team Plans ... 180
7.5 Run-Time Performance Assessment ... 181
Chapter 8 Conclusions and Future Work ... 184
LIST OF TABLES
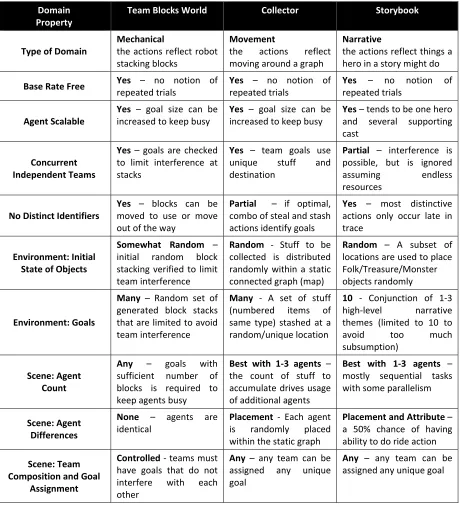
Table 1. Inputs and outputs of our recognizers. ... 3 Table 2. Comparison of the properties of our three evaluation domains. ... 61 Table 3. Actions in Graphplan solutions tend to have higher efficiency (fewer inactive steps)
and more agent interdependencies on actions (bold blue). This plan has a partial order length of 8 and a total order length of 18 (serialized). ... 94 Table 4. Actions in JavaFF solutions tend to have reasonable total order lengths (22) but poor
agent efficiency (lots of white space), fewer agent interdependencies (blue), and
occasional superfluous actions (red). ... 95 Table 5. Actions in JFFTK solutions tend to be more efficient than JavaFF (e.g., 13 vs 22
actions) but still focuses on the total ordering, missing opportunities to better distribute the ... 96 Table 6. Example Alignment of Two Action Sequences. Agents are anonymized (struck out
in text). We weight skips and mismatches (red/italics) both as 0 and matches as 1. When shown aligned, sequences with fewer gaps relative to their length will get better scores. Since ESA is an on-line recognizer, the observation sequence is frequently shorter; normalizing the similarity score on the shortest sequence ensures no penalty for
incomplete observations... 98 Table 7. Counts of number of cases (n) for each combination of planner (vertical) and
domain (horizontal). ... 108 Table 8. Descriptive statistics for planner run-time to generate plan library for TeamBlocks
problems. ... 124 Table 9. Descriptive statistics for planner run-time to generate plan library for Collector
problems. ... 125 Table 10. Descriptive statistics for planner run-time to generate plan library for Collector
problems ... 126 Table 11. We generated 100 cases for each domain with each number of agents, team
distributions were randomly assigned. After eliminating instances where planning runs were timed out (during either simulation or recognition) we had 1081 scenarios across all three domains. These are the n values for all graphs in this section. ... 137 Table 12. We generated 100 cases for each domain with each number of agents, team
distributions were randomly assigned (Note: same cases as in Chapter 6). After eliminating instances where planning runs were timed out (during either simulation or recognition) we had 1118 scenarios across all three domains. These are the n values for graphs in this section. ... 161 Table 13. We compared instances with dropped observations to the instances in the previous
section, the total number of scenarios with dropped observations was 355, but we executed each 4 times with random dropping making 7055 instances with dropped observations. These are the n values for all graphs in this section. ... 172 Table 14. Thee n values for all graphs in this section separated by domain and degree of
LIST OF FIGURES
Figure 1. A standard Blocks World layout includes randomly stacked blocks and a crane (agent) that rearranges them to its goal. ... 8 Figure 2. Multi-agent Team Blocks World extends the domain to include multiple cranes. In
this case all of the agents are on the same team with a single shared goal of “BGM”. .... 8 Figure 3. There can also be multiple teams, each with their own unique joint goal. In this case
two teams. ... 9 Figure 4. The same observerables but with an alternative complement of teams. This time
there are three teams. ... 9 Figure 5. Three unique interpretations for the same observered state. The left most
interpretation includes all of the agents on a single team with the goal “MGB”. The center interpretation includes two partial interpretations, each with two agents on each team. The right most interpretation includes three partial interpretations, two of which include only a single agent. ... 9 Figure 6. Example event taxonomy showing graphical and logical representations. The sX()
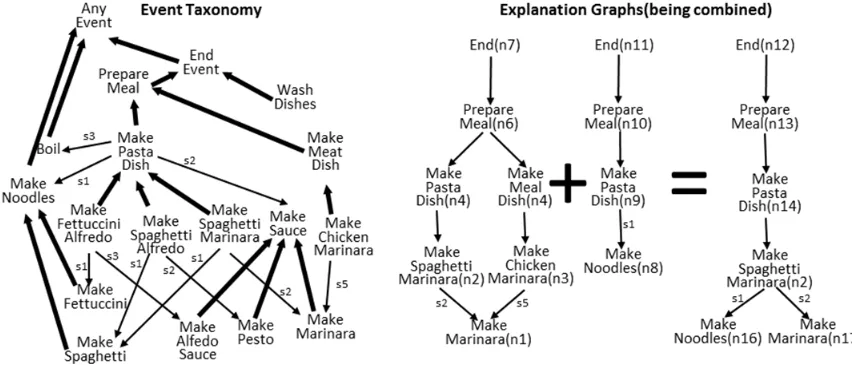
functions represent temporal ordering as steps. (Picture from [12]) ... 17 Figure 7. Example cooking domain event taxonomy and the explanation graphs for the
observations MakeMarinara(n1) and MakeNoodles(n8) being combined to infer a plan (Pictures from [12]).[There should be a link between MakeSauce and AnyEvent that is not shown in the event taxonomy that was not included in the original publication.] ... 17 Figure 8. Example PRN with plan knowledge represented by unordered sets of sub-actions
(steps) and the objects on which they act. (Picture from [15]) ... 18 Figure 9. The same PRN as Figure 8 with additional evidence (Picture from [15]) [I believe
there should be a link between (inst rob4 rob-) and (inst go1 go-) that is not shown in the original publication.] ... 19 Figure 10. Dynamic Bayesian Network showing the possible actions taken over time and
locations over time being condition to the current quest. (Picture from [16]) ... 19 Figure 11. Hierarchy of Policies/Subgoals combining joint and individual goals within a
single timeslice... 23 Figure 12. HTN example with only partial observation of the primitive actions. ... 27 Figure 13. Possible observed sequences from the same partial order plan (assumes AND
relation) ... 27 Figure 14. Cooperative agents with shared goals and interleaved actions can be challenging
to recognize because the actions expected to complete goals can be distributed between agents. ... 32 Figure 15. A grid movement domain with two goals (A and B). In the initial environment
(left) plans to achieve goal A or B cannot be distinguished until the 5th
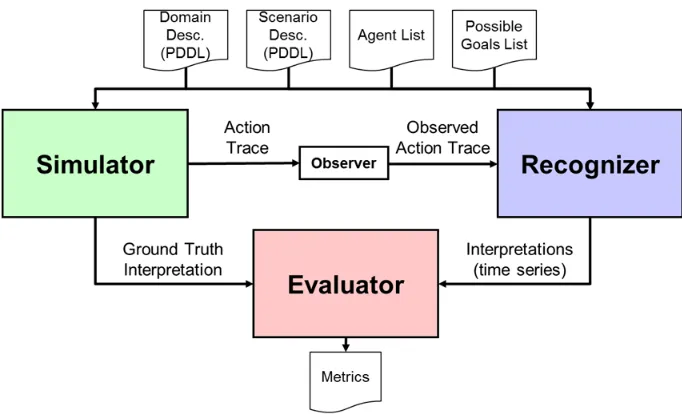
movement/action when the agent is nearing the goal (in the worst case). On right, a modification (grey box) to the environment forces more distinctive movement/action traces to reach goals. ... 34 Figure 16. Our framework for evaluating recognizers includes components that simulate,
Figure 17. As shown notionally, we expect accuracy and precision to start low and increase over time, while recall would ideally remain at 1 throughout the trace unless agent plans are highly non-optimal. ... 52 Figure 18. Graphical representation of Team Blocks World domain. The lettered blocks are
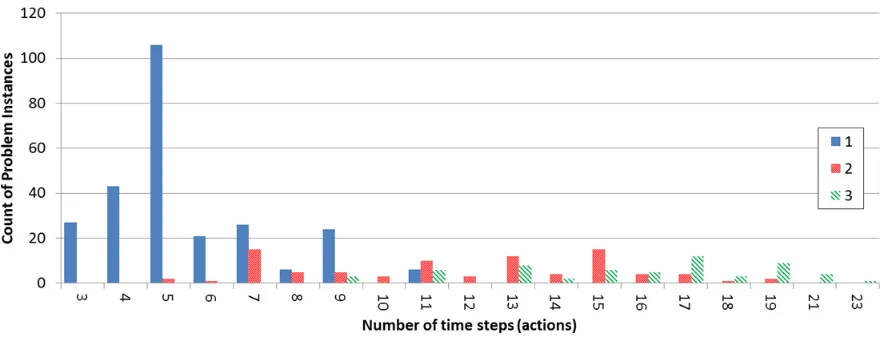
stacked on a table and grippers manipulate them to form the desired (goal) stack. ... 62 Figure 19. Histogram of simulation trace length for Team Blocks domain given number of
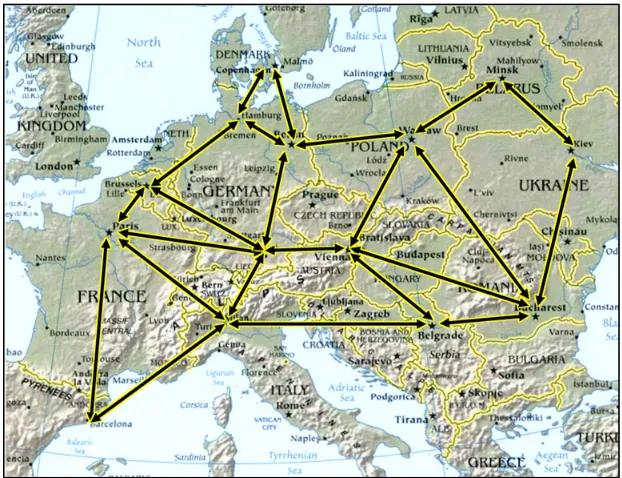
teams. Each team has a unique goal, so more teams corresponds to more total actions being executed (team actions are randomly interleaved in trace). ... 67 Figure 20. Map of Europe overlaid with Collector Movement Graph. During generation of
problem sets, the agents and various stuff objects are randomly positioned on the map at one of the vertices (i.e., selected major cities). ... 69 Figure 21. Histogram of simulation trace length for Collector problems given number of
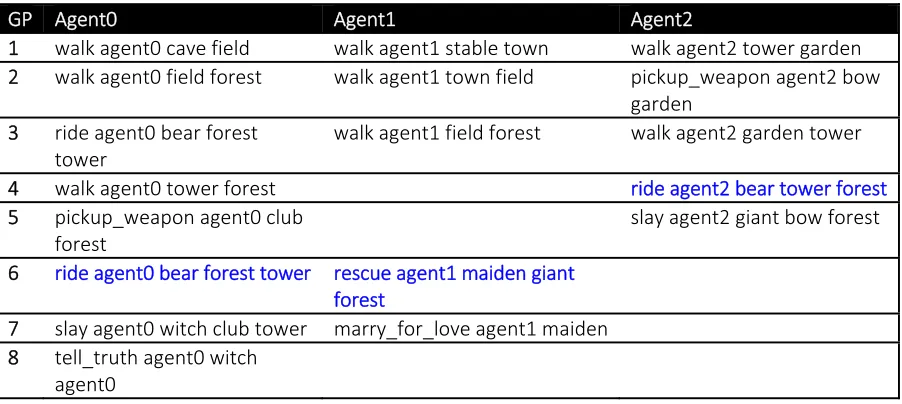
teams. Each team has a unique goal, so more teams corresponds to more total actions being executed (team actions are randomly interleaved in trace). ... 76 Figure 22. Graph of paths in Storybook with objects, animals, and monsters. ... 77 Figure 23. Histogram of simulation trace for Storybook domain length given team
composition. Each team has a unique goal, so more teams corresponds to more total actions being executed (team actions are randomly interleaved in trace). ... 85 Figure 24. Overview diagram of ESA-based MAPR with labeled steps. ESA has a
pre-processing step that generates the plan library using the JFFTK TopK planner, subsequent steps perform event sequence alignment and repeat for each observation. ESA is slow to initialize, due to TopK planning, but quick to process each observation. ... 88 Figure 25. Two planners (yellow) are used for each method, shown on right. For all cases
JFFTK(k=200) generates multiple plans that we use to build the Plan Library used by the Recognizer (blue). In each method, we change the planner used by the Simulator (green) to produce the Observer Action Trace that the Recognizer must identify. The table on left enumerates the three methods compared. ... 91 Figure 26. We compute distinctiveness by loading the plan library into a tree, collapsing
common prefix sequences. We compute entropy at each node and level (or time step) of the tree. Metrics for distinctiveness reflect when entropy=0. ... 101 Figure 27. Distinctiveness of sequences representing all plans generated for all goals and
compositions within an environment. For these sets of solutions, the expected case is relatively close to the worst cases, which suggests that early stage plan recognition using these plan libraries would have low precision. Storybook is unusual because most cases completely finished without converging to a single interpretation. ... 102 Figure 28. The Sequence Entropy for each domain (with stderr). Storybook has the highest
sequence entropy (i.e., most difficult to recognize) and Collector has the lowest (i.e., easiest to recognize). ... 104 Figure 29. Total Observed Variation measures the variety in a set of sequences, we believe
Figure 30. Summary of ESA by simulation planner showing Recall (a), Accuracy (b), Precision (c), and the similarity score of the top interpretation over time (d). Each method shows a unique pattern. ... 109 Figure 31. The Recall results for ESA using the same planner for simulation and recognition
were surprising. One might intuitive expect recall to improve with additional
observations, but in two of the domains (Collector and Storybook) recall actually goes down over time. This suggests that action sequences for Teamblocks were distinctive, where the plans synthesized by JFFTK for Storybook and Collector had actions
sequences in common. ... 113 Figure 32. Accuracy of ESA using JFFTK increased over time for all domains, with a small
dip in Teamblocks around 75% of the trace. This increase indicates incorrect interpretations were consistently being eliminated (excepting the dip). Accuracy in Storybook was consistently lower than the other domains, which is consistent with its low precision. ... 114 Figure 33. Precision of ESA with JFFTK suggests that false positives are generally being
reduced over time (with Storybook being more flat than the others). ... 115 Figure 34. Increasing Recall over time is misleading (appears positive) because it suggests
that although ESA often not selecting the correct interpretation early in the trace, the correct answer was found later. However, a corresponding reduction in Accuracy tells us that Recall improved simply because more interpretations with lower alignment similarity scores because ESA was unable to find any high-scoring matches in the plan library. ... 116 Figure 35. The Accuracy of recognition when the trace was produced by JavaFF was low and
often decreasing over time. This occurred because the ESA recognizer was not finding matches for the observations in the plan library, and additional observations reduced the alignment similarity score for those few early alignments it did find. TeamBlocks traces had the same effect but were shorter (fewer observations in each 10% of trace) overall. ... 117 Figure 36. Precision was very low when comparing a JavaFF plan to the JFFTK(k=200) plan library. This indicates that there were many false positives at every time step, which was caused by all of the similarity scores dropping. ... 118 Figure 37. When simulation traces are synthesized by Graphplan, Recall of ESA (using a
JFFTK-based plan library) suffers and it often fails to find the correct interpretation. Interestingly, in this case, there are incorrect interpretations that more closely align with the observations. ... 119 Figure 38. The Accuracy of ESA increases over time for all benchmarks, which indicates that
incorrect interpretations are being identified as such. Given the dip in recall and high max score ... 120 Figure 39. Precision for ESA with Graphplan traces generally improve over time, which
indicates that we are reducing the number of false positives. Storybook was an
exception in that it remained fairly flat. ... 121 Figure 40. Comparison of planner run-time to generate plan library for TeamBlocks
Figure 41. Comparison of planner run-time to generate plan library for Collector problems. ... 125 Figure 42. Comparison of planner run-time to generate plan library for Collector problems
... 126 Figure 43. The overview diagram of the MAPRAP recognizer with numbered steps and
descriptions. The external interfaces match our other recognizers, but MAPRAP tracks feasibility of partial interpretations and efficiently updates this assessment for new observations by executing a hypothesized planning problem and comparing its cost to the baseline cost. ... 130 Figure 44. The mean accuracy of recognition for MAPRAP shows each domain has a unique profile - MAPRAP quickly achieved high accuracy for Collector, while Storybook was more challenging to eliminate interpretations. ... 138 Figure 45. A comparison of the average precision of MAPRAP for all team compositions
across all domains. As expected, precision is low early in the trace and improves. The distinct differences between trajectories suggests that the Collector domain had the most distinct action sequences, followed by TeamBlocks, and trailed by Storybook. ... 139 Figure 46. Accuracy of MAPRAP on TeamBlocks cases was high with significant
improvements in the first 40% of the trace. Cases with more agents (and thus more potential interpretations) we able to eliminate incorrect interpretations at a higher rate ... 143 Figure 47. Precision over time for MAPRAP on TeamBlocks domain. Precision increases
with additional observations over time. The single agent case consistently has the highest precision (averaging 1 by the end of the trace). MAPRAP was able to best eliminate false positives in cases with fewer agents on each team (more observations per agent)... 144 Figure 48. Accuracy of MAPRAP on the Collector domain was consistently high. Cases with
more fewer agents (and therefore fewer potential interpretations) were slower to
eliminate incorrect interpretations. ... 145 Figure 49. Precision for MAPRAP recognition of Collector domain showed the single agent
case performing best more of the time, but the other cases being close. All cases with a single agent per team reach 1 (eliminated all false positives). The worst precision was observed when there were fewest actions observed for each agent. ... 146 Figure 50. Accuracy of MAPRAP on Storybook had the widest spread of results. Cases with
a single team (less actions required per agent) tended to have lower accuracy suggesting it was harder to eliminate interpretations with fewer observations per agent. ... 147 Figure 51. Precision of MAPRAP for Storybook problems was consistently low with the
single agent case consistently showing the best results. These low precision values indicate that MAPRAP was not able to eliminate many of the false positives for this domain, which is consistent with overlapping goals and few differentiating actions. . 148 Figure 52. The run-time performance of MAPRAP for each domain and team composition
Figure 53. MAPRAP with Conservative Pruning (A) effectively prunes the multi-agent search space well below the exponential worst case. MAPRAP with Aggressive Pruning (B) reduces the average runs/goal/time for scenarios to near the single agent worst-case (1). Single agent scenarios also benefitted from pruning. Picture and data from [5] ... 151 Figure 54. Overview diagram of Probabilistic MAPRAP showing the steps of the recognition process. P-MAPRAP has the same external interfaces as the other recognizers with the primary design difference being the ranking of full interpretations (compared to pruning done by discrete MAPRAP)... 154 Figure 55.Scores in the interpretation queue over time for a simple 3 agents and 3 goals
example. On the left, all of the consistency scores are shown (color scale is green = high and red=low). The right shows, only the set of (highest scoring) interpretations that forced plan synthesis to calculate consistency of a partial interpretation given the new observations. ... 157 Figure 56. The left side shows the process by which interpretations are prioritized and
updated with new observations. The right side is a plot of the number of updates made (log10 scale), which drops as more observations are received because the prioritization differentiates the more likely from the less likely interpretations. ... 158 Figure 57. The mean accuracy of recognition for P-MAPRAP shows each domain has a
unique profile, and that the curves are very similar to those of MAPRAP. ... 162 Figure 58. A comparison of the average precision of P-MAPRAP for all team compositions
across all domains. Like MAPRAP there is precision is low early in the trace and improves monotonically... 163 Figure 59. Accuracy of P-MAPRAP on TeamBlocks was very similar to MAPRAP. Cases
with more agents (and thus more potential interpretations) we able to eliminate incorrect interpretations at a higher rate ... 166 Figure 60. Precision over time for P-MAPRAP on TeamBlocks domain. The precision
increases more significantly later in the trace and for more team compositions. The 1 Agent / 1 Team consistently showed the highest precision. ... 167 Figure 61. Accuracy of P-MAPRAP on the Collector domain was consistently high as was
MAPRAP. Convergence occurred quickly for this domain, which is consistent with our domain characterizations. ... 168 Figure 62. Precision for P-MAPRAP recognition of Collector domain showedt. ... 169 Figure 63. Accuracy of P-MAPRAP on Storybook had a similarly wide spread of results but
were higher than MAPRAP. Cases with a single team improved from MAPRAP, but still tended to have lower accuracy. ... 170 Figure 64.Precision of P-MAPRAP for Storybook problems was consistently low but slightly
improved from MAPRAP. Single agent cases continued to show the best results
probably due to fewer interpretations in general. ... 171 Figure 65. Recall for P-MAPRAP with dropped observations across all domains shows any
Figure 66. Overall Accuracy of P-MAPRAP with dropped observations shows lower accuracy with less information. The ordering of these conditions is consistent with the
degree of dropped observations. ... 174
Figure 67. Overall Precision of P-MAPRAP with dropped observations shows that precision is increased when there are some observations dropped. This was a surprising result that suggests that dropping a few observations can reduce false positives. ... 175
Figure 68. Recall across domains shows that 70%, 80%, and 90% inefficiencies were relatively indistinguishable and trended on a downward trajectory. This is likely best explained by the differences in planners since the suboptimal traces were simulated using JFFTK(k=200) and recognized with Graphplan, essentially the reverse of ESA cases. ... 178
Figure 69. Accuracy across domains shows relatively high accuracy. The ordering of the accuracy generally corresponds to the level of efficiency of the plans in the traces. ... 179
Figure 70. Precision across domains shows generally low precision and flat trajectories on suboptimal cases; this indicates that P-MAPRAP was less able to reduce false positives even with additional observations. ... 180
Figure 71. The run-time performance of P-MAPRAP for each domain and team composition normalized. Like MAPRAP, problems with many agents on the same team tended to require more plans to be synthesized. ... 182
Figure 72. Detailed ESA results for Method A on TeamBlocks. ... 192
Figure 73. Detailed ESA results for Method A on Collector Domain. ... 193
Figure 74. Detailed ESA results for Method A on Storybook Domain. ... 194
Figure 75. Detailed ESA results for Method B on TeamBlocks Domain. ... 195
Figure 76. Detailed ESA results for Method B on Collector Domain. ... 196
Figure 77. Detailed ESA results for Method B on Storybook Domain. ... 197
Figure 78. Detailed ESA results for Method C on TeamBlocks Domain. ... 198
Figure 79. Detailed ESA results for Method C on Collector Domain. ... 199
Figure 80. Detailed ESA results for Method C on Storybook Domain. ... 200
Figure 81. Recall for P-MAPRAP on TeamBlocks was very high but not perfect, indicating that dropping some actions does result in errors in recognition. ... 201
Figure 82. Accuracy of P-MAPRAP with dropped observations on TeamBlocks domain shows an early lower accuracy with partial recovery later in the trace. As expected more dropped observations resulted in lower accuracy. ... 202
Figure 83. Precision for P-MAPRAP for TeamBlocks with dropped observations shows that dropping has a higher impact on the later stage recognition as fewer false positives are eliminated. ... 202
Figure 84. Recall for P-MAPRAP for Collector was perfect despite dropped observations. This was likely due to there being inherent dependency between movement actions (e.g., you can’t move from A to B until you get to A)... 203
Figure 86. Precision for P-MAPRAP with dropped observations for Collector also showed dropping observations resulted in the expected reduction in precision, but remained general high. ... 204 Figure 87. Recall for P-MAPRAP on Storybook trended the lowest of the domains. It also
shows a spread, however the order here is the opposite of what was expected – likely due to lower confidence in the overall recognition. ... 205 Figure 88. Accuracy of P-MAPRAP with dropped observations in Storybook show imperfect
traces can have either higher or lower accuracy than perfect. This is due to missing context more aggressively deprioritizing interpretations and that (more often than not) reducing false positives. ... 205 Figure 89. Precision of P-MAPRAP with dropped observations for Storybook was general
low and showed little consistent differences based on observations being dropped. ... 206 Figure 90. Recall of P-MAPRAP for TeamBlocks with Suboptimal Team Plans drops
significantly... 207 Figure 91. In Teamblocks, suboptimal team plans appear to group into pairs of similar
accuracy trajectories, we believe this is an artifact of shorter traces and paired actions. As expected, the further agent plans got from optimal, the lower the accuracy of
recognition tended to be. ... 208 Figure 92. Precision of P-MAPRAP with suboptimal team plans for TeamBlocks. It was
surprising to see an early increase in precision for the 60% suboptimal traces, this suggests that some inefficiencies helped recognition, although note n=14. ... 208 Figure 93. Recall for P-MAPRAP with suboptimal team plans for Collector. Notice, for 90%
and 80% efficiencies, there is a dip in recall, but it is recovered later in the trace, this indicates that the correct interpretation was deemed unlikely at one point until additional actions were observed and it became the top score again. ... 209 Figure 94. Accuracy for P-MAPRAP with suboptimal team plans in the Collector domain
showed a high accuracy with surprisingly good results for the two 70% cases. There were no 60% cases generated for this domain by JFFTK(k=200). ... 209 Figure 95. Precision for P-MAPRAP with suboptimal team plans for Collector domain shows
a slightly higher precision early on for 80% and 90%, but a relatively flat trajectory. In the 70% inefficiency case (n=2) there were high false positives early on and failure to identify the correct interpretation later on. ... 210 Figure 96. Recall for P-MAPRAP for Storybook with suboptimal team plans shows a
significant decline over time for all suboptimal traces. Note, recall was also problematic for ESA between JFFTK and Graphplan, so this decline could be attributed to
differences in the planners instead of inefficient agent activity. ... 211 Figure 97. Accuracy for P-MAPRAP with suboptimal team plans for Storybook domain was
relatively high. At termination of the trace, accuracy reflected the efficiency order directly, but prior to that they varied. ... 211 Figure 98. Precision for P-MAPRAP with suboptimal team plans for Storybook was
Chapter 1
Recognizing Teams and Their Plans
Imagine looking through binoculars at strangers in the distance that appear to be hard at work doing something and asking yourself “What the heck are they doing?” People will often observe a situation like this, watch individual actions taking place over time, attempt to make sense out of (or recognize) what they have seen, and posit what may occur next. This recognition capability is essential for establishing situational awareness, understanding how to act appropriately in a given context, and explaining the activities that are being observed to others. Recognition is generally considered an abductive reasoning task that uses some model of the situation to infer an explanation for the observations made. Identifying what is going on in a scene is the subject of Plan, Activity, and Intent Recognition (PAIR) research [1] in Artificial Intelligence (AI). Multi-Agent Plan Recognition (MAPR) is the application of these techniques to making sense of group behaviors.
range of situations that as more observations are received our interpretations improve according to measures of precision, accuracy, and recall over time.
In the remainder of Chapter 1 we detail the formulation of our research problem (Section 1.1) and motivations for this work (Section 1.2) including applications. We then present an illustrated example of a MAPR problem based on a well-known planning domain (Section 1.3). The final sections describe our claims about what is new in this research (Section 1.4) and our assumptions and limitations (Section 1.5).
In Chapter 2, we survey the relevant background and most directly related research in the literature. This is still a new research area, so each example of existing research addresses a unique set of requirements. We discuss how our approach is similar and different from these.
We specify our methodology for analyzing recognizers, including key metrics and problem considerations in Chapter 3. We present a novel approach for assessing the relative difficulty in recognizing goals in different domain problems. In Chapter 4, we detail our three benchmark domains: Team Blocks World (a mechanical task used in most MAPR research), Collector (a movement domain), and Storybook (a narrative-focused domain).
We then present the three new MAPR recognizers we have developed in this research: (1) Event Sequence Alignment (ESA) recognition in Chapter 5, (2) discrete Multi-Agent Plan Recognition as Planning (MAPRAP) in Chapter 6, and (3) Probabilistic Multi-Agent Plan Recognition as Planning (P-MAPRAP) in Chapter 7. For each recognizer, we provide a detailed description of its approach and complete evaluation results.
Finally, we give our conclusions and future work in Chapter 8. Our main conclusion is that our techniques general on-line MAPR feasible but computationally expensive. We compare the results across our recognizers and discuss benefits and limitations of each. We then provide recommendations for how to build on this research and address its limitations.
1.1
Overview of the Problem
The research problem addressed by this proposal is summarized below (also see Table 1):
Given a multi-agent domain description, scenario descriptions, and sequence of observed agent actions infer the organization of teams and their respective goal and plan. Table 1. Inputs and outputs of our recognizers.
Given Inferred
Domain Description (with possible goals)
Scenario Description (with set of agents)
Serialized Observations of Agent Actions
Teams (set of affiliated agents)
Goal of each Team
A Plan for each Team to Achieve its Goal (that explains observations seen so far)
Given Inputs. We formulate the MAPR problem based on the following three inputs: a domain description, a specific scenario description, and a sequence of observed actions.
The domain description ensures that our solution remains general (i.e., supports any properly specified domain problem). For this research we focus on logical domain problems describable with the widely used Plan Domain Description Language (PDDL) [2] and allow translation from Multi-Agent PDDL (MA-PDDL) [3]. The domain description includes a representation of the state of the world (with closed world assumption) that can be modified based on actions performed. The domain includes a full description of all possible actions that agents can perform (sometimes called an action model). Each action is parameterized to include the agent performing the action. Actions are specified to include preconditions (clauses that must be true for the action to be performed) and effects (clauses modified when the action is performed). The domain description also includes a list of all possible goals, and the specification of any agent types if appropriate. Together these three components of the domain description provide the specification of the range of possibilities for a problem.
problem format. It specifies the initial state of the world existing before any agent actions take place. The scenario description also includes the complete and fixed list of the agents involved, but no indication of their team affiliations. Any attributes of agents are also set as part of the scenario or initial state. The list of agents is static and gives us the total count of agents that must be assigned to teams in any valid interpretation.
The sequence of observed actions is a serial trace of the actions performed in the order they are performed. These actions must be consistent with the rules of the domain description. The recognizer accepts the observed actions, one at a time- this prevents the recognizer from relying on action synchronization to determine cooperation. The sequence of observed actions can be incomplete (i.e., observations dropped) with the understanding that the lack of an observation does not mean that the action did not actually take place. Each observed action in the sequence is parameterized with the agent that performed the action along with any other input parameters in the action model.
Outputs. The required output for the problem is a set of interpretations, which provide both a team assignment for every agent, the goal of each team in the interpretation, and a plan that is consistent with that goal and the observations to date. Since we are interested in an online capability, the recognizer outputs the set of interpretations after each observation is processed.
Each interpretation includes the composition of each suspected team. We define “team” as a set of agents that share a joint goal. The actions of agents within a team are assumed to be cooperative in support of the goal and coordinated among the members of the team. There can be any number of teams as long as each team has at least one agent affiliated, and each agent is on exactly one team. As such, an agent can be on a team alone. There are an exponential number (bell(number of agents) [4]) of possible team compositions.
and through a sequence of prescribed actions that achieves the goal. These prescribed actions must be consistent with the domain description, and be executed by the agents assigned to the team. The action sequence of the plan must be consistent with all of the previously observed actions, while adding actions that were unobserved and are anticipated in the future.
1.2
Motivation for this Research
An AI system that can recognize what other agents are doing, infer how they are organized, and better predict future actions and states will be in a superior position for helping others, preventing issues, resolving threats, explaining situations, and determining which of these behaviors is the most appropriate. The maximum value of recognition is achieved when the activities can be correctly identified early in their execution, so online recognizers that interpret the scene continuously after each observation are desirable even when early answers are less precise. Second, determining when agents are working together as a team is useful when these lines are not obvious (e.g., a team uniform) because it provides the context for individual actions. Finally, exposing the plan underlying a sequence of actions allows us to put meaning to observations, and use that meaning to better understand previous and predict future behaviors. This research in MAPR is designed to operate online, identify team structures, and recognize the execution of plans.
1.2.1 Real-World Applications
The proposed research is relevant for solving a range of real-world challenges that require inferring the goals and/or organizations of cooperating agents. We outline five potential application areas that will be served by the outcome of this research.
life and identify cases that do not appear to follow these patterns. Meanwhile, the agents being observed act deceptively by minimizing their deviation from normal behavior patterns. Threats can be masked by as series of activities that are only out of the ordinary when looked at together. Furthermore, when threats are realized, these programs are used forensically to identify what happened and who might have participated in the activity.
Advancing MAPR technology could enable new approaches to wide area surveillance that are based on identifying likely goals and cooperation for all observed activities. Each goal could be labeled with the threat it constitutes, if any. Directing attention to potential threats earlier in their execution and identifying all individuals involved enables law enforcement to intervene in a more effective and efficient manner.
Insider Threat Detection. Insider threats represent a serious security challenge because the individual involved is already in a trusted position. For example, employee(s) that are working against organizational policies to steal money or information. While most insider threats (caught to date) consist of a single individual, they can hide from monitored activities through social manipulation, cyber-identity theft, and leveraging the trust/oversights of others thus obscuring the activity by dividing them among multiple participants. Advancing MAPR technology could enable automated systems to uncover complex multi-agent interactions that may result in notable situations that warrant investigations.
Intelligent Game Playing and Monitoring. Many games, such as massively multiplayer online games, allow players to develop complex strategies that potentially involve multiple players (or potentially players controlled by the same person). Understanding how these strategies are unfolding over time and the parts different agents play in the activities would allow a game AI to compete more effectively with human players. Similarly, in some environments an AI that monitored game play to ensure players were acting consistent with the game expectations/rules would be valuable. Advancing MAPR technology could allow game AIs to better anticipate the potential actions and strategies of players and teams.
significant so as to tailor their explanations towards the ultimate goal and infuse the narrative with intentions even when they are not directly observed. For example, the sentence “He is heading towards the house, probably to get the flashlight so he that can see in the cave.” is more informative and expressively rich than the direct observation “He is heading towards the house.” For multiple agent scenarios, giving inferred purposes in commentary explains a series of actions over multiple agents. Advancing MAPR technology could allow AIs to automatically narrate complex multi-agent activities with intentionality, and detect when their inferred explanations are wrong and make appropriate corrections.
In addition to real-world applications for MAPR, solutions developed to solve key parts of this research problem may be applied to other problems that require searching large state spaces and producing a set of feasible interpretations. In many of these applications, it is more important to ensure that the correct answer is in the set of interpretations outputted rather than give a single interpretation. Recall takes priority over precision and accuracy.
1.3
An Illustrative Example of MAPR
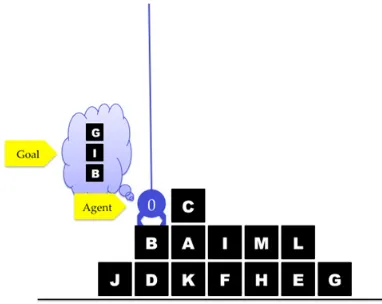
To clarify and introduce the concepts, consider the AI domain “Blocks World” as an illustrative example. In Blocks World, a robot gripper rearranges a set of lettered blocks stacked on a table, as shown in Figure 1. The robots actions are atomic and include: pickup, unstack (pickup from atop another block), put down (on table), stack (put down atop another block). The goal is for the robot to rearrange blocks into a stack in a specified sequence.
Blocks cannot be picked up if other blocks on top of them, and can only be stacked from bottom to top - so an AI controlling the robot gripper must plan the sequence of block manipulations correctly to achieve their goal. Goals are random letter sequences of various lengths interpreted from bottom (on table) to up (clear). Letters are not repeated in a goal. For example, (and (ontable B) (on I B) (on G I) (clear G)) specifies the goal “BIG”.
plan together and act collaboratively towards the same goal.
Figure 1. A standard Blocks World layout includes randomly stacked blocks and a crane (agent) that rearranges them to its goal.
Figure 2. Multi-agent Team Blocks World extends the domain to include multiple cranes. In this case all of the agents are on the same team with a single shared goal of “BGM”.
We parameterize each action with the agent performing the action and the block(s) involved. We also added several domain predicates to prevent agents from attempting to pick up blocks held by other agents. Since we plan teams independently, we partition the blocks and goals to avoid conflicting plans. However, no information about teams (count or sizes), partitioning of blocks, or goals assignments are known to the recognizer.
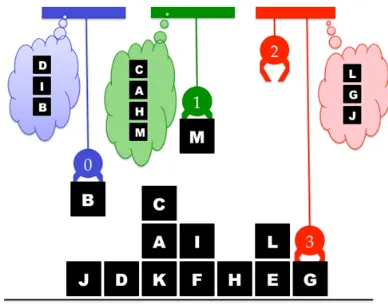
In Team Blocks there can be multiple teams, with each team having at least one agent, and each agent having exactly one team. Figure 3 shows a scenario with two teams (blue and red), each with a unique goal, and each with two agent members. Single agents can also exist simply by allowing teams to have a single member (Figure 4).
Figure 3. There can also be multiple teams, each with their
own unique joint goal. In this case two teams. Figure 4. The same observerables but with an alternative complement of teams. This time there are three teams.
An “interpretation” is a possible explanation that includes a full assignment of teams, the agents on each team, and the goals the joint goal for each team. The interpretations for the above cases are given in Figure 5. There can be many feasible interpretations, particularly early in the trace when there is less information to constrain them. A Recognizer must consider all possible interpretations for teams and goals, and identify those that are feasible given the sequence actions observed up to that time.
For any specific scene, there is only one correct interpretation. When evaluating the recognizer we look at the feasible or most likely interpretations and determine: if the correct answer is among them (recall), if there are many false positives (precision), and if we have eliminated many the infeasible or unlikely interpretations (accuracy). The remainder of this document describes our research designing, building, and evaluating such recognizers.
Other Domains. In this research we use the Team Blocks and two other domains. Team Blocks is structured around ordering mechanical operations and identical agents. Collector is a movement-oriented domain with agents starting in multiple locations. Storybook is a narrative domain where agents may have different skills and motivations. These three domains were designed to sample different potential issues for recognition, comparing results across all of them helps use ensure that our recognizers are robust and general purpose. More on these domains can be found in Chapter 4.
1.4
What is New in this Research
This research includes a formulation of MAPR for jointly inferring teams and their plans/goals over time. Specifically, our formulation is for online multi-agent/multi-team recognition using a planning domain vice a human generated plan library and base rates. We have developed three novel recognizers capable of addressing this MAPR challenge:
• Event Sequence Analysis (ESA) recognizer automatically generates a case-based plan library with our custom heuristic TopK planner (JFFTK) and then performs sequence alignment to compare observations to the plan library cases. We analyzed ESA using multiple trace simulation methods to identify new challenges in multi-agent scheduling causes with (generated) plan libraries (Chapter 5).
• Probabilistic Multi-Agent Plan Recognition as Planning (P-MAPRAP) recognizer scores hypothesized teams/goals by consistency with observations and prioritizes plan synthesis over time to focus recognition on the most likely interpretations [7]. This is our most flexible recognizer, it gets perfect recall for optimal traces but we also use it to analyze the effects of dropped observations and suboptimal traces (Chapter 7).
To parametrically analyze our recognizers, we developed an evaluation framework that generates/simulates scenarios, executes online recognizers, and evaluates MAPR performance. We have evaluated each recognizer within this framework against a large problem set spanning three distinct multi-agent domains (see Chapter 4):
• TeamBlocks is a multi-agent version of Blocks World domain that is currently the standard domain for evaluating MAPR solutions (see Section 0).
• Collector is our new multi-agent domain based on team movement through a graph as agents steal and stash treasures. Collector results in longer traces with more distinct action sequences than TeamBlocks (see Section 4.3.2).
• Storybook is our new multi-agent domain based on generating a narrative story in which teams of agents slay monsters, get rich, find love, and have honor. Storybook produces the longest and most challenging to recognize traces (see Section 4.3.3).
Additionally, we investigated techniques to characterize MAPR domains. We have implemented three metrics for estimating the difficulty of recognition based on a prior analysis of a corpus of traces (which we generate from the domain description using JFFTK):
• Sequence Entropy is new metric we created to summarize the diversity in the ordering of actions in traces. In our MAPR results, higher sequence entropy is correlated with better recognition performance (Section 5.2.2).
• Total Observed Variation (TOV) is a metric we created using Event Sequence Analysis and Clustering (ESAC) to estimate the relative amount of variation in a corpus of sequences [8]. In our MAPR results, lower TOV correlated with better recognition performance (Section 5.2.3).
We generated a large set of test problems using our domains and evaluated each of our recognizers. Our results include online performance measures showing early-stage (just a few observations) through final-stage (all available observations) recognition performance. For each evaluation case, we provide recall, accuracy, and precision curves over time which can serve as benchmarks for future team-oriented MAPR research.
1.5
Assumptions and Limitations
In this research, we make the following assumptions that reduce the scope of the problem:
Keyhole Observations
We assume that the agent’s actions are not influences by the observer/recognizer in any way. We do not interrogate or test the agents directly. Likewise the agents are not attempting to deceive the observer.
No Team Interference
We assume that teams of agents do not interfere with the plans of other teams. We have controlled/partitioned the environment to avoid unintentional interference between teams without providing additional clues to team affiliation. While we would like to relax this limitation, competition between agents introduces additional degrees of freedom.
Agent Use For some combinations of initial state, goal, and team composition an optimal solution may not require the use of all of the agents on the team. Particularly, early on in the recognition only some of the agents might have acted (i.e., no round-robin or turn-taking). Initially, we eliminated non-acting agents in analysis; however in an online system this skews the early stage results, so now we acknowledge the lower precision.
Sensor Interfaces
We assume an abstract method of sensing the actions observed in the scene, and do not model sensor details. We do not perform computer vision to extract actions from video or other sources. We do not model uncertainty or error in observations (except missing). In this research, we simply assume an observation is correct and complete, or not given at all.
Metric and Non-Classic Domains
There is a very wide range of research into automated planning. This includes domain descriptions and planners that aim to optimize on different aspects of the plan. We assume that a classical planner is used to minimize the cost of the plan where cost is the total number of actions performed to achieve the goal.
Deliberate Actions
We assume that the agents observed in the scene are acting deliberately and reasonably to achieve a goal. Agents performing random actions or according to a set of equations would have no plan to recognize, so we do not consider that case. Likewise, agents that are acting highly sub-optimally are not recognized well. Acting deceptively may be also be interpreted as having two goals (open vs hidden) and are not in scope.
Doubling
Up We assume that all agents are on a single team. They may be the only
agent on that team, but they may not be on multiple teams. Likewise, we assume that each team has a single goal.
Learning Domains
Chapter 2
Background and Relevant Research
2.1
Recognition: Making Sense of Complex Behaviors from Observations
There is considerable research in automated recognition of complex behaviors from observables. There are also many specific applications and challenges being investigated in isolation. Because our intent is to pursue the generalized case, we borrow concepts and solutions from a wide range of work, including other generalized research. In the following sections we scope these concepts, survey relevant research, and discuss research that helps extend the general case to multiple agents.
2.1.1 Differentiating Plan, Activity, and Intention Recognition (PAIR)
The outputs of PAIR algorithms fall roughly into three categories: Plan, Activity, and Intent. The distinction is based on behavioral information recovered from observation.
Plan Recognition
Activity
Recognition Activity Recognition (AR) focuses on identifying specific behaviors
from observations. Observables for AR are often sensor inputs (e.g. cameras) and actions tend to be physical (e.g. movement). AR does not attempt to determine the plan or purpose behind an activity. This scope reduces the amount of knowledge required and makes fewer demands on the range of actions being observed. For example, discrete activities can be identified within the actions of a randomly acting agent without requiring a purpose. The boundary gets blurred between PR and AR for complex activities.
Intent/Goal Recognition
Plans are designed to achieve goals, so when we recognize a plan in PR, we also get its goal and intention. In Intention/Goal Recognition we only identify the intention, goal, or class of goals; making it amenable to simple abductive classification. In many applications, this is sufficient. This high-level recognition is also useful for reducing the search-space for a PR system.
2.1.2 Classifying the Recognizer/Observer Model
An observer model defines the interaction between recognizer and agents. Cohan et al. [9] identified two types for plan recognition: “intended” where the agent wants to communicate its plan to the observer and “keyhole” where agent is unaware of the observer. Geib [10] introduced “adversarial” recognition where agents attempt to hide their plans from the observer.
adapt their plan to include interaction with the recognizer. This technique can be applied to applications such as intelligent tutoring systems and automated support systems.
Adversarial Agents try not to be understood. Adversarial interactions between observer and subject agent is a variation of intentional PR where Agent may attempt to deceive the observer. Determining the actual plan of the agent requires assessing the validity of observations, and filtering deceptive plans. Meanwhile, the agent adapts its plan based on being observed. Applications for these techniques include security monitoring.
Keyhole Agents are unaware they are being observed. In keyhole plan recognition, the agents do nothing specific to aid or deceive the recognition because they do not know they are being observed (e.g., a hidden camera observing activity in a park). The observer does not interact with the agent. The result is that the only observables are those resulting from the actions that the agent elects to use to carry out their plan. Applications here include covert surveillance, automated narration, and robot control through populated environments.
In this research, we focus exclusively on keyhole recognition.
2.1.3 Knowledge Representation and Reasoning used in PAIR Research
In this section we present relevant PAIR research by the inference they employ: Logical, Probabilistic, Hybrid (logical/probabilistic), Grammar Parsing, and Planning as PR.
2.1.3.1 Logic-Based Plan Recognition
include other types of events. Action and event taxonomies are essentially symbolic plan libraries (Figure 6), which included all possible plans.
Figure 6. Example event taxonomy showing graphical and logical representations. The sX() functions represent temporal ordering as steps. (Picture from [12])
The inference in Kautz’s approach identifies minimal explanations for observations (expressed as existential assertions) as both top-level explanations (those facts entailing End) and explanation graphs (e-graphs) as shown in Figure 7. Goldman, Geib, and Miller [14] also incorporated logical rules and representations while introducing probabilistic approaches to selecting the most likely (vice the minimal) explanations.
2.1.3.2 Bayesian Network Base Plan Recognition
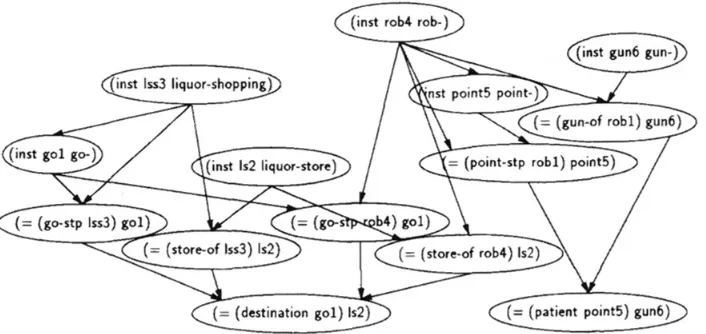
Charnaik and Goldman [15] addressed story understanding using abduction in a Bayesian plan recognition network (PRN). Statements of a story are analogous to a sequence of observations, and explanation is an understanding of the plan. Their solution starts with a logic-based representation of knowledge about plans and actions, which is used to generate the most likely potential plan elements. These grounded elements are added to a BN representing probabilities of events and plans.
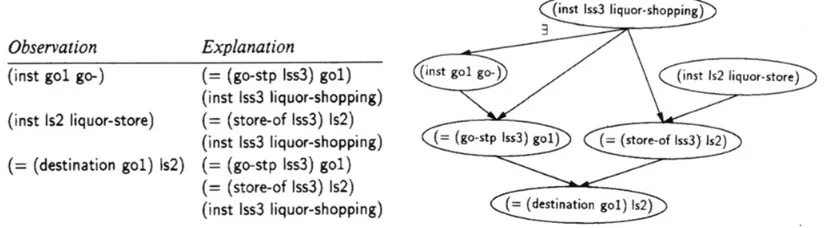
Plan knowledge is represented by unordered sets of sub-actions (steps) and the objects on which they act. In their implementation this knowledge has “slots” which are “filled” by other knowledge in the system. As shown in Figure 8, the observations and potential explanations are graphically represented.
Figure 8. Example PRN with plan knowledge represented by unordered sets of sub-actions (steps) and the objects on which they act. (Picture from [15])
Figure 9. The same PRN as Figure 8 with additional evidence (Picture from [15]) [I believe there should be a link between (inst rob4 rob-) and (inst go1 go-) that is not shown in the original publication.]
Albrecht [16] developed a keyhole PR system using Dynamic Bayesian Networks (DBN) that observed player activities in a Multi-User Dungeon (MUD) environment. The recognizer identifies a player’s quest by observing their actions in the environment. As shown in Figure 10, the DBN includes variables for actions and locations over time ( and ) which can predict the players next moves or actions given that they are performing a given quest ’ ( represents a previous quest). The ( ’| ) for observed times ( ) represents the probability the player is on quest Q’. For future ’s, ( | ’) and ( | ’) predict the steps
for accomplishing ’. Given all possible quests , ( | ) generates a
ranked list of candidate quests.
A myriad of goal/intention recognition solutions have been suggested using probabilistic inference. The simplest are based on naïve Bayesian networks where possible observations are conditional independent given a goal or intention. The advantage of such an approach is quick reasoning to rank candidate goals/intentions, which could make such an approach useful for pruning or prioritizing potential plans for recognition.
2.1.3.3 Markov Logic for Activity Recognition
Markov Logic (ML) combines logical representations with probabilistic confidences and generates a grounded Markov network from which it makes inferences[17]. Biswas et al [18] and Tran and Davis [19] both used ML for activity recognition. In both models, lower-level computer vision fed uncertain facts (observations) to the higher-level activity reasoning system. Biswas addressed a single agent, while Tran and Davis observed multi-agent activity and performed basic identity maintenance.
Recent work by Sadilek and Kautz [20] performed multi-agent activity recognition using position traces collected during instrumented games of capture the flag. Sadilek and Kautz observed that GPS sensor accuracy was insufficient to detect tagging incidents within traces, but by watching behavior subsequent to a suspected tag they could infer tagging events with higher accuracy.
2.1.3.4 Plan Recognition Through Grammar Parsing
Vilain introduced the use of parsing for plan recognition [21] by building on Kautz’s [11] logical approach. In his thesis “Probabilistic Grammars for Plan Recognition,” [22] Pynadath applies probabilistic state-dependent grammars to represent plan patterns and build probabilistic inference networks for plan recognition. Geib and Goldman [23] approached plan recognition in PHATT with a grammar that tracked pending actions to structure hidden Markov models. Geib et al. [24] also presented YAPPER as an implementation of plan recognition in which the plan library is represented as a probabilistic frontier fragment grammars and inference as a rewriting system.
avoiding observation), partially ordered plans, and multiple goals. The flexibility of this approach makes it attractive for less rigidly structured plans.
2.1.3.5 Plan Recognition as Planning (PRAP)
Ramirez and Geffner introduced Plan Recognition as Planning (PRAP) as a generative approach that does not require a plan library. To date, they have released three incremental papers describing symbolic [26], probabilistic [27], and partially observed Markov process (POMP) [28] approaches.
Symbolic Approach. Unlike traditional plan recognition methods that require a large plan library, PRAP [26] works with the same planning domain used to generate plans. This approach generates and compares plans for reaching goals. Observations are translated to ordered interim goals (e.g. waypoints) that we know the observed agent has accomplished. This produces a new domain theory that extends the original with operations to enforce the given ordering (operators set values that are preconditions for the next operator) and with a final result that is required for the new goal states. These new operators have no additional cost (e.g. time or step counts).
If we assume P is the original plan theory, and P’ is the modified theory. We then generate optimal plans for every goal under both P and P’. If, for any goal, the optimal cost under both P and P’ are the same, than the observations can be explained as pursuing that goal. Unfortunately, this method requires generating two plans for every possible goal, and when using optimal planners large problems could take a long time. Interestingly, good results were also demonstrated with more scalable suboptimal planners.
A Boltzmann distribution is produced for cost differences of all goals and normalized. In the case of uniform priors, the most likely goals are those that minimize the cost difference for achieving the goal with and without explicitly meeting the observed subgoals. The observed subgoals are implemented as a fluent which is true if and only if the actions match observables to the current time. This does not combine multiple plans. So even if there are many optimal plans and only one satisfies the observables, its probability is not reduced. Rameriz and Geffner’s recent work [28] extends PRAP to Partially Observable Markov Processes.
2.1.4 Multi-Agent Plan Recognition (MAPR): Detecting Coordinated Behaviors
In 2001, Intille and Bobick [29] developed an activity recognition system for multi-agent systems using American football as the domain. This system recognized plays in a library from pose and speed sensor data from individual players. They noted two key challenges in migrating from single agent to multi-agent activities. First, the combination of agents significantly inflates state and feature spaces making exhaustive comparisons impossible. Second, detecting coordination patterns in temporal relationships of actions is critical for complex multi-agent activities. In abstracting their temporal relationships they used a subset of Allen’s Interval Algebra [13] for ordering dependencies. They relied on Bayesian networks for reasoning, generating a graphical network for each play, and took advantage of “reset points” (i.e., downs) provided by the football domain allowing short activities.
Figure 11. Hierarchy of Policies/Subgoals combining joint and individual goals within a single timeslice.
In both of these examples, multi-agent activities are identified from a library of possible hierarchies by the temporal correspondence between individual agent actions.
2.1.4.1 Leveraging Complex Coordinated Agent Behaviors
In addition to concurrency of actions, coordination and interaction between agents can be characterized by other means. For example, Sadilek and Kautz [20] collected data for multi-agent activity recognition by instrumenting players in a Capture the Flag game with GPS trackers. Because of GPS accuracy limitations, they could not detect activities such as players tagging each by simply detect temporal co-location. Instead, they detected a tagging event by its effect (tagged player must remain stationary until tagged again). While their focus was improving noisy observations, such an approach could be used to detect unobservable actions or compensate for dropped observations.
Sukthankar and Sycara [31] used coordinated actions to prune the multi-agent plan library by matching observed structure within coordinated traces to structures within the library. In their formulation of the problem, sub-plans start by recruiting a dynamic team to cooperate in an action. They built a hash table mapping key observerable sequences that distinguish sub-plans (i.e., last action of parent and first of sub-plan). A simple lookup reduces the search into the plan library. While the recruiting and splitting of teams cannot be directly observed, the sequences allow them to be inferred.
2.1.4.2 Detecting Agent Affiliations with Entity Resolution
example, actions are uninteresting until they are observed within the context of the plan. In these cases, we need to identify agents whose traces fit a suspected role, which is a form of probabilistic entity resolution [32] based on the rules of the planning domain.
Banerjee, Kraemer, and Lyle [33] propose a MAPR solution based on flattening HTNs in the plan library and matching patterns with the synchronized observation stream. They extend existing algorithms that detect these patterns over all combinations of agents. By finding a match, they resolve sub-goal being performed and coordinated agents. This approach however, requires either a simple agent assignment model, or grounding all possible assignments as unique patterns.
A third approach also combines team resolution and activity recognition using domain-specific characteristics. Sukthankar and Sycara [34] compared physical positioning patterns to expected formations. By identifying agents assembled in formation, they infer cooperation and prune the search space for activities in which they might be engaged.
2.1.4.3 Multi-Agent Plan Recognition (MAPR) from an Action Model
In 2012, Zhuo, Yang, and Kambhampati developed a MAPR tool called DARE that inferred goals and team composition jointly [35]. DARE solves MAPR as a constraint satisfaction problem using a MAX-SAT solver. The domain description (or action model) was first analyzed to extract the causal-links based on the dependencies between actions, these became hard constraints. The observations were also used to create hard constraints, as a solution must fit the domain and the observations. Soft constraints were developed around variables indicating likelihoods that agents were on the same team. Solving the MAX-SAT problem provided the goals that explain the observations and the teams. Zhou expanded on DARE in 2014 to handle missed observations [36]. This research has the most in common with our own because it jointly solves the team and goal problems. However, it was not an online system, and used a very different approach than we present here.
generation of behaviors with an emphasis on answering two questions:
1) How does planning relate to the information we might recover from observations?
2) How can planning and simulation be used to evaluate the performance of recognition systems?
2.2.1 Key Concepts from Generalized Planning Research
The planning problem can be summarized as establishing a (partially or totally ordered) sequence of actions that transforms the current (initial) state to a desired (goal) state. The generalization of planning refers to the fact that the representation used to describe states and actions is not specific to particular domain problems. Planning is a well-researched and highly specialized field of AI, and the short overview here is strictly intended to provide a basis for our plan recognition objectives.
2.2.1.1 General Plan Domain Representations
General plan domain representations allow us to decouple the subject matter domain (representation) from the reasoning element of planning. Two important general plan domain representations are STRIPS and PDDL.
STRIPS The STanford Research Institute Problem Solver (STRIPS) [37] provides a FOL-based representation of initial and goal states and a series of action rules. Each action rule includes a name, preconditions (logical statements that must be true for the action to be executed), and postconditions (logical statements that are set to true when the action is executed).