Differing proportions of “express saccade makers” in
different human populations
Nabin Amatya
1, Qyong Gong
1,2, Paul C. Knox
31. Huaxi MR Research Centre, Department of Radiology, Centre for Medical Imaging,
West China Hospital, Sichuan University, Chengdu, China
2. Department of Psychiatry, State Key Lab of Biotherapy, West China Hospital,
Sichuan University, Chengdu, China
3. Directorate of Orthoptics and Vision Science,
University of Liverpool, Liverpool, UK
Running title: Express saccade makers
Keywords: saccades, express saccades, latency, fixation
Corresponding Author:
Dr Paul C. Knox
Division of Orthoptics
University of Liverpool
Thompson Yates Building
Brownlow Hill
Liverpool L69 3BX
Tel: 0151 794 5736
Fax: 0151 794 5781
[email protected]
Abstract
Debate continues about cultural influences on processes such as perception and memory. One underlying assumption is that high level, top down influences that differ between populations (culture) act on identical brain structures and functions to produce different behaviours. More specifically, it has been reported that in various types of complex visual task, eye movement patterns differ systematically between Chinese and non-Chinese subjects. We investigated a relatively simple behaviour (reflexive eye saccades), comparing the saccade latency distributions of Chinese and Caucasian subjects. In a task in which the fixation target remained illuminated when the saccade target appeared (overlap task), 10 out of 34 (29%) Chinese subjects exhibited a high proportion (>30%) of low latency “express” saccades. This pattern of response had been reported to be very uncommon in healthy, naive subjects. We therefore subsequently confirmed that only 1 out of 38 Caucasian subjects exhibited it. The results suggest important population differences with regard to the expression of distinct oculomotor behaviours.
Introduction
The hypothesis that culture affects cognitive and perceptual processes, producing measurable differences in behaviour (Nisbett and Miyamoto 2005), has been supported by results suggesting that eye movement patterns differ between Chinese and Caucasian subjects when looking at complex scenes (Chua et al. 2005). While this particular result has proved difficult to replicate (Evans et al. 2009) it is assumed to provide evidence that different top down influences acting on essentially the same lower level structures can produce measurable differences in behaviour. How similar is low level, reflexive, eye movement behaviour in Caucasian and Chinese subjects?
Reflexive saccades are fast movements of the eyes which can be described quantitatively using well defined parameters such as amplitude, gain, peak velocity and duration (for reviews see Leigh and Kennard 2004; McDowell et al. 2008). Saccade latency has also been studied extensively. Saslow (1967) demonstrated that the introduction of a temporal gap (a blank period) between central fixation target offset and eccentric saccade target presentation reduced saccade latency in humans (the “gap effect”). This finding was confirmed in non-human primates (Fischer and Boch 1983). Gaps also encouraged the production of a particular class of low-latency, visually-guided “express” saccade (ES). ES formed a distinct peak in saccade latency distributions in monkeys (Fischer and Boch 1983; Schiller et al. 1987), but only occasionally did so in humans, leading to considerable controversy (Kalesnykas and Hallett 1987; Wenban-Smith and Findlay 1991; Fischer and Weber 1993; Kingstone and Klein 1993). However, in the monkey, it was shown that they were critically dependant on the integrity of the superior colliculus (Schiller et al. 1987). Single unit recording demonstrated that they occurred when a general reduction in collicular inhibition allowed preparatory activity to reach a level where the visual (target onset) response burst in saccade-related neurons triggered saccades directly. This was contrasted with the more usual pattern of activity in which the visual burst was followed (later in time) by a second motor burst which triggered the saccade (Edelman and Keller 1996a; Dorris et al. 1997). These findings provided evidence that ES are a neurophysiologically distinct type of saccade.
In humans, this level of analysis is not available, so ES have been defined operationally in terms of latency. While this is complicated by the fact that saccade latency is modified by many factors, and is dependent on task design, saccades with latency in the range of 80ms to 120ms can reasonably be considered to be ES (for a more extended review see Delinte et al, 2002).
Despite the heterogeneity of tasks and definitions in the literature there is a consensus that when healthy, naive subjects are tested with the gap paradigm, with randomisation of direction and fixation time, ES are encouraged. In contrast, in overlap tasks in which the central fixation target remains illuminated when the saccade target is presented, ES are suppressed and the proportion observed falls to near zero. However Cavegn and Biscaldi (1996) described a normal healthy adult subject who produced almost exclusively ES in gap conditions, and a high proportion of ES (>65%) in overlap conditions. They estimated that such “express saccade makers” (ESMs) made up less than 1% of the healthy, adult population. A subsequent study reported a similar low rate of occurrence (estimated as 1%-5% of the healthy adult population) and on the basis of the results of a battery of saccade tasks in a group of 10 ESMs, suggested that they had a general problem suppressing reflexive saccades (Biscaldi et al. 1996; see also Kimmig et al. 2002).
system, particularly with respect to reflexive responses, is constructed in essentially the same way across the whole human population. However, we report here observation that in a group of Chinese subjects, we encountered ESMs much more frequently than expected.
Materials and Methods
Ethical approval
Experiments were conducted with the approval of the ethics committees of the West China Hospital and the University of Liverpool. All subjects provided their informed consent and the experiments were performed in accordance with the ethical standards laid down in the Declaration of Helsinki (as modified 2004).
Subjects
A total of 72 healthy, naïve, adult subjects with normal or corrected to normal visual acuity were recruited and tested. Of the 72, 34 were recruited from staff and students of, and tested in, the West China Hospital, Chengdu, China. The median age of this group was 27y (range 21y-46y), and 11 (32%) were male. All were Han Chinese. A second group of 38 Caucasian (white British) subjects were recruited from Merseyside (consisting mainly of staff and students of the University of Liverpool) and tested in the University of Liverpool. The median age of this group was 28y (range 17y-57y), and 14 (36%) were male.
Apparatus and stimuli
Horizontal eye movements were recorded binocularly with the same miniaturized head-mounted infrared saccadometer (Advanced Clinical Instrumentation, Cambridge, UK) in both Chengdu and Liverpool. This samples infrared reflectance signals at 1KHz, and low-pass filters them at 250 Hz with 12-bit resolution. The device incorporates three low-power red lasers projecting red 13 cd/m2 spots subtending approximately 0.1°, in a horizontal line, centrally and at 10° to left and right of centre. As the stimuli move with the head, subjects were not head-fixed.
Two types of tasks were run in separate blocks of 200 trials. In gap tasks, after a randomised fixation period of 1s-2s, the central fixation target was extinguished 200ms prior to the appearance of the saccade target, presented randomly 10° either to the right or left. In overlap tasks, the central fixation target remained illuminated throughout the trial. Again, after the randomised fixation period the saccade target appeared. Regardless of trial type, all subjects were instructed to saccade to the eccentric target as soon as it appeared, pause, blink and then return their gaze position to the centre in preparation for the next trial.
Experimental Procedures
Experiments were run in the Centre for Medical Imaging, West China Hospital, Chengdu, China, and the Directorate of Orthoptics, University of Liverpool. One of the authors (PCK) was present during testing in both locations, and we sought to standardise both procedures and circumstances. In both locations, subjects sat comfortably approximately 1m from a matt white surface. Each subject completed four runs (two gap, two overlap) of 200 trials, with the order of runs randomised. Thus each subject provided a maximum of 400 gap and 400 overlap trials. Breaks were given as necessary between runs to prevent fatigue.
Analysis
Data were stored on the Saccadometer handset and downloaded offline via an optical/USB link using supplied software (Latency Meter 4.0) before further collation and analysis of saccade latency and amplitude using MS Excel. Statistical analysis was performed using SPSS 16.0. For the bulk of the latency analysis, only saccades with latencies of between 50ms and 500ms were included. We defined express saccades (ES) as saccades with latency in the range 80-120ms, and an ESM as a subject in whom greater that 30% of saccades in overlap tasks had latency in the ES range.
RESULTS
Chinese group
(M: 127±33ms; F: 123±28ms; t=0.4, p>0.05) or overlap (M: 170±41ms; F: 169±32ms; t=0.1, p>0.05) conditions.
When saccade latency distributions were examined for each subject, a surprising number of subjects exhibited essentially a single peak centred on 100ms in gap conditions (Figure 1b,c). Further, in overlap conditions, this peak persisted (Figure 1e,f). There was also a bimodality in the distributions of some subjects in overlap conditions accompanying an early peak centred on 100ms (eg Figure 1f). Frequency distribution histograms of saccade latency in overlap conditions, ordered by median latency, are shown for the Chinese subjects in Figure 2.
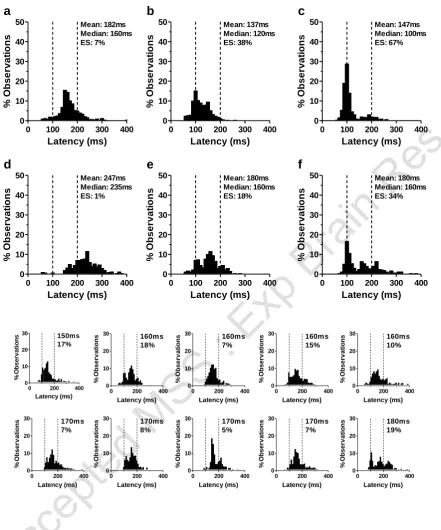
Early peaks in saccade latency distribution have been taken to be indicative of express saccades (ES). Finding such prominent peaks in overlap conditions implied a high proportion of saccades with latency in the express range (80-120ms). Using the criterion from previous studies of >30% ES in overlap conditions to differentiate “express saccade makers” (ESMs) from “normal” subjects, 10 of the 34 subjects, (29%; 6/24 females, 4/10 males) met the criterion. The latency distributions in overlap conditions from these ten subjects comprise the first two rows in Figure 2. In addition to the median latency of each subject, the percentage of ES is also shown in Figure 2. We computed the mean percentage of ES for ESMs and normal subjects for both overlap and gap conditions. For the ESM group, the mean percentage of ES was 42±8% in overlap conditions and 50±23% in gap conditions. For normal (ie non-ESM) subjects it was 14±9% in overlap conditions and 21±14% in gap conditions.
Caucasian Group
The 38 Caucasian subjects yielded 13432 gap and 14382 overlap trials (88±11% and 95±10% of gap and overlap trials respectively). Latency was 204±32ms in overlap trials reducing to 138±19ms in gap trials (t=10.8; p<0.001; df=37). As for the Chinese group, gender did not influence latency in either gap (M: 133±20ms; F: 140±18ms; t=1.2, p>0.05) or overlap (M: 212±45ms; F: 200±30ms; t=1.0, p>0.05) conditions. Examination of saccade latency distributions for overlap tasks (see Figure 3) revealed few with peaks centred at 100ms. Only one of 38 subjects had greater than 30% ES in overlap conditions (Figure 3f) meeting the ESM criterion. For the 37 non-ESM subjects, the mean proportion of ES in overlap conditions was 6±6%, and 27±20% in gap conditions. Figure 3 shows the overlap distributions for the 10 Caucasian subjects with the lowest median latency (in addition to the single ESM; Figure 3f). For the single Caucasian ESM, the proportion of ES were 34% and 67% in overlap and gap conditions respectively.
Comparison of groups
As is clear from the above results there was a distinct gap effect on saccade latency for both groups, as well as shifts in the distribution of latency. We compared the distribution of median latency for the two groups in gap and overlap conditions (Figure 4). This suggested that it was overlap conditions in which the two groups differed most. This conclusion was strengthened when the distribution of the percentage of ES observed was compared (Figure 5), where again the prime difference between the groups was in overlap conditions (Figure 5b vs d). As also described above, in the Chinese group a much larger number of subjects continued to exhibit high percentages of ES in overlap conditions. When these ES data were tested using ANOVA, with group (Chinese vs Caucasian) as a between subjects and task (gap vs overlap) as a within-subjects factor, both group (F1,70=5.6, p=0.02) and task (F1,70=54.6, p<0.001) were
statistically significant; importantly there was a significant interaction between factors (F1,70=13.0,
p=0.001).
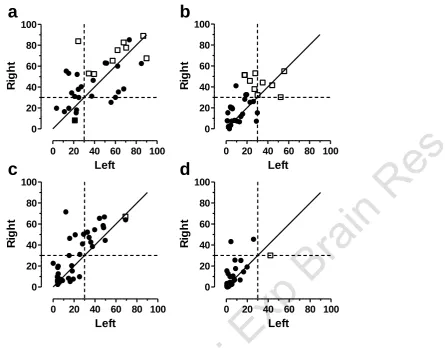
We investigated the influence of target direction on the production of ES by calculating the percentage of ES in each subject for each direction separately (Figure 8). We found that there tended to be a higher proportion of ES when the target was on the right. A repeated measures ANOVA was run, with direction (left v right) and condition (gap vs overlap) as within subjects factors and group (Chinese Normal v Chinese ESM v Caucasian) as between subjects. Note that as there was only one ESM in the Caucasian group, this subject was not included as a separate group, and their data were excluded from the analysis. Direction (F1,68=97.2; p<0.001) and condition (F1,68=16.0; p<0.001) were both statistically significant with
no interaction between them. Group (F2,68=29.1; p<0.001) was also statistically significant. The tendency
for a higher proportion of ES to the right, was observed in both Chinese (Figure8a,b) and Caucasian (Figure8c,d) groups. In overlap conditions, the primary difference between the groups was not a general difference over all subjects. The non-ESMs in both groups (Figure 8b,d, filled data points) were broadly comparable. It was the large numbers of Chinese ESMs (Figure 8b, open squares) which differentiated the Caucasian and Chinese groups.
There appeared to be some subjects (3 Chinese and 2 Caucasian) who produced more than 30% express saccades in one direction, while not reaching the ESM criterion (>30% ES, combining left and right). However, in the cases of the two Caucasian subjects, there were problems during data collection with their rightward data. The total number of rightward saccades in these subjects was 37 and 44, compared to the mean number of rightward saccades for the Caucasian group of 181±39. So their rightward ES proportions should be treated with caution. In contrast, the three Chinese subjects who had >30% ES to the right, provided 194, 190 and 178 rightward saccades; the mean number of rightward saccades for the Chinese group was 183±27.
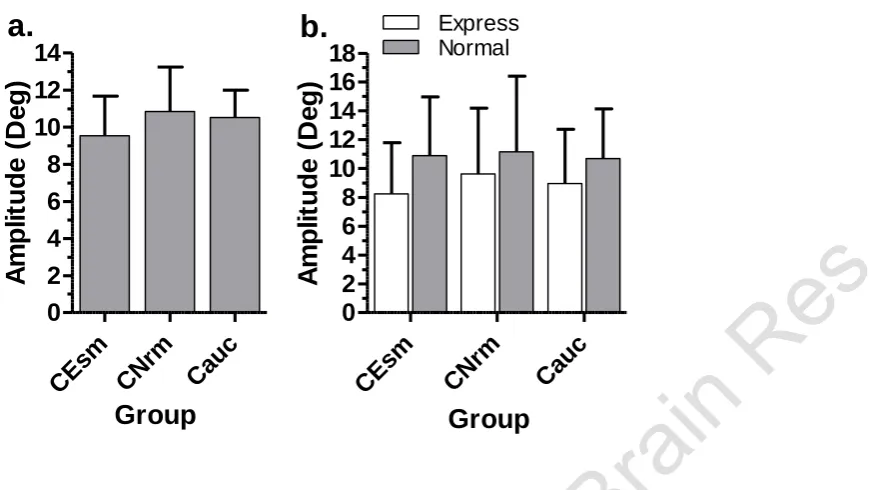
We investigated the amplitude of saccades in overlap tasks, as it was overlap conditions which discriminated between ESMs and normal subjects, and produced the clearest difference between the groups (Figure 9). The mean amplitude of all saccades with latencies in the range 50ms-500ms was 10.8°±2.4° in the Chinese Normal and 10.5°±1.5° in the Caucasian group (Figure 9a); for the ESM group it was slightly reduced (9.5°±2.1°). However, a one-way ANOVA showed no statistically significant difference between the amplitudes (F2,68=1.62; p=0.21). For the three subject groups, we then segregated
saccades based on their latency in order to compare the mean amplitude for ES to the mean amplitude of the remaining saccades (ie those with latency in the range 121ms-500ms; Figure 9b). For each group, ES saccade amplitude was lower compared to other saccades. Across groups, average saccade amplitude was similar for both ES and other saccades. The slight reduction in average amplitude seen in the Chinese ESM group when all saccades were compared (Figure 9a), was not observed for saccades in the 121ms-500ms range (Figure 9b; filled bars). A repeated measures ANOVA with group (Chinese Norm v Chinese ESM v Caucasian) as a within subjects factor and saccade type (express v normal) as a between subjects factor showed that both group (F2,3113=12.1; p<0.001) and saccade type (F1,3114=461.73;
p<0.001) were statistically significant, and there was a statistically significant interaction between factors (F2,3113=85.52; p<0.001).
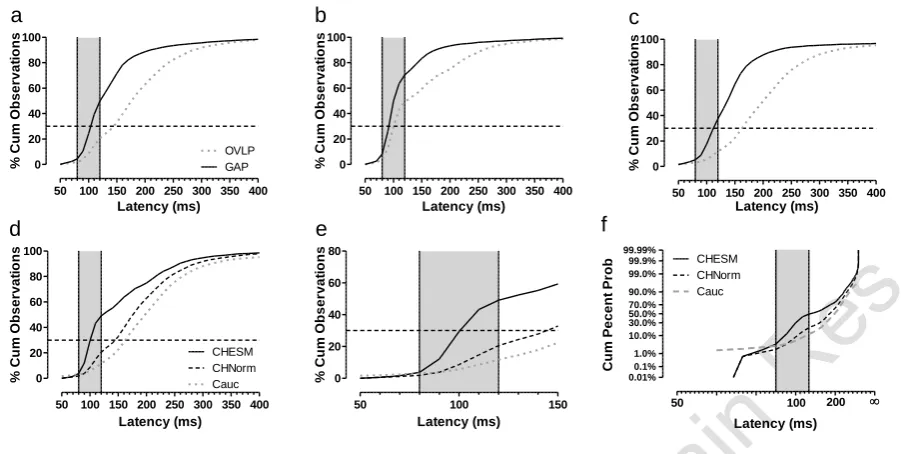
The distribution of saccade latency was examined further using cumulative percentage histograms for the pooled data from the three groups defined above (Figure 10). There was a clear difference in the distribution of latency between gap and overlap conditions for all three groups (Figure 10a-c), although in the express range (the area of grey shading) this was less marked for the Chinese ESMs (Figure 10b). Data from the overlap condition were compared between the three groups (Figure 10d,e), suggesting that the main difference was between the ESMs and the two other groups. Across the three groups, saccades with latency less than 80ms (anticipatory saccades) composed only a very small proportion of the total. The main divergence between groups occurred at the beginning of the express range. Figure 10e was replotted by transforming latency into its reciprocal, and reversing the x-axis, and plotted against cumulative percent probability on a probit scale (reciprobit analysis, Carpenter and Williams 1995). This analysis confirmed that the two non-ESM groups were broadly similar and different to the Chinese ESM group.
Discussion
Express saccades (ES) are low latency visually-guided saccades that have a distinct neurophysiological origin (Schiller et al. 1987; Edelman and Keller 1996b; Dorris et al. 1997). In healthy, naive, adult subjects there is agreement that ES production is facilitated by the use of gap conditions. In overlap conditions, in which the fixation target remains illuminated when the saccade target appears, the proportion of ES is low (usually <10%). The exception to this are “express saccade makers” (ESMs) who in the absence of any pathology continue to exhibit high proportions (>30%) of ES in overlap conditions. These subjects have been reported to be relatively rare (Biscaldi et al. 1996). However, we found that 10/34 (29%) of our Chinese subjects were ESMs, compared to 1/38 (3%) of Caucasian subjects.
Experiments on a single 29-year old subject who exhibited a consistently high proportion (>65%) ES in overlap conditions (Cavegn 1996), with both fixation time and target direction randomised, produced latency frequency distribution histograms very similar those from the Chinese ESMs (eg Figure 1b,c,e,f). Examination of a further 10 ESMs with antisaccade and memory-guided saccade tasks (Biscaldi et al. 1996), demonstrated a generally impaired ability to suppress reflexive saccades perhaps caused by a weak fixation system. Our criterion for identifying ESMs (>30% ES in overlap conditions) was slightly more stringent than that used by Biscaldi et al (1996). Had we used their main criterion (>30% ES in
either direction), two additional Caucasian subjects, and three additional Chinese subjects, would have
been classified as ESMs. However, as noted in the results, in the Caucasians the high apparent proportion of ES in one direction may have been an artefact of a low number of observations in that direction in those subjects. Including these additional subjects, would not alter our general conclusion that ESMs are much more common among Chinese subjects.
There are two further features of our data that suggest we are dealing with the same basic ESM phenomenon as previously reported. Biscaldi et al (1996) noted a variable pattern with regard to the asymmetry of ES production. Four of their ten ESMs were highly asymmetric in the generation of ES (although the direction in which most ES were produced was not reported), three were weakly asymmetric and three exhibited symmetrical ES production. We observed a similarly mixed pattern with regard to the asymmetry of ES production, with a bias towards a higher proportion of ES to rightward targets. Indeed, in general, we observed a rightward bias in the production of ES (Figure 8).
Other than the very different proportions of ESMs, the performance of the Chinese and Caucasian groups was similar. The yield of trials was similar for Caucasian and Chinese subjects, and there was a similar low proportion of anticipatory responses in both groups. There was no influence of age on median latency in either group (Figure 6a,b), and a similar relationship between median latency in overlap and gap conditions (Figure 7a). There was no difference between groups in the average amplitude of saccades. The difference in the average amplitude of all saccades (Figure 9a) is simply explained by the higher proportion of hypometric ES in the Chinese ESM group. It has been shown previously that with single targets, presented at a single eccentricity to either right or left, ES tend to be hypometric relative to saccades with longer latency (Fischer et al. 1993b; Delinte et al. 2002).
The distributions of median latencies and percentages of ES (Figures 4 & 5), the plot of median latencies in gap and overlap conditions (Figure 7a), the analysis of directionality of ES production (Figure 8) and the pooled latency distributions suggested that the main difference between Chinese and Caucasian groups emerged in overlap conditions. When the Chinese group was split into ESM and non-ESM subgroups, the non-ESM subjects were broadly comparable with the Caucasian group. Given the behavioural difference in the overlap conditions, the key functional difference must be related to specific aspects of saccade processing. Target onset processing, and the detection of the gap (and the advantages for saccade processing that stem from its presence) appear to be similar. It is the processing of the fixation target, present throughout the trial in overlap tasks, which is different in the ESMs. This presumably must be related to altered collicular processing (Edelman and Keller 1996b; Dorris et al. 1997; Munoz and Fecteau 2002), facilitating fixation disengagement in the presence of the fixation target. The balance between colicular rostral and caudal processing is presumably different in the ESMs leading do a disinhibtion of caudal activity. Moving up in the saccade control hierarchy this may imply altered processing in a number of cortical circuits (see Hamm et al. 2010 for discussion). If it can be confirmed that ESMs are much more common in the Chinese population, systematic studies to investigate these functional issues will be considerably easier to conduct.
the same phenomenon that had previously been reported. Secondly, although there is a continuum in the percentage of ES observed in overlap conditions in the Chinese group, calculating the proportion of ES and applying a criterion to this proportion, does appear to capture something missed by comparing only median latency. There is a difference between the ends of the continuum, with, in fact, only a relatively small number of ambiguous subjects who could belong to both groups. Thus it is not that the Chinese group as a whole is different to the Caucasian group. More specifically, there is a subgroup within the Chinese group who are strikingly different with regard to the over expression of a particular form of saccadic behaviour. And these subjects form a much larger subgroup within the Chinese subjects, than within the Caucasian subjects (where, clearly they can occur).
Had we adopted slightly different ES criteria, the number of ESMs in the Chinese group would have changed. However that given the relatively tight “express” peak in the latency distributions, the definition of ES would have to be altered considerably before forcing and alteration in our main conclusion. And changing the ESM criterion to a different percentage of ES would also have had relatively little effect unless the criterion was changed considerably (see Figure 7b).
Until now, ESMs have been assumed to be relatively rare, comprising between 1% and 5% of the healthy adult population (Biscaldi et al. 1996; Cavegn 1996). While these estimates were arrived at somewhat informally, they are consistent with other published data. Fischer et al (1993) tested twenty naive adults, none of whom were ESMs. In an ageing study, Munoz et al (1998) recruited a total of 168 subjects, 104 of whom were aged over 18 years. In overlap conditions, the average percentage of ES (saccade latency 90-140ms) across the age range was less than 3.9%, and no ESMs were reported. Although not explicitly discussed, most subjects in both of these studies (conducted in Germany and Canada respectively) were presumably Caucasian. While consistent with the data from our Caucasian group (6±6% ES in overlap conditions; see Figure 6d), they are clearly different from what we observed in the Chinese group.
Even in the relatively simple, reflexive tasks we have used, instructions, expectations or experience can modify saccade latency. Although we tested subjects at two different geographical locations, we sought to standardise our equipment, procedures and instructions, and all of our subjects were naive with respect to the tasks, stimuli and experimental methods. Systematic differences between the sites either in the testing conditions or the subjects themselves might have been expected to alter the group median latency. However, comparing the Chinese non-ESM and Caucasian groups, they appeared to be similar (see Figure 10d-f). The main difference is marked overproduction of ES in a subset of the Chinese subjects.
Specific training can increase the proportion of ES subsequently executed in gap conditions (Bibi and Edelman 2009). However, in gap-trained subjects, the proportion of ES in overlap conditions is reduced (Fischer et al. 1993b). All of our subjects were naive. It has been demonstrated that subject instructions can alter the distribution of saccade latency. Reddi and Carpenter (2000) instructed subjects either to go at their own pace but be as accurate as possible, or respond as quickly as possible not worrying about making mistakes (the urgency condition). Saccade latency distribution differed between conditions and in the urgency condition two latency populations emerged, evidenced by a distinct elbow in reciprobit plots. However, in these experiments target contrast was low (approximately 1% above threshold), leading to much longer median latencies compared to our study. In the urgency condition, the low latency population was classified as anticipatory (rather than ES), and there was an accompanying decrease in the proportion of correctly directed saccades. While direct comparison with our data is difficult, we did not observe the distinct types of shifts in the distributions caused in reciprobit plots by instructions (Reddi and Carpenter 2000; Kurata and Aizawa 2004). And all of our subjects were given the same instructions.
seems unlikely as we would argue that the main difference we have observed is within the Chinese group, rather than between the Chinese and Caucasian groups.
The groups were reasonably matched for age and gender. Age might have a bearing on the production of ES; all but one of the Chinese ESMs was aged less than 30 years, and the single Caucasian ESM was aged 18 years. Over this age range there were slightly different numbers of subjects in the two groups (24 Chinese vs 21 Caucasians) but the difference is too small to have a significant bearing on the overall conclusion. We can make no strong claims about the representativeness of the two samples relative to their respective populations. Both were recruited from large urban populations, and we did not attempt to profile the groups. However, given that we used a reflexive saccade task, we suspect that diverse factors such as IQ (see Goldberg et al. 2002), socioeconomic status and level of education, will have little bearing on the results. One useful control experiment which we have yet to conduct is to recruit a group of Chinese subjects, born and educated in the UK, and then tested in the UK. If within this group the proportion of ESMs is similar to the Chinese group in the current study, an environmental or cultural explanation for the group differences we have observed would be much less probable.
For the present a number of implications follow from our results. Firstly if the difference in the proportion of ESMs between Chinese and non-Chinese groups is confirmed, this would have a bearing on the debate over differences in eye movement patterns in visual search, scene perception and reading experiments (Chua et al. 2005; Rayner et al. 2007; Evans et al. 2009; Goh et al. 2009). If when comparing Chinese and non-Chinese subjects, a much higher proportion of the Chinese group were ESMs, this might influence variables such as fixation duration and fixation number. Although the occurrence of ES in more naturalistic viewing tasks has received little attention (see Bibi and Edelman 2009 for a brief discussion), there is evidence is that in more complicated task contexts than we have used here, ESMs continue to generate many low latency saccades (Harwood et al, 2008; see below). It has also been suggested that high proportions of ES can disrupt reading (Fischer et al. 1993a; Fischer and Weber 1993). Thus, concluding that culture or language are the important differentiating factors between Chinese and non-Chinese groups without excluding differences in the construction of the saccade system, might be premature. Our results imply an alternative possibility; rather than culture and language driving the same neural substrate to produce different behavioural patterns, the neural substrate differs between groups. However although it is tempting to present these as alternatives (ie effectively drawing a nature versus nurture distinction), clearly culture/language/environment interact with the developing oculomotor system (however constructed) to produce the observed behaviours.
Secondly, and more trivially, care should be taken in recruiting human research participants if saccade latency is to be the key dependant variable. One of four naive subjects in an experiment by Harwood et al (2008), investigating the modulation of saccade latency by the spatial scale of attention, appears to have been an ESM, and was also Chinese (Wallman, personal communication). The authors noted that in some conditions, in a paradigm much more challenging than ours, this subject continued to exhibit express peaks in her saccade latency distributions. Clearly, depending on the analysis being conducted, an ESM could bias latency results in a small dataset. Where Chinese subjects are recruited, the probability of recruiting an ESM is greatly increased.
Lastly, using a high proportion of ES as a marker of pathology is problematic if a higher proportion of the healthy Chinese population than expected are ESMs.
Acknowledgments
References
Bibi R, Edelman JA (2009) The influence of motor training on human express saccade production. J Neurophysiol 102: 3101-3110
Biscaldi M, Fischer B, Stuhr V (1996) Human express saccade makers are impaired at suppressing visually evoked saccades. J Neurophysiol 76: 199-214
Carpenter RHS, Williams MLL (1995) Neural computation of log likelihood in control of saccadic eye movements. Nature 377: 59-62
Cavegn D, Biscaldi M (1996) Fixation and saccade control in an express-saccade maker. Exp. Brain Res. 109: 101-116
Chua H, Boland J, Nisbett R (2005) Cultural variation in eye movements during scene perception. Proc. Nat. Accad. Sci. 102: 12629-12633
Delinte A, Gomez CM, Decostre MF, Crommelinck M, Roucoux A (2002) Amplitude transition function of human express saccades. Neurosci Res 42: 21-34
Dorris MC, Pare M, Munoz DP (1997) Neuronal activity in monkey superior colliculus related to the initiation of saccadic eye movements. J. Neurosci 17: 8566-8579
Edelman JA, Keller EL (1996) Activity of visuomotor burst neurons in the superior colliculus accompanying express saccades. J. Neurophysiol. 76: 908-926
Evans K, Rotello C, Li X, Rayner K (2009) Scene perception and memory revealed by eye movements and receiver-operating characteristic analyses: Does a cultural difference truly exist? Q J Exp Psychol 62: 276-285
Fischer B, Biscaldi M, Otto P (1993a) Saccadic eye movements of dyslexic adult subjects. Neuropsychologia 31: 887-906
Fischer B, Boch R (1983) Saccadic eye movements after extremely short reaction times in the monkey. Brain Research 260: 21-26
Fischer B, Weber H (1993) Express saccades and visual attention. Behav Brain Sci 16: 553-610
Fischer B, Weber H, Biscaldi M, Aiple F, Otto P, Stuhr V (1993b) Separate populations of visually guided saccades in humans - reaction-times and amplitudes. Exp Brain Res 92: 528-541
Goh J, Tan J, Park D (2009) Culture modulates eye-movements to visual novelty. PLOS One 4: 1-9 Goldberg MC, Lasker AG, Zee DS, Garth E, Tien A, Landa RJ (2002) Deficits in the initiation of eye movements in the absence of a visual target in adolescents with high functioning autism. Neuropsychologia 40: 2039-2049
Hamm JP, Dyckman KA, Ethridge LE, McDowell JE, Clementz BA (2010) Preparatory activations across a distributed cortical network determine production of express saccades in humans. J. Neurosci. 30: 7350-7357
Harwood MR, Madelain L, Krauzlis RJ, Wallman J (2008) The spatial scale of attention strongly modulates saccade latencies. J Neurophysiol 99: 1743-1757
Inhoff AW, Liu W (1997) The perceptual span during the reading of Chinese text. In: Chen HC (ed) The cognitive processing of Chinese and related Asian languages. The Chinese University Press, Hong Kong Inhoff AW, Lui W (1998) The perceptual span and oculomotor activity during the reading of Chinese sentences. J Exp Psychol: Hum Percept Perf 24: 20-34
Kalesnykas RP, Hallett PE (1987) The differentiation of visually guided and anticipatory saccades in gap and overlap paradigms. Experimental Brain Research 68: 115-121
Kimmig H, Biscaldi M, Mutter J, Doerr JP (2002) The initiation of smooth pursuit eye movements and saccades in normal subjects and in "express-saccade makers". Exp Brain Res 144: 373-384
Kingstone A, Klein RM (1993) What are human express saccades? Percept Psychophysics 54: 260-273 Kurata K, Aizawa H (2004) Influences of motor instructions on the reaction times of saccadic eye movements. Neurosci Res 48: 447-455
Leigh RJ, Kennard C (2004) Using saccades as a research tool in the clinical neurosciences. Brain 127: 460-477
McDowell JE, Dyckman KA, Austin BP, Clementz BA (2008) Neurophysiology and neuroanatomy of reflexive and volitional saccades: Evidence from studies of humans. Brain Cog 68: 255-270
Munoz DP, Broughton JR, Goldring JE, Armstrong IT (1998) Age-related performance of human subjects on saccadic eye movement tasks. Exp. Brain Res. 121: 391-400
Munoz DP, Fecteau JH (2002) Vying for dominance: dynamic interactions control visual fixation and saccadic initiation in the superior colliculus. Prog. Brain Res. 140: 3-19
Nisbett RE, Miyamoto Y (2005) The influence of culture: holistic versus analytic perception. TICS 9: 467-473
Rayner K, Li X, Williams CC, Cave KR, Well AD (2007) Eye movements during information processing tasks: Individual differences and cultural effects. Vis Res 47: 2714-2726
Schiller PH, Sandell JH, Maunsell JH (1987) The effect of frontal eye field and superior colliculus lesions on saccadic latencies in the rhesus monkey. J Neurophysiol 57: 1033-1049
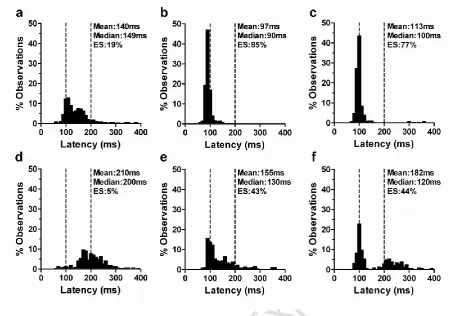
Figure 1. Saccade latency distributions (bin width 10ms) from three Chinese subjects,
plotted on the same axis scales for comparison (Subject 1 a,d; Subject 2 b,e;
Subject 3 c,f). a-c data from gap conditions; d-f data from overlap conditions.
Mean and median latency, and the percentage of express saccades (ES: latency
80ms to 120ms) shown for each plot. Subjects 2 (b,e) and 3 (c,f) have >30% ES
[image:11.595.71.539.59.375.2]0 200 400 0 10 20 30 110ms 55% Latency (ms) % O b serv at io n s
0 200 400
0 10 20 30 110ms 55% Latency (ms) % O b serv at io n s
0 200 400
0 10 20 30 120ms 45% Latency (ms) % O b s e rv a ti o n s
0 200 400
0 10 20 30 130ms 43% Latency (ms) % O b s e rv a ti o n s
0 200 400
0 10 20 30 130ms 41% Latency (ms) % O b s e rv a ti o n s
0 200 400
0 10 20 30 140ms 35% Latency (ms) % O b s e rv a ti o n s
0 200 400
0 10 20 30 140ms 32% Latency (ms) % O b serv at io n s
0 200 400
0 10 20 30 140ms 35% Latency (ms) % O b serv at io n s
0 200 400
0 10 20 30 140ms 34% Latency (ms) % O b serv at io n s
0 200 400
0 10 20 30 150ms 41% Latency (ms) % O b serv at io n s
0 200 400
0 10 20 30 140ms 24% Latency (ms) % O b serv at io n s
0 200 400
0 10 20 30 150ms 25% Latency (ms) % O b serv at io n s
0 200 400
0 10 20 30 160ms 13% Latency (ms) % O b serv at io n s
0 200 400
0 10 20 30 160ms 9% Latency (ms) % O b serv at io n s
0 200 400
0 10 20 30 160ms 12% Latency (ms) % O b s e rv a ti o n s
0 200 400
0 10 20 30 160ms 12% Latency (ms) % O b serv at io n s
0 200 400
0 10 20 30 160ms 27% Latency (ms) % O b serv at io n s
0 200 400
0 10 20 30 170ms 5% Latency (ms) % O b serv at io n s
0 200 400
0 10 20 30 170ms 13% Latency (ms) % O b s e rv a ti o n s
0 200 400
0 10 20 30 180ms 26% Latency (ms) % O b serv at io n s
0 200 400
0 10 20 30 180ms 26% Latency (ms) % O b s e rv a ti o n s
0 200 400
0 10 20 30 180ms 13% Latency (ms) % O b serv at io n s
0 200 400
0 10 20 30 180ms 7% Latency (ms) % O b s e rv a ti o n s
0 200 400
0 10 20 30 180ms 10% Latency (ms) % O b serv at io n s
0 200 400
0 10 20 30 180ms 8% Latency (ms) % O b s e rv a ti o n s
0 200 400
0 10 20 30 200ms 5% Latency (ms) % O b serv at io n s
0 200 400
0 10 20 30 200ms 26% Latency (ms) % O b s e rv a ti o n s
0 200 400
0 10 20 30 200ms 2% Latency (ms) % O b serv at io n s
0 200 400
0 10 20 30 210ms 24% Latency (ms) % O b s e rv a ti o n s
0 200 400
0 10 20 30 210ms 2% Latency (ms) % O b serv at io n s
0 200 400
0 10 20 30 215ms 19% Latency (ms) % O b serv at io n s
0 200 400
0 10 20 30 230ms 12% Latency (ms) % O b serv at io n s
0 200 400
0 10 20 30 230ms 9% Latency (ms) % O b serv at io n s
0 200 400
0 10 20 30 240ms 4% Latency (ms) % O b serv at io n s
Figure 2. Saccade latency distributions for overlap tasks for all Chinese subjects. The
median latency, and the percentage of ES is shown. Subjects with >30% ES are
0 100 200 300 400 0 10 20 30 40
50 Mean: 182ms
Median: 160ms ES: 7%
a
Latency (ms) % Ob s e rv a ti o n s0 100 200 300 400 0
10 20 30 40
50 Mean: 137ms
Median: 120ms ES: 38%
b
Latency (ms) % Ob s e rv a ti o n s0 100 200 300 400 0
10 20 30 40
50 Mean: 147ms
Median: 100ms ES: 67%
c
Latency (ms) % Ob s e rv a ti o n s0 100 200 300 400 0
10 20 30 40
50 Mean: 247ms
Median: 235ms ES: 1%
d
Latency (ms) % Ob s e rv a ti o n s0 100 200 300 400 0
10 20 30 40
50 Mean: 180ms
Median: 160ms ES: 18%
e
Latency (ms) % Ob s e rv a ti o n s0 100 200 300 400 0
10 20 30 40
50 Mean: 180ms
Median: 160ms ES: 34%
f
Latency (ms) % Ob s e rv a ti o n sFigure 3. Saccade latency distributions from Caucasian subjects. a-f plotted using the
same conventions as Figure 1 (Subject 1 a,d; Subject 2 b,e; Subject 3 c,f). a-c
data from gap conditions; d-f data from overlap conditions. Subjects 1 (a,d) and 2
(b,e) were typical of the Caucasian group; Subject 3 (c,f) was the single ESM in
the Caucasian group. Smaller histograms show saccade latency distributions
from overlap conditions for ten Caucasian subjects with the lowest median
latency, ordered by median latency. Percentage of ES is also shown.
0 200 400
0 10 20 30 Latency (ms) % O b s e rv a ti o n s 150ms 17%
0 200 400
0 10 20 30 Latency (ms) % O b s e rv a ti o n s 160ms 18%
0 200 400
0 10 20 30 Latency (ms) % O b s e rv a ti o n s 160ms 7%
0 200 400
0 10 20 30 Latency (ms) % O b s e rv a ti o n s 160ms 15%
0 200 400
0 10 20 30 Latency (ms) % O b s e rv a ti o n s 160ms 10%
0 200 400
0 10 20 30 Latency (ms) % O b s e rv a ti o n s 170ms 7%
0 200 400
0 10 20 30 Latency (ms) % O b s e rv a ti o n s 170ms 8%
0 200 400
0 10 20 30 Latency (ms) % O b s e rv a ti o n s 170ms 5%
0 200 400
0 10 20 30 Latency (ms) % O b s e rv a ti o n s 170ms 7%
0 200 400
[image:13.595.84.526.68.599.2]50 100 150 200 250 300 0
20 40 60
a.
Median Latency (ms)
%
Ob
s
e
rv
a
ti
o
n
s
Chin - Gap
50 100 150 200 250 300 0
20 40 60
b.
Median Latency (ms)
%
Ob
s
e
rv
a
ti
o
n
s
Chin - Ovlp
50 100 150 200 250 300 0
20 40 60
c.
Median Latency (ms)
%
Ob
s
e
rv
a
ti
o
n
s
Cauc - Gap
50 100 150 200 250 300 0
20 40 60
d.
Median Latency (ms)
%
Ob
s
e
rv
a
ti
o
n
s
Cauc - Ovlp
Figure 4. Distribution of median latency for 34 Chinese (a,b) and 38 Caucasian (c,d)
subjects in gap (a,c) and overlap (b,d) conditions. Note that while in gap
conditions the range of medians is similar for overlap conditions there is a
leftward shift in the distribution for the Chinese (b) compared to the Caucasian
[image:14.595.112.531.67.322.2]% Express
%
Ob
s
e
rv
a
ti
o
n
s
0 20 40 60 80 100 0
20 40 60 80
a.
Chin - Gap
% Express
%
Ob
s
e
rv
a
ti
o
n
s
0 20 40 60 80 100 0
20 40 60 80
b.
Chin - Ovlp
% Express
%
Ob
s
e
rv
a
ti
o
n
s
0 20 40 60 80 100 0
20 40 60 80
c.
Cauc - Gap
% Express
%
Ob
s
e
rv
a
ti
o
n
s
0 20 40 60 80 100 0
20 40 60 80
d.
Cauc - Ovlp
Figure 5. Distribution of percentage of ES in 34 Chinese (a,b) and 38 Caucasian (c,d)
[image:15.595.85.529.89.363.2]AGE (years)
M
e
d
ia
n
L
a
te
n
c
y
(
m
s
)
20 30 40 50
0 100 200 300
OVLP Gap
AGE (years)
M
e
d
ia
n
L
a
te
n
c
y
(
m
s
)
20 30 40 50
0 100 200 300
OVLP Gap
AGE (years)
%
E
x
p
S
a
c
c
a
d
e
s
20 30 40 50
0 20 40 60 80 100
Gap OVLP
AGE
%
E
x
p
S
a
c
c
a
d
e
s
20 30 40 50
0 20 40 60 80 100
Gap OVLP
a.
b.
c.
d.
Figure 6. Influence of age on median saccade latency in gap (
) and overlap (●)
conditions in Chinese (a) and Caucasian (b) subjects, and on the percentage of
ES in Chinese (c) and Caucasian (d) subjects. In a and b the horizontal solid line
is the overall mean overlap latency, and the dashed line the mean gap latency. In
c and d the horizontal dashed line is the 30% criterion applied to the overlap data
[image:16.595.88.529.95.429.2]OVLP Median Latency (ms)
G
a
p
M
e
d
ia
n
L
a
te
n
c
y
(
m
s
)
100 150 200 250 300
100 150 200 250 300
Chinese
r=0.50, p<0.001 Caucasian r=0.34, p<0.05
% Express OVLP
%
Ex
p
re
s
s
G
a
p
0 20 40 60 80 100
0 20 40 60 80
100 Caucasian
r=0.60, p<0.001 Chinese
r=0.66, p<0.001
a.
b.
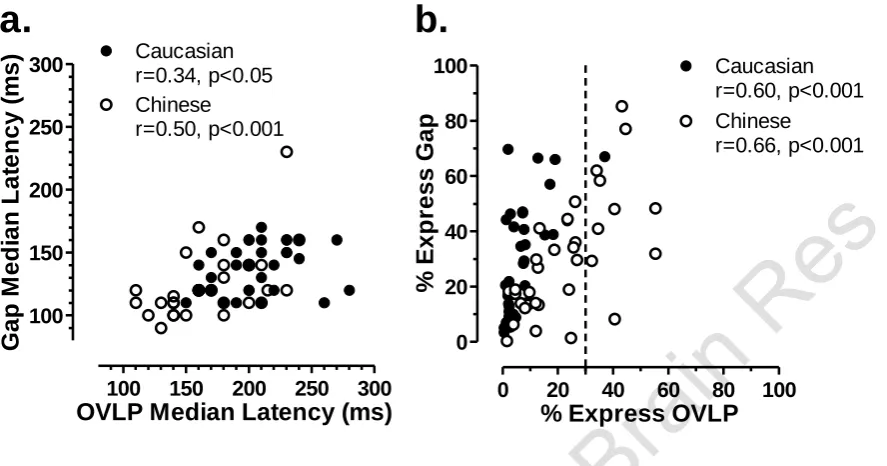
Figure 7. Interactions between performance in overlap (OVLP) and gap conditions. a.
Plot of median latency relationship in overlap and gap conditions for both
Chinese (
) and Caucasian (●) groups. b. Plot of % of ES in overlap and gap
[image:17.595.89.533.96.329.2]0 20 40 60 80 100 0
20 40 60 80 100
Left
R
ig
h
t
0 20 40 60 80 100 0
20 40 60 80 100
Left
R
igh
t
0 20 40 60 80 100 0
20 40 60 80 100
Left
R
ig
h
t
0 20 40 60 80 100 0
20 40 60 80 100
Left
R
ig
h
t
a
b
[image:18.595.83.529.64.413.2]c
d
Figure 8. Percentage of ES (saccades with latency in the range 80-120ms) for targets
to the left and right. ● Normal (ie non-ESM) subjects;
ESM. The solid diagonal line is
the line of equality (x=y); horizontal and vertical dashed lines show 30% level. a.
Chinese group, gap conditions; b. Chinese group, overlap. c. Caucasian group, gap; d.
CE
sm
CNr
m
Cau
c
0
2
4
6
8
10
12
14
a.
Group
A
m
p
li
tu
d
e
(
De
g
)
CE
sm
CNr
m
Cau
c
0
2
4
6
8
10
12
14
16
18
Express
Normal
b.
Group
A
m
p
li
tu
d
e
(
De
g
[image:19.595.93.532.75.320.2])
Figure 9. a. Intersubject mean (± intersubject SD) saccade amplitude for overlap tasks,
calculated for all saccades in each of three groups of subjects. CEsm: ESM subjects
from the Chinese group (N=10); CNrm: non-ESM subjects from the Chinese group
(N=24); Cauc: Caucasian subjects, excluding the single Caucasian ESM (N=37). b.
Comparison of ES amplitude (latency 80ms-120ms; open bars) and “normal” saccade
50 100 150 200 250 300 350 400 0 20 40 60 80 100 OVLP GAP
a
Latency (ms) % C u m O b s e rv a ti o n s50 100 150 200 250 300 350 400
0 20 40 60 80 100
b
Latency (ms) % C u m O b s e rv a ti o n s50 100 150 200 250 300 350 400
0 20 40 60 80 100
c
Latency (ms) % C u m O b s e rv a ti o n s50 100 150 200 250 300 350 400
0 20 40 60 80 100 CHESM CHNorm Cauc
d
Latency (ms) % C u m O b s e rv a ti o n s50 100 150
0 20 40 60 80
e
Latency (ms) % C u m O b s e rv a ti o n s 0.01% 0.1% 1.0% 10.0% 30.0% 50.0% 70.0% 90.0% 99.0% 99.9% 99.99% CHESM CHNorm Cauc50 100 200