White Rose Research Online URL for this paper:
http://eprints.whiterose.ac.uk/120265/
Version: Accepted Version
Article:
Parker, R.J., Goodwin, S.P., Kroupa, P. et al. (1 more author) (2009) Do binaries in clusters
form in the same way as in the field? Monthly Notices of the Royal Astronomical Society,
397 (3). pp. 1577-1586. ISSN 0035-8711
https://doi.org/10.1111/j.1365-2966.2009.15032.x
[email protected]
https://eprints.whiterose.ac.uk/
Reuse
Unless indicated otherwise, fulltext items are protected by copyright with all rights reserved. The copyright
exception in section 29 of the Copyright, Designs and Patents Act 1988 allows the making of a single copy
solely for the purpose of non-commercial research or private study within the limits of fair dealing. The
publisher or other rights-holder may allow further reproduction and re-use of this version - refer to the White
Rose Research Online record for this item. Where records identify the publisher as the copyright holder,
users can verify any specific terms of use on the publisher’s website.
Takedown
If you consider content in White Rose Research Online to be in breach of UK law, please notify us by
arXiv:0905.2140v1 [astro-ph.GA] 13 May 2009
Do binaries in clusters form in the same way as in the field?
Richard J. Parker
1⋆, Simon P. Goodwin
1, Pavel Kroupa
2and M. B. N. Kouwenhoven
11 Department of Physics and Astronomy, University of Sheffield, Sheffield, S3 7RH, UK
2 Argelander Institut f¨ur Astronomie, Universit¨at Bonn, Auf dem H¨ugel 71, 53121 Bonn, Germany
ABSTRACT
We examine the dynamical destruction of binary systems in star clusters of different densities. We find that at high densities (104−
105
M⊙ pc−
3
) almost all binaries with separations > 103
AU are destroyed after a few crossing times. At low densities (O(102
) M⊙ pc−
3
) many binaries with separations >103 AU are destroyed, and no
binaries with separations>104
AU survive after a few crossing times. Therefore the binary separations in clusters can be used as a tracer of the dynamical age and past density of a cluster.
We argue that the central region of the Orion Nebula Cluster was ∼ 100 times
denser in the past with a half-mass radius of only 0.1 – 0.2 pc as (a) it is expanding,
(b) it has very few binaries with separations>103
AU, and (c) it is well-mixed and thereforedynamicallyold.
We also examine the origin of the field binary population. Binaries with sepa-rations < 102 AU are not significantly modified in any cluster, therefore at these
separations the field reflects the sum of all star formation. Binaries with separations in the range 102
– 104
AU are progressively more and more heavily affected by dynam-ical disruption in increasingly dense clusters. If most star formation is clustered, these binaries must be over-produced relative to the field. Finally, no binary with a separa-tion >104
AU can survive in any cluster and so must be produced by isolated star formation, but only ifallisolated star formation produces extremely wide binaries.
Key words: binaries: general – stars: formation – open clusters and associations – methods: N-body simulations
1 INTRODUCTION
Most stars in the field are observed to be in multiple systems1 (e.g. Duquennoy & Mayor 1991; Fischer & Marcy 1992). The binary fraction of young stars ap-pears to be even higher than that of the field (e.g. Mathieu 1994; Patience et al. 2002; Goodwin & Kroupa 2005; Goodwin et al. 2007, and references therein). Kroupa & Burkert (2001) show that in dense clusters it is very difficult to make significant numbers of binaries from initially single stars and that it is impossible to widen an initially narrow separation distribution to the observed wide distribution. Therefore, the field binary fractions and properties must in some way mirror the outcome of star formation. Thus, one of the most significant constraints on models of star formation is that these models correctly
⋆ E-mail: [email protected]
1 Lada (2006) points out that the binary fraction of M-dwarfs is low and so most stellarsystemsare single. However, the fraction of stars (rather than systems) that are in binaries could be more than half.
predict the numbers and properties of binary and multiple systems (Goodwin et al. 2007).
However, at least 50 per cent (probably 70 – 90 per cent) of stars are thought to form in clusters (e.g. Lada & Lada 2003). It is known that internal dynamical processes in clus-ters can rapidly and significantly affect the properties of binaries in clusters (e.g. Heggie 1975; Hills 1975a,b; Kroupa 1995a,b; Kroupa, Petr & McCaughrean 1999). The degree to which binary properties will be altered depends also on the density and lifetime of the cluster in which the binaries are born.
of different separations are processed. This will allow us to discuss the main aspects of attempting to model the origin of the field, and reconstruct the initial binary population.
In this paper, we investigate how a field-like initial bi-nary population is modified in clusters. In Section 2 we de-scribe our initial conditions; we present our results and dis-cussion in Sections 3, 4 and 5, and we conclude in Section 6.
2 METHOD
2.1 Initial conditions
[image:3.612.310.539.173.295.2]The simulated star clusters have masses ∼ 102 – 103M ⊙ and a range of half-mass radii of 0.1, 0.2, 0.4 and 0.8 pc. This means we can simulate clusters with a range of densi-ties from∼50 M⊙pc−3 to∼105M⊙pc−3 covering almost the complete range of probable initial cluster densities. We summarise the properties of the clusters that we simulate in Table 1.
For each set of initial conditions we run an ensemble of at least 10 simulations which are identical apart from the random number seed used to initialise the positions, masses and binary properties.
Our clusters are set-up as initially virialised Plummer spheres (Plummer 1911) according to the prescription of Aarseth, H´enon & Wielen (1974). The Plummer sphere pro-vides the positions and velocities of the centres of mass of systems – which may be single or binary systems.
To create a stellar system, the mass of the primary star is chosen randomly from a Kroupa (2002) IMF of the form
N(M)∝
M−1.3 m
0< M/M⊙< m1,
M−2.3 m
1< M/M⊙< m2, (1)
where m0 = 0.1 M⊙,m1 = 0.5 M⊙, andm2 = 50 M⊙. For simplicity we do not include brown dwarfs (BDs) in our sim-ulations. The effect of dynamical processing on BDs in clus-ters will be studied in a future paper (for the results of recent observations of BDs in Orion see Maxted et al. 2008; and for existing theoretical work see Kroupa et al. 2003 and Thies & Kroupa 2008).
We then assign a secondary to the system depending on the binary fraction associated with the primary mass.
For a field-like binary fraction we divide primaries into four groups. Primary masses in the range 0.08 6 M/M⊙ < 0.47 are M-dwarfs, with a binary fraction of 0.42 (Fischer & Marcy 1992)2. K-dwarfs have masses in the range 0.47 6 M/M⊙ < 0.84 and binary fraction of 0.45 (Mayor et al. 1992) and G-dwarfs have masses from 0.84 6 M/M⊙ < 1.2 with a binary fraction of 0.57 (Duquennoy & Mayor 1991). All stars more massive than 1.2 M⊙are grouped together and assigned a binary fraction of unity, as massive stars have a much larger binary fraction than low-mass stars (e.g. Abt et al. 1990; Mason et al. 1998; Kouwenhoven et al. 2005, 2007; Pfalzner & Olczak 2007, and references therein).
2 We note that the M-dwarf binary fraction is highly uncertain. The results of Fischer & Marcy (1992) are probably only appro-priate for stars with mass>0.3 M⊙, and the binarity and
sepa-ration distributions below this mass may be quite different (see especially Lada 2006 and also Maxted et al. 2008).
Table 1.A summary of the different cluster properties adopted for the simulations. The values in the columns are: the number of stars in each cluster (Nstars), the typical mass of this cluster (Mcluster), the initial half-mass radius of the cluster (r1/2), the crossing time of the cluster (tcross) and the initial binary fraction in the cluster (fbin).
Nstars Mcluster r1/2 tcross fbin
1500 ∼103M⊙ 0.1 pc ∼0.02 Myr 100 per cent 1500 ∼103M⊙ 0.1 pc ∼0.02 Myr field-like 1500 ∼103M⊙ 0.2 pc ∼0.05 Myr 100 per cent 1500 ∼103M⊙ 0.2 pc ∼0.05 Myr field-like 1500 ∼103M⊙ 0.4 pc ∼0.1 Myr field-like 1500 ∼103M⊙ 0.8 pc ∼0.4 Myr 100 per cent 1500 ∼103M⊙ 0.8 pc ∼0.4 Myr field-like
100 ∼102M⊙ 0.4 pc ∼0.4 Myr 100 per cent 100 ∼102M⊙ 0.4 pc ∼0.4 Myr field-like
Clusters with an initial binary fraction of unity for all
stars are also created in order to test the hypothesis that all stars form in binary systems and that single stars are solely the result of the dynamical processing of binaries (Kroupa 1995a,b; Goodwin & Kroupa 2005).
2.2 Binary properties
Secondary masses are drawn from a flat mass ratio distri-bution with the constraint that if the companion mass is
<0.1 M⊙it is reselected. This maintains the underlying bi-nary fraction, but biases the mass ratios of low-mass systems towards unity (see Kouwenhoven et al. 2009a). We note that this means that we do not recover a Kroupa IMF despite our primaries being drawn from this distribution.
Eccentricities of binary stars are drawn from a thermal eccentricity distribution (Heggie 1975; Kroupa 1995a, 2008) of the form
fe(e) = 2e. (2)
The generating function for orbital periods are the log-normal distributions observed by Duquennoy & Mayor (1991) and Fischer & Marcy (1992) of the form
f(logP) =Cexp
−(logP−logP)2 2σ2
logP
, (3)
where logP = 4.8,σlogP = 2.3 andP is in days. The
pe-riods are then converted to semi-major axes. Binary sys-tems with small semi-major axes but large eccentricities are expected to undergo tidal circularisation, as observed in Duquennoy & Mayor’s (1991) sample. We include the effects of tidal circularisation in our simulations by utilis-ing Kroupa’s (1995b) ‘Eigenevolution’ process. However, we note that the systems that are circularised by eigenevolution are so hard as to be generally unaffected by dynamical inter-actions and so the details of eigenevolution are unimportant (we also ran simulations without any eigenevolution and also with a simplified circularisation mechanism and found no significant differences).
system are determined. These are then placed at the cen-tre of mass and cencen-tre of velocity for each system in the Plummer sphere.
Simulations are run using the kiraintegrator in
Star-lab (e.g. Portegies Zwart et al. 1999, 2001, and references therein) and evolved for 10 Myr. Note that we do not include stellar evolution; we have checked that this makes very lit-tle difference to the outcome of the simulations as there are few high-mass stars that evolve on such a short timescale (and, as we shall see, most binary evolution occurs in the first Myr, before the massive stars have evolved).
2.3 Finding bound binary systems
We determine whether a star is in a binary system using the following method3. For each star, the distances to its ten nearest neighbours are determined. These distances are then used to find the average distance between stars locally. We then determine the identities of the nearest and sec-ond nearest neighbours of each star. If two stars are mutual nearest neighbours with a separation of less than a quarter of the local average distance between stars they are a po-tential binary4. Numerical experiments have shown that it is extremely rare to find a bound system with a separation greater than a quarter of the local average separation. They are a true binary if they also have a significantly negative relative energy, and they are anobservationalbinary if they have positive energy (i.e. an observer may think the system is a binary when it is just two stars passing). Clearly in our definition an observational binary can be found in either 2D or 3D, however only 2D observational binaries are of interest as they represent potential mistakes in actual observations. However, for the rest of this paper we ignore observational binaries as they are found to be extremely rare.
3 CLUSTERS OF DIFFERENT DENSITIES
In this section we will examine the evolution of the binary populations in clusters of different densities.
Firstly, we will consider dense clusters with half-mass radii of 0.1 – 0.2 pc and masses of∼750 M⊙(Nstars ∼ 1500) with densities of 104−105M
⊙pc
−3. Then we will consider
low-density clusters with large half-mass radii, or low num-bers of stars, with densities ofO(102) M
⊙pc−3.
These two density regimes cover the whole range of ini-tial cluster densities in probably equal proportions. If the cluster mass function isN(M)∝M−2 (Lada & Lada 2003) then each equal logarithmic mass bin contributes the same
massof stars to the field. Taking the range of cluster masses to be 101– 105M
⊙, then an equal mass of stars is produced by clusters larger than Orion (∼103M
⊙) to the mass pro-duced by clusters smaller than Orion. The higher densities are probably fairly representative of larger clusters, and the
3 Our algorithm almost exactly reproduces the results of the inde-pendent binary finding algorithm of Kouwenhoven et al. (2009b, in prep.).
4 This method is also able to find higher-order systems by ex-amining the relationships between sets of three or more stars. For example a triple is a system in which three stars are mutual nearest and second nearest neighbours.
lower densities of smaller clusters (we will return to this in Section 4 where we examine the initial conditions of Orion). We might well expect the evolution of the binary pop-ulations in different density clusters to be very different as the position of the hard-soft boundary, ah−s, will depend on the number of systemsNsys in, and the half-mass radius
r1/2, of the cluster (following Binney & Tremaine 1987),
ah−s∝
r1/2
Nsys
. (4)
Thus the hard-soft boundary will shift by a factor of nearly 100 between the least and most dense clusters.
3.1 Dense clusters
3.1.1 The evolution of the binary fraction
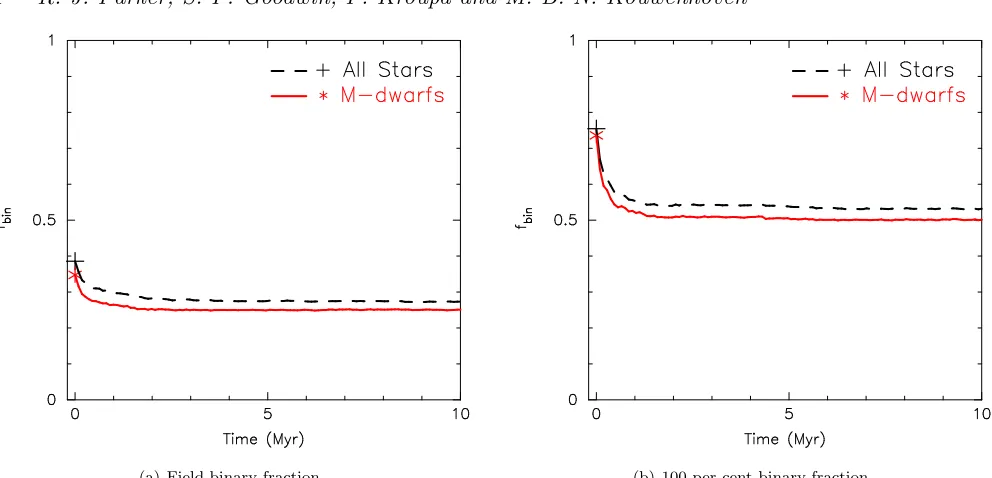
In Figs. 1(a) and 1(b) we show typical examples of the evo-lution of the binary fractions with time for clusters with initially field and 100 per cent binary fractions, respectively, with half-mass radii of 0.1 pc. The two lines represent the evolution of the binary fraction of all stars (dashed line), and of M-dwarfs (solid line). We define the binary fraction to be the fraction of multiple (almost always binary) systems compared to the total number of systems,
fbin=
B+T+...
S+B+T+..., (5)
whereS,B, andT (etc.) are the numbers of single, binary and triple (etc.) systems, respectively.
For both distributions there is a rapid disruption of sys-tems in the first 0.1 Myr, in which the soft syssys-tems are destroyed. Once the least bound (i.e. wide) systems are de-stroyed, the clusters reach an equilibrium in which the bi-nary fractions remain roughly constant. This is the same behaviour as found by Kroupa (1995a,b), and Kroupa et al. (1999).
The destruction of binary systems occurs in roughly a crossing time, and hencethe binary population is set by the densest configuration of a clusterbefore any expansion can occur (Kroupa 2000). As long as a cluster spends a few
initialcrossing times in a dense configuration, that is enough to process the binary population. The current density of a cluster (as long as it is lower) will merely maintain the population created in the dense state.
What is also clear in Fig. 1 is that there is a mass-dependence in the destruction of systems. Low-mass binary systems are more susceptible to destruction as they have a lower binding energy. The binary fraction of M-dwarfs is
∼5 per cent lower than the binary fraction of the other, more massive stars, despite the scenario plotted in Fig. 1(b) in which the various spectral types have the same initial binary fraction.
The wide field-like log-normal distribution used to gen-erate the initial binary population is not recovered even before any dynamical evolution. This is first apparent in Fig. 1(b), in which we only obtain a binary fraction of
∼75 per cent rather than 100 per cent at time zero, be-fore any evolution takes place.
(a) Field binary fraction. (b) 100 per cent binary fraction.
Figure 1.The evolution of binary fractions with time for a 0.1 pc half-mass radius cluster with (a) an initial field binary fraction; and (b) an initial binary fraction of 100 per cent, in which all stars are formed in binary systems. The binary fraction for all stars is shown by the dashed (black) line and the binary fraction for M-dwarfs is shown by the solid (red) line. The initial binary fractions (at cluster birth) are denoted by the plus sign (all stars) and the asterisk (M-dwarfs). In both scenarios, a large proportion of binaries are immediately broken up before an equilibrium state is reached after a few Myrs. The final M-dwarf binary fractions after the cluster has evolved for 10 Myrs are 25 per cent for an initial field binary fraction, and 50 per cent for an initial binary fraction of 100 per cent.
within the half-mass radius. Therefore binaries with separa-tions of this order or larger – whilst generated by the initial conditions – are not physically associated or bound within a cluster, and therefore are not identified as binaries.
3.1.2 An initially field-like binary fraction
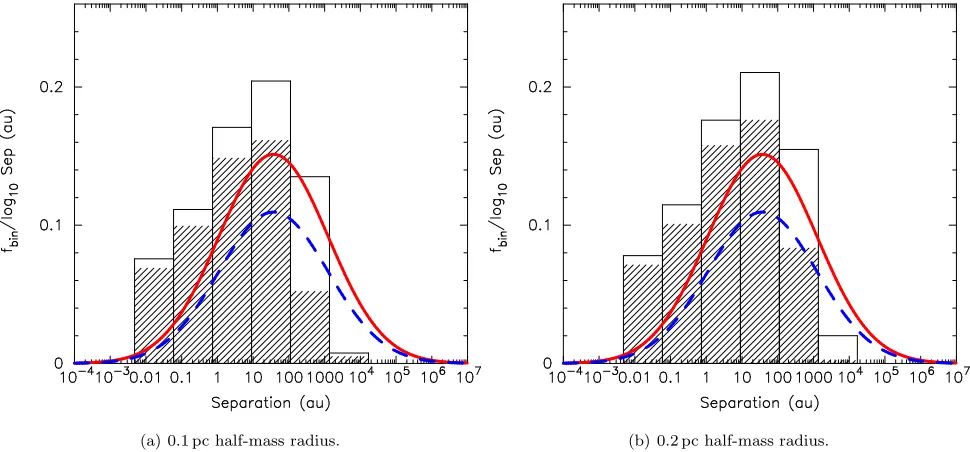
In Fig. 2 we show the binary fraction-separation distribution with initially field properties in a cluster with half-mass radii of 0.1 and 0.2 pc. The open histograms show the distribu-tion at time zero – before any dynamical evoludistribu-tion of the systems, the hashed histograms those at 1 Myr (roughly the age of Orion; Jeffries 2007a,b). The solid (red) lines are the G-dwarf (Duquennoy & Mayor 1991) log-normal pe-riod distribution, and dashed (blue) lines are the M-dwarf (Fischer & Marcy 1992) log-normal distribution, which are the functions used to generate the initial binary populations. The open circles in Fig. 2(a) show the binary fractions gen-erated by the initial conditions (there is a deviation from the generating function at low separations due to the effect of eigenevolution, however, as we shall see later this is unim-portant as these binaries are hard). The open histograms show the distribution of binary fractions found by our bi-nary finding algorithm, which are clearly different.
In Fig. 2 we also compare the separation distributions of binaries generated with a field binary fraction found by our binary finder at time zero (open histogram), and (hatched histogram) at 1 Myr. Quite clearly there has been signifi-cant dynamical destruction of binaries with separations of
∼100 – 1000 AU, whilst binaries with separations <50 – 100 AU are almost unchanged. This is the Heggie-Hills law (Heggie 1975; Hills 1975a,b) in action: the hard-soft
bound-ary in our clusters is at a few hundred AU (this is also seen by e.g. Kroupa 1995a,b; Kroupa et al. 1999 and described in detail by Kroupa 2008).
Even the binary fraction of very hard systems is re-duced by the destruction of wide binaries. There is very
little evolution in the number of systems with separations below 1 AU; however the binary fraction of those systems decreases due to the increase in the total number of sys-tems due to the destruction of wider binaries. For example, in a cluster with 100 binary systems, 20 of these may be very hard. The initial binary fraction of these hard systems would be 20/100 = 20%. However, after the destruction of 20 wider systems, each wider system becomes 40 single stars, and so the binary fraction of very hard systems would be 20/120 = 17%, despite none of them having been destroyed.
There is very little dynamical processing of initially hard systems. In each cluster a few (0 – 5) systems with initial separations≪ 50 AU are significantly altered or de-stroyed, but most systems retain virtually unchanged sepa-rations from formation.
(a) 0.1 pc half-mass radius. (b) 0.2 pc half-mass radius.
Figure 2.The evolution of the separation distribution for a cluster with an initially field binary fraction and half-mass radius of (a) 0.1 pc; and (b) 0.2 pc. The separation distribution observed for field G-dwarfs by Duquennoy & Mayor (1991) is shown by the solid (red) log-normal; the distribution observed for field M-dwarfs by Fischer & Marcy (1992) is shown by the dashed (blue) log-normal. The open circles in (a) show the initial distribution generated by our initial conditions generator, whereas in both panels the open histograms show the initial binaries and the hatched histogram shows the binaries remaining after 1 Myr, as found by our algorithm.
(a) 0.1 pc half-mass radius. (b) 0.2 pc half-mass radius.
Figure 3.The evolution of the separation distributions for clusters containing∼1500 stars created with a 100 per cent binary fraction. The open histograms are the initial distribution and the hatched histograms are the distributions after 1 Myr. We show the separation distributions for such clusters with initial half-mass radii of (a) 0.1 pc; and (b) 0.2 pc. The log-normal fits obtained from observations of field G-dwarfs (Duquennoy & Mayor 1991, the solid (red) line) and field M-dwarfs (Fischer & Marcy 1992, the dashed (blue) line) are also plotted.
3.1.3 An initially 100 per cent binary fraction
Fig. 1(b) appears to show that if the initial binary fraction is unity in dense clusters, then the effect of dynamical evolu-tion is to lower the binary fracevolu-tion to close to the field values (actually slightly too high for M-dwarfs). This might suggest
that in dense clusters stars form with a field-like separation distribution, but with a higher binary fraction (e.g. unity).
[image:6.612.51.536.406.632.2](a) 0.8 pc half-mass radius, 1500 stars, field binary fraction. (b) 0.8 pc half-mass radius, 1500 stars, 100 per cent binary frac-tion.
[image:7.612.50.534.88.552.2](c) 0.4 pc half-mass radius, 100 stars, field binary fraction. (d) 0.4 pc half-mass radius, 100 stars, 100 per cent binary fraction.
Figure 4. The evolution of the separation distributions for clusters with initial half-mass radii of 0.8 pc, 1500 stars, with field-like and 100 per cent binary fractions ((a) and (b) respectively); and clusters of initial half-mass radii of 0.4 pc containing∼100 stars created with field-like and 100 per cent binary fractions ((c) and (d) respectively). The open histograms are the initial distribution and the hatched histograms are the distributions after 1 Myr. The log-normal fits obtained from observations of field G-dwarfs (Duquennoy & Mayor 1991, the solid (red) line) and field M-dwarfs (Fischer & Marcy 1992, the dashed (blue) line) are also plotted.
not identified as binaries even before the start of the simu-lations. Secondly, the hard-soft boundary is in exactly the same place and so many binaries with separations >50 to a few hundred AU are dynamically disrupted.
Our initial conditions also produce too many low-separation binaries which are unaffected by dynamical evo-lution. This suggests that the initialhardbinary population should look similar to the field (at least after mixing with clusters of lower densities and field stars – see Section 5).
It should be noted that high-density clusters – even though they start in virial equilibrium – expand significantly
due to the input of energy into the cluster from the disrup-tion of significant numbers of binary systems.
3.2 Low-density clusters
of 0.4 pc. These clusters both have densities of ∼ 200 – 300 M⊙pc−3(compare with the clusters illustrated in Fig. 2 which have densities of∼104M⊙pc−3). We show the binary separation distributions initially (zero time, rather than the initial conditions), and at 1 Myr for the clusters.
What is clear in all panels in Fig. 4 is that most very wide binaries (>104 AU) never survive (even if they form) even in low-density clusters. The hard-soft boundary has clearly shifted in the low-density clusters compared to the high-density clusters considered above, but not enough to allow these extremely wide binaries to survive.
From Figs. 2 and 3 (and inspection of the data) we estimate the hard-soft boundary in a dense N ∼ 1500,
r1/2 = 0.1 pc cluster to be∼ 50 – 100 AU. For the low density cluster withN ∼1500,r1/2= 0.8 pc, Eqn. 4 would suggest that the hard-soft boundary should be at around 500 AU. However, inspection of Fig. 4 seems to show that the limit of the destruction of intermediate binaries is around 5000 AU, about ten times larger than expected.
The reason for this discrepancy is that the low den-sity cluster is still dynamically young at the 1 Myr ages illustrated in the previous figures. The crossing times of the dense clusters are only 10s kyr meaning that the clusters are many crossing times old. However, the crossing times of the low density clusters are around 0.4 Myr, meaning that they are dynamically very young. As illustrated in Fig. 1 and described above, it takes a few crossing times to reach an equilibrium in which all of the soft systems have been destroyed and the low density clusters have not had long enough to do this by 1 Myr. This also means that the low density clusters are not dynamically mixed and the binary fraction has a radial dependence (we will describe this in detail in the next section).
4 THE INITIAL CONDITIONS OF THE ORION NEBULA CLUSTER
The Orion Nebula Cluster (ONC) is observed to have a half-mass radius of∼0.8 pc and around 2000 – 3000 members (McCaughrean & Stauffer 1994; Hillenbrand & Hartmann 1998; K¨ohler et al. 2006). This makes the ONC a low-density cluster following our definitions above. However, this is the
currentstate of the ONC. As shown by Bastian et al. (2008) many clusters seem to undergo an early dense phase and then rapidly expand (possibly due to gas expulsion, see Goodwin & Bastian 2006). In this section we examine the binary properties of the ONC and its dynamical state to attempt to infer the initial conditions of the ONC.
Reipurth et al. (2007) carried out a survey of inter-mediate/wide (visual) binaries in the ONC. They looked at the separation distribution in the range of ∼ 68 AU to 676 AU. As noted in Section 3.1.2, Scally et al. (1999) find only 3 possible binaries in Orion with separations greater than 1000 AU. Therefore, the Reipurth et al. (2007) sample covers most of the range of intermediate to wide binaries in the ONC (presumably there are also a small number of binaries in the range 700 – 1000 AU).
The immediate and obvious conclusion to draw from this is that ONC-like clusters – even at low-density – can-not be the source of a significant number of binaries with separations>1000 AU in the field.
The Reipurth et al. (2007) data are shown in Fig. 5; they place their data into bins of width 0.2 log AU and the numbers of binaries in each bin are shown by (green) crosses. We also plot the log-normal distributions for G-dwarfs and M-G-dwarfs. Note that most of the stars observed by Reipurth et al. (2007) are M-dwarfs, and so it is the (lower) M-dwarf distribution that should be compared to the data rather than the G-dwarf distribution.
We over-plot the average of our ensemble of simulations for clusters with 100 per cent initial binary fractions and half-mass radii of 0.1 (Fig. 5(a)) and 0.2 pc (Fig. 5(b)), and an initially field binary fraction and half-mass radii of 0.4 pc (Fig. 5(c)) and 0.8 pc (Fig. 5(d)), shown by the histograms in each panel. Each histogram shows the average for that bin of 10 simulations, with the dot-dashed lines showing the standard deviations over the 10 realisations.
From inspection of Fig. 5 it is clear that the observations of the ONC can be matched by both an initially high binary fraction in a high-density cluster, or an initially field-like distribution in a low-density cluster.
The current half-mass radius of Orion is∼0.8 pc, a fac-tor of∼5 larger than that inferred from an initially high bi-nary population. Despite the fact that a field-like population can match the observations we strongly prefer the interpre-tation that Orion started with a far higher binary fraction in this separation range which has dynamically evolved into the current distribution. The reasons for this are threefold.
•Firstly, the central region of Orion (0 – 5 pc) is thought to be expanding5, based on the 1D velocity dispersion of
∼2.5 km s−1 (Jones & Walker 1988). The 3D velocity dis-persion is ∼ 4.3 km s−1 (Kroupa, Aarseth & Hurley 2001; Olczak, Pfalzner & Eckart 2008), which is too large for it to be in virial equilibrium (although we note that the effect of binaries in a cluster is to increase the observed velocity dis-persion; Kouwenhoven & de Grijs 2008) – a 0.8 pc half-mass radius cluster with a mass of 1500 M⊙has a virialised veloc-ity dispersion of∼2.8 km s−1(see Kroupa et al. 1999, 2001). Clusters are expected to expand early in their lives due to the effects of gas expulsion (see Bastian & Goodwin 2006; Goodwin & Bastian 2006). Indeed, a factor of 6 increase in radius is not unusual for a low effective star formation ef-ficiency cluster (see Goodwin & Bastian 2006, in particular their fig. 2). The current velocity dispersion of 4.3 km s−1 im-plies an initial size of the cluster of<0.2 pc6. Therefore, its initial configurationmusthave been denser than is currently observed – and, as we have seen, it is the initial, rather than current density that is all important for processing the initial binary population. Scally, Clarke & McCaughrean (2005) suggest from their detailed study of the dynamics of the
5 On larger scales (∼20 pc), the region around the ONC may be undergoing cold collapse, as observed by Feigelson et al. (2005) and Tobin et al. (2009).
(a) 0.1 pc half-mass radius, 100 per cent binary fraction. (b) 0.2 pc half-mass radius, 100 per cent binary fraction.
[image:9.612.41.547.86.554.2](c) 0.4 pc half-mass radius, field binary fraction. (d) 0.8 pc half-mass radius, field binary fraction.
Figure 5.Comparison with fig. 7 from Reipurth et al. (2007). Their data are shown by the (green) crosses, together with their uncertain-ties. Data from our simulations for a cluster age of 1 Myr and cluster membership of∼1500 stars (similar to the ONC) are shown by the open histograms (uncertainties shown by the dash–dot lines and offset from the centre of each bin for clarity). As in our Figs. 2, 3 and 4, the log-normal distributions for field G-dwarfs (Duquennoy & Mayor 1991, the solid (red) line), and field M-dwarfs (Fischer & Marcy 1992, the dashed (blue) line) are plotted. We show the results for three different initial cluster half-mass radii. Panels (a) and (b) show the results for an initial binary fraction of 100 per cent and half mass radii of 0.1 pc and 0.2 pc respectively. Panels (c) and (d) show the results for an initial field binary fraction and a half mass radii of 0.4 pc, and 0.8 pc respectively.
Orion cluster that it may well have initially been 10 – 100 times denser in the past; we suggest that it was around 100 times denser, in broad agreement with them.
• Secondly, the binary population observed by K¨ohler et al. (2006) and Reipurth et al. (2007) in Orion ap-pears to be well-mixed. K¨ohler et al. (2006) find very little difference in the binary fraction (more correctly, the com-panion star frequency, see their figs. 10 and 11) with radius.
(a) 0.1 pc half-mass radius, 100 per cent binary fraction. (b) 0.8 pc half-mass radius, field binary fraction.
Figure 6.The binary fraction as a function of radius after 1 Myr of evolution for clusters containing 1500 stars but with different initial binary fractions and different initial densities: (a) with an initial half-mass radius of 0.1 pc and a binary fraction of 100 per cent, and (b) with an initial half mass radius of 0.8 pc and a field-like binary fraction. We plot the binary fraction of all stars in the cluster against the distance from the centre in half-mass radii. This enables a direct comparison with the ONC data in figs. 10 and 11 in K¨ohler et al. (2006).
be well-mixed and evolved within a few hundred thousand years (as discussed above) and no very significant differences between the binary fractions in the inner and outer regions would be expected. In Fig. 6 we show the radial variation of the binary fraction at 1 Myr in a dense (r1/2 = 0.1 pc) cluster with an initial binary fraction of 100 per cent and low-density (r1/2 = 0.8 pc) cluster with an initial field-like binary fraction. (Note that the dense cluster expands, so that after 1 Myr r1/2 = 0.2 pc, whereas the sparse cluster retains its initial half-mass radius.) Our simulations show a trend towards an increasing binary fraction with radius for the low-density (dynamically young) cluster, and no trend in the high-density (dynamically old) cluster.
Reipurth et al. (2007) do find that the ratio of wide-to-close binaries increases with radius within the inner pc, and is flat beyond this (see their fig. 9; close binaries are 66 – 225 AU, and wide binaries are 225 – 670 AU). However, easily within the errors the ratios are flat beyond the inner 0.5 pc, and it is only within the inner 0.5 pc that there are significantly fewer wide binaries than close ones. This is not at all unexpected. While the Orion cluster has been expand-ing from its proposed denser initial state, it will still undergo dynamical processing as wider binaries are always more sus-ceptible to destruction in the inner regions of a cluster than in the outer regions. If Orion was always at its current size, then the wide binary population in the outer regions is very close to theinitialpopulation, whilst in the inner regions it has been processed (the situation in Fig. 6(b)). However, if Orion was originally far denser, then the wide binary pop-ulation has been processed in every region of the cluster, only somewhat more so in the inner regions (the situation in Fig. 6(a)) and at no location in the cluster do we see the initial wide binary population. This leads to our third point.
• Finally, Scally et al. (1999) find very little evidence
of binaries with separations>1000 AU in the ONC. If the ONC formed at low density, it must have formed with almost no binaries with separations > 1000 AU as a low density cluster could not have been able to destroy a population of binaries this wide in 1 Myr. But the lack of binaries with separations>1000 AU can easily be explained if the ONC was far more dense in the past as it would have destroyed the majority of binaries with these separations. In addition, that we do not see binaries with separations > 1000 AU even in the very outer regions of the cluster suggests that theentirecluster has been dynamically processed.
Whilst none of these arguments show conclusively that the ONC has expanded from an initially dense stage, we think they are at least an indication. However, we would also note that Allison et al. (2009, ApJL, submitted) can explain the formation of the Trapezium if the ONC was once∼100 times denser.
5 DISCUSSION
Binary fractions and multiplicities are clearly strong con-straints on theories of star formation (Goodwin et al. 2007). However, it is often very difficult to compare the outcomes of theory with observations. In particu-lar, the outcome of star formation theories cannot be directly compared to the field (as attempted by e.g. Goodwin, Whitworth & Ward-Thompson 2004; Bate 2009) as (a) there is significant dynamical evolution in dense clus-ters which will alter the star formation products, and (b) the field is the sum of many star forming regions and modes (e.g. Brandner & K¨ohler 1998).
We have examined two density regimes – high-density clusters (104 − 105M
(O(102) M
⊙ pc−3). We have argued that these two groups bracket the vast majority of densities in cluster-forming star formation. We have seen thatneither low- or high-density clusters allow binaries with separations >104 AU to exist. And high-density clusters do not allow binaries with separa-tions>103 AU to exist. However, observations of the field show that such binaries apparently do exist in significant numbers. This raises a number of questions about the origin of the field population.
5.1 Where do binaries of different separations come from?
In the following discussion we will examine the origin of the field binary population from clustered and isolated star formation. For simplicity we will assume that 20 per cent of star formation occurs isolated (ISF) (actually the figure is probably somewhat less than this and could be as low as 10 per cent; Lada & Lada 2003), and 40 per cent each in low-density clusters (LDC) and high-density clusters (HDC) (i.e. low- and high-mass clusters with aβ =−2 power-law cluster mass function).
We will also assume that the G-dwarf field separation distribution (i.e. the Duquennoy & Mayor 1991 Gaussian) also holds for other stellar masses. In particular, we assume it holds for M-dwarfs which might not be a particularly good assumption as (a) the Fischer & Marcy (1992) data is only in rough agreement with the G-dwarf distribution, and (b) the Fischer & Marcy data probably only holds for M-dwarfs with masses >0.3 M⊙(e.g. Lada 2006). However, these as-sumptions at least allow us to discuss the pertinent points. We can divide binaries into four broad categories based on their separations. Binaries with separations<50 AU are ‘always hard’ – no density of cluster significantly changes the separation distribution in this range. Binaries with separa-tions of 50 – 1000 AU are ‘sometimes hard’ – high-density clusters can destroy some of this population, but low density clusters and isolated regions cannot. Binaries with separa-tions in the range 103 – 104 AU are ‘soft-intermediates’ – high density clusters destroy such binaries, and low-density clusters destroy some. Binaries with separations >104 AU are ‘always soft’ – any cluster will destroy such binaries (if they could even form in the first place).
• Roughly 50 per cent of binaries are ‘always hard’. Such systems cannot be destroyed by all but the most ex-treme cluster densities and so the field population must rep-resent the sum of binaries formed in HDC, LDC and ISF star formation.
Thus, the binary fraction and separation distribution below 50 AU must be a fundamental outcome of the star formation process. That is, a combination of HDC, LDC and ISF must produce around 30 per cent of G-dwarfs7 and 15 – 20 per cent of M-dwarfs with a companion <50 AU and the combined separation distribution in this range must match the field.
• Around 10 – 15 per cent of binaries in the field are ‘sometimes hard’. Therefore star formation would be ex-pected to slightly over-produce such systems as many in
7 i.e. 50 per cent of the 60 per cent of G-dwarfs in binaries.
HDCs will be destroyed, but those in LDCs and ISF would be unaffected.
The over-production in this range need not be extreme as they survive in around 60 per cent of star forming regions (LDCs and ISF), but up to 50 per cent of those that form may be destroyed in HDCs.
Thus, all modes of star formation combined must pro-duce about 10 per cent of G-dwarfs and 5 per cent of M-dwarfs with a companion between 50 and 1000 AU.
•A similar fraction of 10 – 15 per cent of binaries are ‘soft-intermediate’. Those produced in HDCs will be almost all destroyed, many will in LDCs, but those in ISF will re-main.
Following the above arguments, 40 per cent of star for-mation (HDCs) cannot produce soft-intermediates, in 40 per cent of star formation half of those that form may be de-stroyed (in LDCs), and in 20 per cent (ISF) all survive.
Thus, all modes of star formation combined must pro-duceat least 10 per cent of G-dwarfs and 5 per cent of M-dwarfs with a companion between 103and 104AU. Although the fraction formed could be significantly larger.
•That leaves around 20 per cent of binaries that are ‘always soft’ and cannot survive (or even be formed) in any cluster. At first inspection, it appears that such binaries must all form in ISF8.
If these binaries are produced by the ISF mode, 20 per cent of star formation must produce 20 per cent of the to-tal number of binaries. This implies that almost all isolated star formation must produce a binary with a separation
>104 AU.
However, it is difficult to see how even isolated star formation can produce binaries with separations>104 AU. Isolated star forming cores only have radii of∼0.1 pc out to the point at which they merge with the background (e.g. Ward-Thompson et al. 2007, and references therein) and so even a companion forming at the very limit of the core from the primary would only have a 2×10⁴ AU separation (and surely disc fragmentation could not work at such distances). Thus the origin of binaries>a few×103 AU is a mystery.
Clearly, the initial binary separation distribution can-not be identical to the field. However, the form and uni-versality (or otherwise) of the initial binary separation dis-tribution remains unclear. Note that there are two possible ‘initial’ binary separation distributions (BSDs). Firstly, the ‘primordial’ BSD produced as the immediate outcome of star formation, i.e. the distribution that emerges from Class 0/I sources. Secondly, the ‘initial’ BSD that evolves rapidly from the primordial BSD due to circularisation and interactions with discs. It is the evolution from primordial to initial BSDs that eigenevolution (Kroupa 1995b) attempts to capture.
Kroupa (1995a,b) described a potential initial BSD in which the closer binaries (<50 AU) have a field-like distri-bution, and wider binaries over-produced by a factor of∼2 out to 104 AU. However, as we have seen, the formation of binaries as wide as 104 AU is problematic at best in HDCs and all will be destroyed in HDCs. We will return to the
problem of the form of the initial BSD and whether it is universal in a future paper.
6 CONCLUSIONS
We useN–body simulations to dynamically evolve star clus-ters rich in binary systems to examine the effect of dynam-ical interactions on the initial binary population. Our main conclusions are:
• Binary processing occurs within only a few initial cross-ing times, therefore it is the initial density of a cluster that is of importance in determining the binary population. Clusters older than a few (initial) crossing times will have reached a dynamical equilibrium with their binary popula-tion, dynamically young clusters will have not.
• Binaries in clusters cannot form with the field separa-tion distribusepara-tion. Binaries with separations > 104 AU are too wide to form in any cluster, and binaries with separa-tions>103AU are all destroyed in probably half of clusters.
• Binaries in clusters cannot form with the field binary fraction for systems with separations in the range 50 to a few thousand AU.Many intermediate binaries are destroyed, therefore they must be overproduced relative to the levels observed in the field.
• Binaries in clusters must form with roughly the cor-rect binary fraction and separation distribution for systems closer than∼50AU.Hard binaries are relatively unaffected by dynamical evolution; small amounts of destruction and modification do occur, but not enough to seriously affect this population.
• The central region of the Orion Nebula Cluster was ini-tially ∼6times smaller (∼200times denser) than it is to-day. The binary populations were established and well-mixed at this time when the crossing time was significantly shorter.
Therefore we expect there to be only small differences be-tween the binary populations in the inner and outer regions of Orion as is observed (K¨ohler et al. 2006). However, fur-ther observations are required to help distinguish between different models for the current and past state of the ONC.
A comparison of the results of star formation to the field distribution at separations <50 AU probably should be made, as this population should not normally be af-fected by dynamical evolution. However, it is not clear if low- and high-density environments and isolated star for-mation should always produce the same distribution(s).
It appears that star formation should – for all masses, including M-dwarfs – produce more binaries with separa-tions in the range 102 – 104 AU than are observed in the field as such binaries are highly susceptible to destruction in clusters (depending on density). But again, it is not clear if low- and high-density environments and isolated star for-mation should always produce the same distribution(s).
However, star formation in clusters need not produce any binaries with separations >104 AU, as such binaries – although observed in the field – just cannot survive in clus-ters, even if they can form. Their origin is a major problem in star formation and star clusters as it cannot be explained if most stars form in clusters.
ACKNOWLEDGEMENTS
We would like to thank the anonymous referee for their comments which lead us to extend the scope of this work and (we hope) make it far more interesting. RJP acknowl-edges financial support from STFC. MBNK was supported by PPARC/STFC under grant number PP/D002036/1. The authors acknowledge the Sheffield–Bonn Royal Society In-ternational Joint Project grant, which provided financial support and the collaborative opportunities for this work. RJP, SPG and MBNK acknowledge the support and hospi-tality of the International Space Science Institute in Bern, Switzerland where part of this work was done as part of an International Team Programme. This work has made use of the Iceberg computing facility, part of the White Rose Grid computing facilities at the University of Sheffield.
REFERENCES
Aarseth S. J., H´enon M., Wielen R., 1974, A&A, 37, 183 Abt H. A., Gomez A. E., Levy S. G., 1990, ApJS, 74, 551 Allison R. J., Goodwin S. P., Parker R. J., de Grijs R., Portegies Zwart S. F., Kouwenhoven M. B. N., 2009, ApJL, submitted
Bastian N., Gieles M., Goodwin S. P., Trancho G., Smith L. J., Konstantopoulos I., Efremov Y., 2008, MNRAS, 389, 223
Bastian N., Goodwin S. P., 2006, MNRAS, 369, L9 Bate M., 2009, MNRAS, 392, 590
Binney J., Tremaine S., 1987, Galactic Dynamics. Prince-ton, NJ, Princeton University Press, 1987, 747 p. Brandner W., K¨ohler R., 1998, ApJ, 499, L79 Duquennoy A., Mayor M., 1991, A&A, 248, 485
Feigelson E. D., Getman K., Townsley L., Garmire G., Preibisch T., Grosso N., Montmerle T., Muench A., Mc-Caughrean M., 2005, ApJS, 160, 379
Fischer D. A., Marcy G. W., 1992, ApJ, 396, 178 Goodwin S. P., Bastian N., 2006, MNRAS, 373, 752 Goodwin S. P., Kroupa P., 2005, A&A, 439, 565
Goodwin S. P., Kroupa P., Goodman A., Burkert A., 2007, in Reipurth B., Jewitt D., Keil K., eds, Protostars and Planets V The Fragmentation of Cores and the Initial Binary Population. pp 133–147
Goodwin S. P., Whitworth A. P., Ward-Thompson D., 2004, A&A, 414, 633
Heggie D. C., 1975, MNRAS, 173, 729
Hillenbrand L. A., Hartmann L. W., 1998, ApJ, 492, 540 Hills J. G., 1975a, AJ, 80, 809
Hills J. G., 1975b, AJ, 80, 1075
Jeffries R. D., 2007a, MNRAS, 376, 1109 Jeffries R. D., 2007b, MNRAS, 381, 1169 Jones B. F., Walker M. F., 1988, AJ, 95, 1755
K¨ohler R., 2004, in Allen C., Scarfe S., eds, Revista Mexicana de Astronomia y Astrofisica Conference Se-ries Vol. 21 of Revista Mexicana de Astronomia y As-trofisica Conference Series, What causes the Low Binary Frequency in the Orion Nebula Cluster?. pp 104–108 K¨ohler R., Petr-Gotzens M. G., McCaughrean M. J.,
Bou-vier J., Duchˆene G., Quirrenbach A., Zinnecker H., 2006, A&A, 458, 461
Kouwenhoven M. B. N., Goodwin S. P., Parker R. J., Kroupa P., 2009b, MNRAS, in prep.
Kouwenhoven M. B. N., Brown A. G. A., Portegies Zwart S. F., Kaper L., 2007, A&A, 474, 77
Kouwenhoven M. B. N., Brown A. G. A., Zinnecker H., Kaper L., Portegies Zwart S. F., 2005, A&A, 430, 137 Kouwenhoven M. B. N., de Grijs R., 2008, A&A, 480, 103 Kroupa P., 1995a, MNRAS, 277, 1491
Kroupa P., 1995b, MNRAS, 277, 1507 Kroupa P., 2000, New Astronomy, 4, 615 Kroupa P., 2002, Science, 295, 82
Kroupa P., 2008, in Aarseth S. J., Tout C. A., Mardling R. A., eds, Lecture Notes in Physics, Berlin Springer Ver-lag Vol. 760 of Lecture Notes in Physics, Berlin Springer Verlag, Initial Conditions for Star Clusters. p. 181 Kroupa P., Aarseth A., Hurley J., 2001, MNRAS, 321, 699 Kroupa P., Bouvier J., Duchˆene G., Moraux E., 2003,
MN-RAS, 346, 354
Kroupa P., Burkert A., 2001, ApJ, 555, 945
Kroupa P., Petr M. G., McCaughrean M. J., 1999, New Astronomy, 4, 495
Lada C. J., 2006, ApJ, 640, L63
Lada C. J., Lada E. A., 2003, ARA&A, 41, 57
McCaughrean M. J., Stauffer J. R., 1994, AJ, 108, 1382 Mason B. D., Gies D. R., Hartkopf W. I., W. G. Bagnuolo
J., ten Brummelaar T., McAlister H. A., 1998, AJ, 115, 821
Mathieu R. D., 1994, ARA&A, 32, 465
Maxted P. F. L., Jeffries R. D., Oliveira J. M., Naylor T., Jackson R. J., 2008, MNRAS, 385, 2210
Mayor M., Duquennoy A., Halbwachs L., Mermilliod J.-C., 1992, in McAlister H. A., Hartkopf W. I., eds, IAU Colloq. 135: Complementary Approaches to Double and Multiple Star Research Vol. 32 of ASP Conference Series, CORAVEL Surveys to Study Binaries of Different Masses and Ages. IAU, pp 73–81
Olczak C., Pfalzner S., Eckart A., 2008, A&A, 488, 191 Patience J., Ghez A. M., Reid I. N., Matthews K., 2002,
AJ, 123, 1570
Pfalzner S., Olczak C., 2007, A&A, 475, 875 Plummer H. C., 1911, MNRAS, 71, 460
Portegies Zwart S. F., McMillan S. L. W., Hut P., Makino J., 2001, MNRAS, 321, 199
Portegies Zwart S. F., Makino J., McMillan S. L. W., Hut P., 1999, A&A, 348, 117
Reipurth B., Guimar˜aes M. M., Connelley M. S., Bally J., 2007, AJ, 134, 2272
Scally A., Clarke C., McCaughrean M. J., 1999, MNRAS, 306, 253
Scally A., Clarke C., McCaughrean M. J., 2005, MNRAS, 358, 742
Thies I., Kroupa P., 2008, MNRAS, 390, 1200
Tobin J. J., Hartmann L., Furesz G., Mateo M., Megeath S. T., 2009, ArXiv e-prints: 0903.2775