Evaluation of Floor Vibrations Induced by
Walking Barefoot in Heavyweight Buildings
Pyoung Jik Lee1), Byung Kwon Lee2), Michael J. Griffin3)
1)Acoustics Research Unit, School of Architecture, University of Liverpool, Liverpool, L69 7ZN, UK.
2)Daelim Industrial Co., Korea
3)Human Factors Research Unit, Institute of Sound and Vibration Research, University of Southampton,
Southampton, UK
Summary
Floor vibrations induced by humans walking barefoot were investigated in heavyweight buildings. Six floating
floors with different floor structures and thick resilient isolators were built in laboratories with the same
dimen-sions and boundary conditions. Subjective tests were performed to assess the vibration serviceability of the floor structures. In the first test, subjects were asked to walk across a floor and then rate the intensity of the vibrations, and the acceptability and serviceability of the floors. In the second test, subjects were seated on a chair in the middle of the floor and asked to rate the floor vibrations when a walker passed by the subjects. Floor vibrations induced by human walking were analysed using peak acceleration, root-mean-square (r.m.s.) acceleration, and
the vibration dose value (VDV), with four frequency weighting functions (Wb,Wk,Wg, andWm). Significant
differences in the measured floor vibrations were found across the floor structures with greater floor vibration
leading to greater perceived vibration intensity, lower acceptability, and lower serviceability. The VDV was cor-related with perceptions of floor vibration when used with all four frequency weighting functions. The impact noise induced by walking did not influence subjective evaluations of floor vibration. A heavy/soft impact source
(a standard impact source) provided a useful prediction of differences between the perception of the vibration on
different floors.
PACS no. 43.40.Ng, 43.50.Qp, 43.66.Wv
1. Introduction
Vibration disturbance in a building often comes mainly from external sources, such as industrial machinery or transportation, but internal sources (e.g., domestic equip-ment, doors banging, and footfalls) can also produce dis-turbance [1, 2]. Floor vibration induced by human walk-ing is of special interest because it is the most common vibration source that occurs inside a building, and walking may occur at the natural frequency of the floor resulting in amplitude amplification [3, 4]. Although floor vibration induced by human walking can be small in amplitude it can result in considerable annoyance and discomfort for the occupants of a building.
Studies have investigated floor vibration due to human walking in relation to problems with floor serviceabil-ity. Lightweight floors have low mass and low structural damping compared to heavyweight floors, and these char-acteristics result in the dynamic response being greater, which is perceived as problematic to floor vibration [5].
Received 01 October 2014, accepted 18 August 2015.
Thin post-tensioned concrete slabs can result in floor ser-viceability problems due to the reduction of stiffness [4]. Long span floors with low natural frequency may also have floor vibration problems because humans are more sen-sitive to acceleration at lower frequencies than at higher frequencies [4]. Most previous studies of floor vibration have therefore focused on lightweight floors and long span floors [6, 7].
vari-Table I. Floor structures used in the study.d: Total thickness [mm],s: Dynamic stiffness [MN/m3].
Floor d Cross-sectional detail s
1 320 Concrete slab (210 mm)+Resilient isolator (25 mm)+Floating floor unit (35 mm)+Mortar (50 mm) 19.7
2 320 Concrete slab (210 mm)+Resilient isolator (60 mm)+Mortar (50 mm) 22.8
3 290 Concrete slab (180 mm)+Isolating pad (10 mm)+Floating floor unit (50 mm)+Mortar (50 mm) 28.0
4 290 Concrete slab (180 mm)+Resilient isolator (20 mm)+Lightweight concrete (45 mm)+Mortar (45 mm) 14.8
5 330 Concrete slab (210 mm)+Floating floor unit (90 mm)+Precast concrete panel (30 mm) 13.3
6 320 Concrete slab (210 mm)+Isolating pad (10 mm)+Resilient isolator (50 mm)+Mortar (50 mm) 14.6
#5 #6
#1 #2
#3 #4
Figure 1. Section of the floor structures used in the study.
ations of panel size and joist spacing [11]. However, re-silient isolators were not included in their floor structures. There is little understanding of the vibration performance and serviceability of floating floors with thick isolators.
Floor vibration has been assessed using walking tests in both existing buildings and in laboratories. With a walking man exciting the floor of an office, a measure of floor ser-viceability was proposed in terms of the root-mean-square (r.m.s.) of the floor vibration [12]. Walking tests have also been conducted on the floor of a large cantilevered office with, among various alternative objective parameters, the vibration dose value (VDV) found to be a reliable mea-sure for evaluating floor vibration [13]. Although four dif-ferent frequency weighting functions (Wb,Wk,Wg, and
Wm) were applied, the relative performance of the
alterna-tive frequency weightings was not examined. In laboratory tests, subjects have walked across floor structures (wooden and hollow core concrete floors) and been asked to rate the vibration intensity and acceptability of the floors [14, 15].
The subjects also rated the floor serviceability when seated on a chair with the floors excited by a walker. Floor vibra-tion was measured in terms of theWm-weighted r.m.s.
ac-celeration, but the relationship between the objective mea-sure and the subjective rating was not investigated. Simi-larly, subjects have evaluated walking discomfort and floor acceptability after walking freely on mock-up floors with variations of panel size and joist spacing [11, 16]. TheWk
-weighted VDV for each walk event (VDVi) was used to
evaluate the floor vibration, and the subjective responses were highly correlated with the VDVi. Such tests are
lim-ited by the boundary conditions of real buildings and so consideration of appropriate objective methods for assess-ing floor vibrations (frequency weightassess-ings, and either the peak, the r.m.s., or the VDV) have also been limited.
The present study was designed to assess alternative methods of predicting human acceptability of floor vibra-tions induced by people walking in heavyweight buildings. Six floating floors with different thickness and different in-sulating layers were installed in a test building to reflect the boundary conditions of a living room. Two types of walking test were performed: (i) subjects walking across the floor by themselves, and (ii) subjects seated while an-other person walked back and forth across the floor. The subjects were asked to evaluate vibration intensity, floor acceptability, and floor serviceability.
2. Methods
2.1. Test buildingFloor vibration was measured in a test building used for practical testing and certification. The building had a box frame-type structural system, with each room rectangu-lar (4.5 m ×3.5 m). The ratio of the width to the length was determined to simulate the living rooms of residen-tial buildings in Korea. A sliding door was in the frontal wall to reflect the boundary conditions of the living room. The volume of each room was 37.8 m3, and all the rooms
were unfurnished. The reverberation time at 500 Hz was 1.1 s and the A-weighted equivalent sound pressure level (LAeq) of the background noise was less than 23 dB. 2.2. Experimental floor structures
[image:2.595.20.252.192.492.2]the floor structure. Basically, the floors consisted of rein-forced concrete slabs, an insulating layer, lightweight con-crete, finishing mortar, or a precast concrete panel, and all floors had heating pipes for floor heating. Four floors (#1, #2, #5, and #6) had a 210-mm thick reinforced concrete slab, while two floors (#3 and #4) had a 180-mm thick concrete slab. Floors #5 and #6 were installed in the base-ment so concrete slabs for them were constructed on the ground. For floor #1, each floating floor unit (width: 0.6 m and length: 0.6 m) was supported by four plastic piles with a vibration isolating pad underneath. The 25 mm-thick Ex-panded Polystyrene (EPS) resilient isolators were placed between the floating floor unit and concrete slab. Floor #2 had an Ethylene Vinyl Acetate (EVA) resilient isola-tor. The bottom of the resilient isolator was uneven so that there were air cavities between the resilient isolator and concrete slab. For floor #3, the floating floor units (width: 0.6 m and length: 0.6 m) including a 30 mm-thick EPS resilient isolator were placed on the concrete slab. There were six isolating pads on the bottom of each panel. Floor #4 had 20 mm-thick flat resilient isolators (EVA) on the concrete slab. For floor #5, the floating floor unit con-sisted of 20 mm-thick Expanded Polyethylene (PE) foam, 30 mm-thick EPS resilient isolator, and 40 mm-thick plas-tic board. A precast concrete panel was then placed on the floating floor units. Floor #6 had a 50 mm-thick EPS re-silient isolator. The 10 mm-thick PE isolating pads were evenly distributed under the EPS resilient isolator. The dy-namic stiffness of the resilient isolators or the floating floor units measured by ISO 9052-1 [17] are listed in Table I. The dynamic stiffness showed a large variation from 13.3 to 28.0 MN/m3. Therefore, it was expected that the
dif-ferent compositions of the floor structures would lead to differences in the dynamic properties of the floors.
2.3. Procedure
Prior to subjective evaluations, driving-point mobility was measured to investigate the dynamic characteristics of the experimental floors. The centre of each floor was excited by an impulse hammer, and the resulting vibrations of the floors were measured using an accelerometer located 20 cm from the excitation position. To improve the statistical reliability, the response data were averaged for more than five excitations. The driving-point mobility for each of the six experimental floors was derived from these measure-ments.
Walking tests were then performed in order to assess the vibration serviceability of the experimental floor struc-tures. The experiments consisted of two walking tests: Test I with the subject walking, and Test II with the subject seated while another person walked, in a similar manner to previous studies [14, 15]. The subjects walked barefoot because it was assumed they were in a living room.
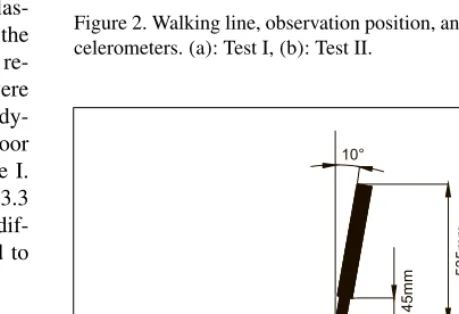
In Test I, as shown in Figure 2a, the test subjects walked across the floor structure themselves, a travel length of about 5.7 m. When they reached the corner of the room, they turned and walked back to the starting position, and then repeated each walk once. The speed of walking (step
Walking line Accelerometers
Walking line Accelerometer
[image:3.595.271.500.55.339.2]Subject position
Figure 2. Walking line, observation position, and locations of ac-celerometers. (a): Test I, (b): Test II.
10°
535mm
480mm
145mm
Figure 3. Diagrammatic representation of the rigid seat.
frequency) is a dominant factor affecting the vibration of floors [18]. The subjects were asked to complete each walk in around 4.5 s, corresponding to a step frequency of 1.7– 2.0 Hz for normal walking [4]. Before the measurements, the subjects were trained to walk with a constant step fre-quency along the path using a metronome. The subjects repeated each test wearing ear plugs to examine the influ-ence of sound on vibration perception.
[image:3.595.272.502.384.541.2]Table II. Questionnaires used in the subjective tests.
Evaluation Vibration intensity Floor acceptability Floor serviceability
Questionnaire Please, rate the intensity of the
vibrations. Is the floor acceptable in anewly built apartment? Please, rate the vibration service-ability (performance) of the floor on a scale from 0 to 10.
1: Imperceptible 1: Absolutely unacceptable 0: Very poor
2: Barely perceptible 2: Unacceptable 10: Very good
Rating scale 3: Distinctly perceptible 3: Marginal
4: Strongly perceptible 4: Acceptable
5: Extremely perceptible 5: Absolutely acceptable
The national statistics of the Korean Government [19] re-ported that the average weight and height of men aged between 20–70 years were 71.1 kg and 170.6 cm, respec-tively. Therefore, a male subject with a weight of 68.4 kg and a height of 170.1 cm was chosen as the walker in this study. He walked back and forth on the floor structure with a step frequency of about 2.0 Hz, with a consistent walking pattern for all subjects. The subjects rated their perception of the floor vibrations after the walker had passed the ob-servation point two times.
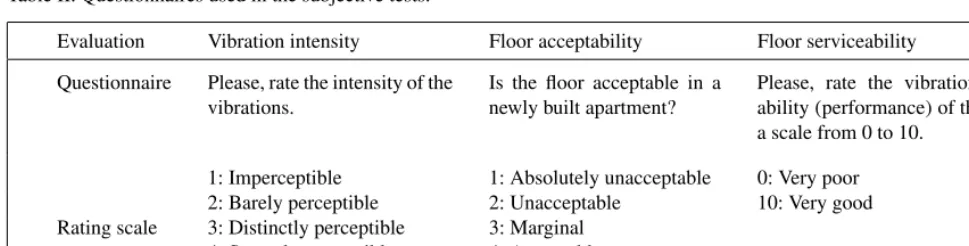
It is reasonable to assume that optimum comfort within a building requires the absence of perceptible vibration, and that the perception of any building vibrations is un-acceptable. However, floor vibration sometimes occurs at vibration levels above the threshold, so some researchers [11, 20, 21] have considered degrees of ‘acceptability’ of floor vibration when it is perceptible in buildings. An alter-native criterion is floor ‘serviceability’ [22]. Some studies of floor vibration have therefore obtained subjective eval-uations of both floor acceptability and floor serviceability [11, 14, 15, 21]. So, after each test, the subjects rated ‘floor acceptability’ and ‘floor serviceability’ as well as the ‘vi-bration intensity’. As described in Table II, the ‘vi‘vi-bration intensity’ was assessed using a 5-point scale. They were asked to rate the ‘acceptability’ of the floor structure as if it was installed in a newly built residential building. Fi-nally, they were asked to rate the vibration performance of the floor structure (floor serviceability) on a scale from 0 to 10 (with 0 as ‘very poor’ and 10 as ‘very good’).
2.4. Subjects
A total of 20 subjects (twelve males and eight females) participated in the experiment. Their ages ranged from 24 to 36 years (mean: 29.8 and standard deviation: 3.4). The weights of the subjects varied from 43 to 96 kg (mean: 71.6 and standard deviation: 13.9), and their statures ranged from 159 to 188 cm (mean: 175.3 and standard deviation: 8.6). The number of subjects and the demo-graphics were similar to those used in previous studies [1, 23, 24] of the perception of vibration in a laboratory setting. In addition, all of them had experienced living in apartment buildings with floating floors. The experiment lasted about 60 minutes with all subjects giving their vol-untary consent prior to the start of the experiment.
2.5. Apparatus
An impact hammer (Dytran 5803A) and one accelerom-eter (KB12VD, MMF) were used in the driving-point mobility tests. Floor vibrations induced by walking were measured by accelerometers (KB12VD, MMF). In Test I, two accelerometers were connected to a spectrum analyser (B&K 2032) and a laptop computer to record and anal-yse the floor vibrations. As shown in Figure 2a, one ac-celerometer was placed near the corner of the room and another near the centre of the room. In Test II, only one accelerometer was located on the floor near the observa-tion posiobserva-tion.
2.6. Vibration analysis
Floor vibrations induced by human walking were anal-ysed in terms of the peak acceleration, root-mean-square (r.m.s.) of the measured accelerations, and the vibration dose value (VDV) using HVLab software. The r.m.s. value of the frequency-weighted acceleration time history,aω(t),
over a finite period of timeT is one of the basic methods for evaluating the vibration [24],
r.m.s.=
1
T
T
0 aω(t)
2dt1/2. (1)
The r.m.s. does not allow for the effect of vibration du-ration on human response and, as an average measure, it does not increase with increasing duration. Therefore, the VDV was introduced and included in the standards for the evaluation of the building vibration [25, 26, 27]. As de-fined in Equation (2), the VDV accumulates the vibration rather than averaging and so increases with increasing du-ration of vibdu-ration. The unit of VDV is ms−1.75.
VDV=
1
T
T
0 a 4 ω(t) dt
1/4
. (2)
In the present study, the duration of the measured vibra-tion stimuli was fixed at 4.5 s. Four frequency weightings were used: 1)Wbfor vertical vibration based on BS
6472-1:2008 [27]; 2) Wk for vertical vibration based on ISO
2631-1:1997 [25]; 3) Wg for vertical vibration based on
ISO 10137:2007 [28]; 4)Wmfor vertical or horizontal
Table III. Fundamental frequencies and damping ratios of the
ex-perimental floor structures.f0: Fundamental frequency [Hz],ζ:
Damping ratio [%].
Floor 1 2 3 4 5 6
f0 20 36 21 31 89 54
ζ 17.5 5.6 19.0 6.5 20.8 18.5
2.7. Statistical analysis
Statistical analyses were performed using SPSS for Win-dows (version 20.0, SPSS Inc., Chicago, IL). Differences in the mean values were tested with the Wilcoxon test to estimate the significance of the differences in the subjec-tive responses between Test I and Test II, and to investi-gate the effects of sound on subjective responses. The re-lationships between the objective measures and subjective responses to the floor vibrations were investigated using Pearson’s correlation test. In this study,pvalues less than 5% (p <0.05) were considered statistically significant.
3. Results
3.1. Objective characteristics of the floors
Figure 4 shows the magnitude of driving-point mobility for the six experimental floors on a decibel scale. The fre-quency characteristics differed across the floors depend-ing on the composition of the floor structures. The mea-sured modal parameters are listed in Table III. The fun-damental frequencies (the frequency of the 1st mode) of floors #1 and #3 were found to be less than 30 Hz, whereas floor #5 had a fundamental frequency at 89 Hz. The mea-sured damping ratios, which were evaluated using the half-power bandwidth method, varied from 5.6% on floor #2 to 20.8% on floor #5. Large variations in fundamental fre-quency and damping ratios were consistent with floor vi-brations depending on the dynamic characteristics of the impact isolators in multi-layered floor structures [29].
3.2. Measured floor vibrations induced by walking
Examples of the acceleration power spectral densities of the floor vibrations induced by a male subject (height: 173 cm and weight: 71 kg) are shown in Figure 5. Only the measured data from the accelerometer at the centre were used. The frequency characteristics differed across the floors depending on the composition of the floor struc-tures. Floors #1 and #3 show spectral peaks around 20 and 40 Hz, and floor #6 shows peaks around 20, 40, and 60 Hz. Floor #2 shows a peak around 40 Hz and floor #4 has a peak at 25 Hz. Floor #5 has energy in the range 20 to 50 Hz, but with a magnitude much lower than on the other floors. The unweighted VDV varied greatly between 0.029 and 0.402 ms−1.75. The acceleration time histories of the
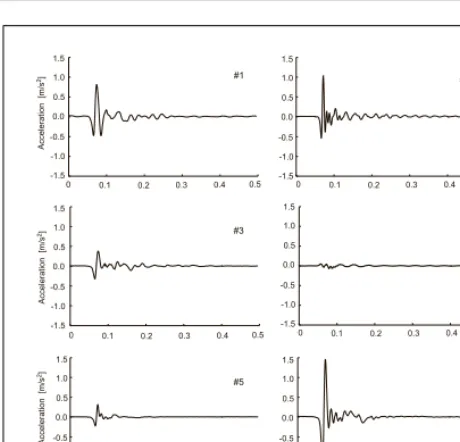
single impacts from the floor vibrations produced by the same person are presented in Figure 6 using the data from the accelerometer at the centre of the floor. There are dif-ferences in the peak accelerations and the durations of the impacts between the floor structures.
[image:5.595.270.498.323.555.2]1 1 1 1 1 1 10 10 10 10 10 10 100 100 100 100 100 100 Frequency (Hz) Frequency (Hz) Floor #6 Floor #5 Floor #3 Floor #1 Floor #4 Floor #2 -60 -60 -60 -60 -60 -60 -70 -70 -70 -70 -70 -70 -80 -80 -80 -80 -80 -80 -90 -90 -90 -90 -90 -90 Driving-point mobility ,d B Driving-point mobility ,d B Driving-point mobility ,d B -100 -100 -100 -100 -100 -100 -110 -110 -110 -110 -110 -110 -120 -120 -120 -120 -120 -120
Figure 4. Magnitudes of driving-point mobility for the experi-mental floors. 0 0 0 0 0 0 0 0 0 0 0 0 20 20 20 20 20 20 10 10 10 10 40 40 40 40 40 40 20 20 20 20 60 60 60 60 60 60 30 30 30 30 80 80 80 80 80 80 40 40 40 40 100 100 100 100 100 100 50 50 50 50 50 100 150 50 100 150 Power [ (m/s )/ Hz] 2 2 Power [ (m/s )/ Hz] 2 2 Pow er [ (m/s )/ Hz] 2 2 Frequency (Hz) Frequency (Hz)
#1: VDV = 0.348 ms-1.75 #2: VDV = 0.155 ms-1.75
#3: VDV = 0.115 ms-1.75
#4: VDV = 0.029 ms-1.75
#5: VDV = 0.079 ms-1.75
#6: VDV = 0.402 ms-1.75
Figure 5. Acceleration power spectral densities of the floor vi-brations.
Figure 7 shows the frequency-weighted (Wb) vibrations
0 0 0
0
0.0 0.0
0.0 0.0
0.0 0.0
0.5 0.5
0.5 0.5
0.5 0.5
1.0 1.0
1.0 1.0
1.0 1.0
1.5 1.5
1.5 1.5
1.5 1.5
-1.5 -1.5
-1.5 -1.5
-1.5 -1.5
-1.0 -1.0
-1.0 -1.0
-1.0 -1.0
-0.5 -0.5
-0.5 -0.5
-0.5 -0.5
0 0
0.1 0.1 0.1
0.1 0.1 0.1
0.2 0.2 0.2
0.2
Time [s] Time [s]
0.2 0.2
0.3 0.3 0.3
0.3 0.3 0.3
0.4 0.4 0.4
0.4 0.4 0.4
0.5 0.5 0.5
0.5 0.5 0.5
Acceleration
[m/s
]
2
Acceleration
[m/s
]
2
Acceleration
[m/s
]
2 #1 #2
#3 #4
[image:6.595.22.252.58.279.2]#5 #6
Figure 6. Acceleration time histories of single impacts of the floor vibration.
1 2 3 4 5 6
1 2 3 4 5 6
1 2 3 4 5
Floors
VDV
[ms
]
-1.75
r.m.s.
[ms
]
-2
Peak
[ms
]
-2
0.00 0.05 0.10 0.15 0.00 0.0 0.1 0.2 0.3 0.4 0.5
0.01 0.02 0.03 0.04
0.20
(c) (b) (a)
[image:6.595.271.503.109.215.2]6
Figure 7.Wbweighted floor vibrations: (a) peak acceleration, (b)
r.m.s. acceleration, and (c) VDV.
floor structures including the different types of sound in-sulating layers. Similar tendencies were found with r.m.s. acceleration and VDV, showing that the vibration levels of floors #6 and #1 were much greater than the other floors. British Standard [27] describes the threshold of vibration perception as 0.015 m/s2in terms of peak acceleration. As
[image:6.595.270.501.282.468.2]shown in Figure 7a, the floor vibration levels of every floor
Table IV. Mean values and standard errors of the frequency
weighted (Wb) floor vibrations obtained from Test I (M=mean
values,σm=standard error of the mean). Peak: Peak acceleration
[m/s2], r.m.s.: r.m.s. acceleration [m/s2], VDV [m/s−1.75].
Peak r.m.s. VDV
Floor M σm M σm M σm
1 0.205 0.081 0.021 0.008 0.073 0.029
2 0.077 0.038 0.007 0.002 0.025 0.010
3 0.132 0.044 0.016 0.006 0.052 0.017
4 0.082 0.035 0.009 0.003 0.031 0.011
5 0.090 0.087 0.009 0.007 0.033 0.027
6 0.380 0.153 0.029 0.008 0.128 0.045
Table V. Subjective ratings for both Test I and Test II (M=mean
ratings,σm=standard error of the mean). Vib.: Vibration
inten-sity, Acc.: Floor acceptability, Ser.: Floor serviceability.
Floors 1 2 3 4 5 6
Test I
Vib. M 3.3 1.9 2.4 2.0 2.0 3.4
σm 0.70 0.89 0.51 0.52 0.00 0.72
Acc. M 1.9 3.3 2.9 3.3 3.3 1.7
σm 0.77 0.87 0.81 0.77 0.86 0.95
Ser. M 4.2 7.0 6.4 7.0 6.7 2.9
σm 2.14 1.46 1.75 1.03 1.45 1.57
Test II
Vib. M 2.6 1.3 2.2 1.7 1.4 2.8
σm 0.73 0.58 1.05 0.70 0.63 0.98
Acc. M 2.2 3.3 2.9 3.4 3.5 1.8
σm 1.11 1.34 0.77 1.03 0.73 0.91
Ser. M 3.7 7.4 6.1 6.6 6.1 2.9
σm 1.82 1.21 1.41 2.25 2.11 1.20
Table VI. Regression equations obtained from relationships
be-tween theWb-weighted VDV and subjective ratings;RI: rating
of vibration intensity,RA: rating of acceptability,RS: Rating of serviceability (*p <0.05, **p <0.01),R2: Coefficient of
deter-mination.
Regression equation R2
Test I
RI=−227.3VDV2+50.5VDV+0.65 0.96**
RA=175.1VDV2−44.1VDV+4.43 0.95**
RS=190.5VDV2−71.6VDV+8.90 0.94**
Test II
RI=−252.6VDV2+49.8VDV+0.43 0.93**
RA=187.2VDV2−43.7VDV+4.34 0.96**
RS=445.7VDV2−10.8VDV+9.10 0.91**
structure were more than the threshold. Therefore, it was expected that the subjects would feel the vibration of each floor. The VDV values for the six floor structures were highly correlated with the peak acceleration (r = 0.99,
[image:6.595.22.253.322.628.2] [image:6.595.272.504.551.671.2]Extremely perceptile 5
Absolutely acceptable 5 (b) (a)
(c)
Floor
acceptability
Floor
serviceability
Vi
bration
intensity
Strongly perceptile 4
Acceptable 4 Distinctly perceptile 3
Marginal 3 Barely perceptile 2
Unacceptable 2 Imperceptile 1
Absolutely unacceptable 1
Very good
Very poor 0
0
0
0.04
0.04
0.04 0.08
0.08
0.08 0.12 VDV [ms-1.75]
VDV [ms-1.75]
VDV [ms-1.75] 0.12
0.12 0.16
0.16
0.16 1 2 3 4 5 6
1 2 3 4 5 6
0 2 4 6 8 10
[image:7.595.30.420.50.431.2]1 2 3 4 5 6
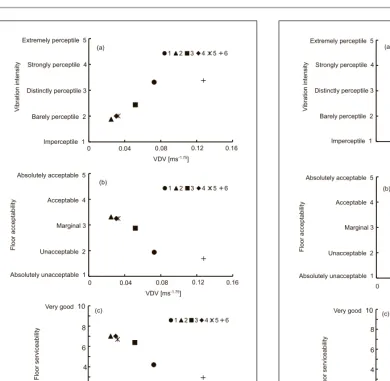
Figure 8. Perceptions of floor vibration for the Test I as a function
ofWb-weighted VDV: (a) vibration intensity, (b) floor
accept-ability, and (c) floor serviceability (Mean values over 20 sub-jects).
3.3. Perceptions of the floor vibration
Figure 8 presents the perceptions of the floor vibration ob-tained from Test I with a person’s own walking as a
func-tion of Wb-weighted VDV. The mean ratings and
stan-dard errors are listed in Table V. The vibration intensity ratings increased significantly as the VDV increased. The mean vibration intensities of floors #1 and #6 were more than ‘3’, corresponding to ‘distinctly perceptible’. The vi-bration intensity ratings for the other floors ranged from 2.1 to 2.5. As the VDV increased from about 0.02 ms−1.75
to about 0.08 ms−1.75, the ratings of vibration intensity
increased progressively. However, the vibration intensity was not much further increased when the VDV of floor #6 increased to around 0.13 ms−1.75. This suggests that on
this scale of vibration intensity the subjects became less sensitive to increases in floor vibration when the VDV was greater than about 0.1 ms−1.75. A number of
regres-sion models were tested to select the best model for de-scribing the relationships between the subjective ratings and the objective measures. As listed in Table VI, the best fitting model for the relationship between the VDV and
Extremely perceptile 5
Absolutely acceptable 5 (b)
(a)
(c)
Floor
acceptability
Floor
serviceability
Vi
bration
intensity
Strongly perceptile 4
Acceptable 4 Distinctly perceptile 3
Marginal 3 Barely perceptile 2
Unacceptable 2 Imperceptile 1
Absolutely unacceptable 1
Very good
Very poor 0
0
0.04
0.04 0.08
0.08 VDV [ms-1.75]
VDV [ms-1.75] 0.12
0.12 0.16
0.16
0 2 4 6 8 10
1 2 3 4 5 6
1 2 3 4 5 6
[image:7.595.254.499.59.429.2]1 2 3 4 5 6
Figure 9. Perceptions of floor vibration for the Test II as a
func-tion ofWb-weighted VDV: (a) vibration intensity, (b) floor
ac-ceptability, and (c) floor serviceability (Mean values over 20 sub-jects).
ratings of vibration intensity was a two degree fractional polynomial (β1VDV2 +β2VDV). Reciprocal tendencies
were found in the ratings of floor acceptability and floor serviceability: the ratings of floor acceptability and floor serviceability decreased with increasing VDV. The ratings of acceptability for floors #1, #3, and #6 were less than ‘3’, which means that they were considered unacceptable for floors in newly built residential buildings. Similar to the rating of vibration intensity, the ratings of floor accept-ability progressively decreased in the range of 0.02 ms−1.75
to 0.08 ms−1.75, but did not reduce much more when the
VDV increased further. As expected, the serviceability rat-ings of floors #1 and #6 were significantly lower than the others (p <0.01 for all comparisons).
sit-ting on the chair the subjects could not feel differences be-tween the floor vibrations when they were not strong. Cor-respondingly, the ratings of floor acceptability and floor serviceability decreased as the VDV increased. Similar to Test I, the ratings of floor acceptability and floor service-ability for floors #1 and #6 were significantly lower than others. Floors #1, #3, and #6 were rated as ‘unacceptable’, with acceptability ratings less than ‘3’.
If VDV values corresponding to a rating of ‘3’ (i.e., ‘marginal’ on the 5-point scale of floor acceptability) were considered the boundary for acceptance, the allowable limits for Test I and Test II were at 0.037 ms−1.75 and
0.035 ms−1.75, respectively. These values are much smaller
than the vibration level corresponding to the acceptance ratio of 50% for floating floors [11]. This is because the previous study [11] measured the floor vibrations in terms of the Wk-weighted VDVi for a single event once the
floors were excited by a heavy/soft impact source [30].
4. Discussion
4.1. Frequency weighting functions for floor vibra-tion induced by human walking
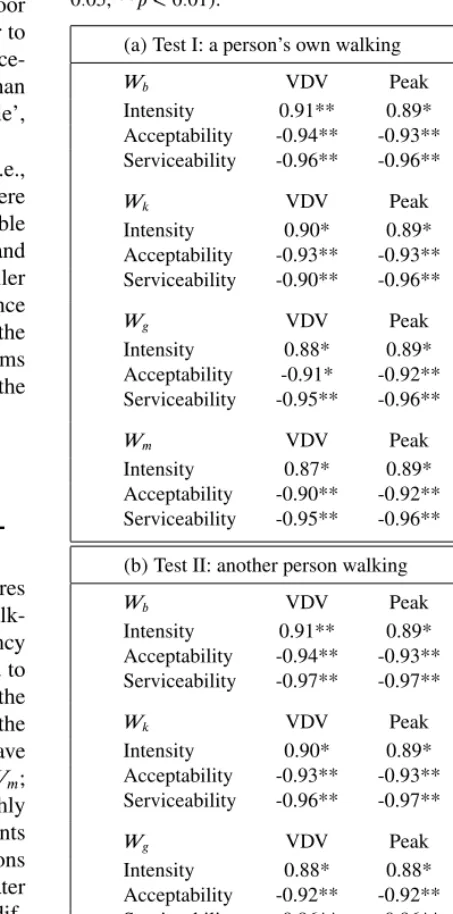
Correlation coefficients between the objective measures and the subjective responses obtained from the two walk-ing tests are listed in Table VII. Four different frequency weighting functions (Wb,Wk,Wg, andWm) were used to
investigate whether the correlations were sensitive to the frequency weighting. For Test I, with subjects judging the vibration caused by their own walking,WbandWk gave
slightly greater correlation coefficients thanWg andWm;
however,Wg andWm also gave values that were highly
correlated with perceptions. The correlation coefficients obtained between all four frequency weighting functions and ratings of acceptability and serviceability were greater than 0.9. The difficulty in distinguishing between the dif-ferent frequency weighting functions may be because al-though there were differences in the vibration spectra, the subjective responses were probably more greatly influ-enced by the large differences in the magnitudes of the vibration on the six floating floors. As shown in Figure 5, the unweighted VDV of floor #6 (0.402 ms−1.75) was
ap-proximately 14 times of that of floor #4 (0.029 ms−1.75).
[image:8.595.274.501.100.558.2]All three vibration measures (VDV, peak, and r.m.s.) yielded high correlation coefficients between the measured vibration and subjective perceptions of the vibration. The similarity in correlations obtained with these three very different measures is again probably because the vibra-tions differed greatly in their magnitude (with all three measures) and this had a greater influence on subjective responses than differences in the waveforms (e.g., stimu-lus durations) that result in differences between the peak, the r.m.s., and the VDV. The VDV is considered an eff ec-tive tool for quantifying vibration events that vary in mag-nitude and duration because, unlike the peak value and the r.m.s., it increases with increasing duration of vibration. As the principal advantage of the VDV was lost in this study, further tests are required to investigate perceptions
Table VII. Correlation coefficients between the objective
mea-sures and subjective responses for weighting functions (*p <
0.05, **p <0.01).
(a) Test I: a person’s own walking
Wb VDV Peak r.ms.
Intensity 0.91** 0.89* 0.95**
Acceptability -0.94** -0.93** -0.96**
Serviceability -0.96** -0.96** -0.97**
Wk VDV Peak r.ms.
Intensity 0.90* 0.89* 0.93**
Acceptability -0.93** -0.93** -0.95**
Serviceability -0.90** -0.96** -0.95**
Wg VDV Peak r.ms.
Intensity 0.88* 0.89* 0.91*
Acceptability -0.91* -0.92** -0.93**
Serviceability -0.95** -0.96** -0.95**
Wm VDV Peak r.ms.
Intensity 0.87* 0.89* 0.90*
Acceptability -0.90** -0.92** -0.93**
Serviceability -0.95** -0.96** -0.95**
(b) Test II: another person walking
Wb VDV Peak r.ms.
Intensity 0.91** 0.89* 0.95**
Acceptability -0.94** -0.93** -0.96**
Serviceability -0.97** -0.97** -0.96**
Wk VDV Peak r.ms.
Intensity 0.90* 0.89* 0.93**
Acceptability -0.93** -0.93** -0.95**
Serviceability -0.96** -0.97** -0.96**
Wg VDV Peak r.ms.
Intensity 0.88* 0.88* 0.91*
Acceptability -0.92** -0.92** -0.94**
Serviceability -0.96** -0.96** -0.95**
Wm VDV Peak r.ms.
Intensity 0.88* 0.88* 0.91*
Acceptability -0.92** -0.92** -0.94**
Serviceability -0.96** -0.96** -0.95**
when floor vibrations are more variable (e.g., when the stimuli have more similar magnitudes and subjects walk freely without a fixed route or period). The VDV may be expected to be more suitable than the peak value or the r.m.s. value when assessing a wide range of sources of floor vibration (e.g., road or rail traffic, construction work, or machinery) as well as walking-induced vibrations.
In Test II, there was a similar tendency for all four fre-quency weighting functions to be correlated with human perceptions of floor vibration and all three measures pro-vided high correlation coefficients.
In this study, the four frequency weighting functions (Wb,Wk,Wg, andWm) had similar performance in
fre-quency weighting function can be used when measuring the vibration of floating floors. Previous studies have re-ported thatWbis more appropriate than the other
weight-ing functions when the levels of vibration are low [30, 31]. Frequency weightingWb provides a reasonable
approxi-mation to the frequency-dependence of equivalent com-fort contours and it is closest to the frequency-dependence of the absolute threshold for perceiving vertical vibration. On this basis,Wbseems more suitable for predicting
sub-jective responses to floor vibration in heavyweight build-ings. This study also confirms that the VDV is a reasonable measure for understanding subjective responses to floor vi-bration [11, 13].
4.2. Differences between own walking and sitting and feeling others walk
It might be hypothesized that subjective responses to floor vibration will differ according to the situation. In the present study, two types of test were conducted to ob-tain judgements of floor vibration both when the subjects walked themselves and when they were seated on a chair and experienced the floor vibration caused by another walker. For judgments of vibration intensity, lower ratings were given when seated than when walking (p < 0.05). This is consistent with the measured vibration levels be-ing slightly less in Test II than Test I, although there were no significant differences between the two tests in ratings of floor acceptability or serviceability. Some studies have found the opposite, suggesting vibrations are less accept-able when produced by another person [14, 15]. The dis-agreement may be due to the different floor structures and different experimental conditions. The two previous stud-ies conducted subjective tests in a laboratory, with sim-ply supported wooden and hollow-core concrete floors. Jo-hansson [15] suggested differences between the two tests occurred because perception of vibration was impeded by the process of one’s own walking. In the present study, subjects did not wear shoes, which may have allowed them to experience the vibration of the floor clearly even when walking.
4.3. Probability of adverse comment and allowable limit of floor vibration
British Standard [27] provides VDV ranges expected to result in various probabilities of adverse comment within residential buildings during 16 hours of daytime or 8 hours of night time. For daytime, a low probability of adverse comment is expected with the VDV in the range 0.2 to 0.4 ms−1.75, adverse comment is possible in the range 0.4
to 0.8 ms−1.75, and adverse comment is probable in the
range 0.8 to 1.6 ms−1.75. The VDV over a day (VDV day)
can be estimated by using the VDV of single vibration for duration ofτsecond (VDVτ) using
VDV=
t
day
tτ
0.25
×VDVτ, (3)
wheretdayis the duration of exposure per day andtτis the
duration of the single vibration.
Table VIII. Number of walking events required from Test I to
reach a low probability of adverse comment (VDVday=0.2)
ac-cording to BS 6472:2008.
Floors 1 2 3 4 5 6
Number of events 58 4146 222 1821 1401 7
In order to determine the possibility of adverse com-ments, the numbers of events required to reach a VDVday
of 0.2 ms−1.75 were calculated using the Wb
frequency-weighted VDV and a single experience of vibration over 4.5 s. As shown in Table VIII, for Test I there were three floors (floors #1, #3, and #6) that required fewer events to reach a VDV of 0.2 ms−1.75than the other floors. The VDV
of floors #6 and #1 would reach VDVdayof 0.2 ms−1.75 if
there were only seven or 58 4.5-s periods of floor vibration, respectively. On the other hand, floor #2 required more than 4,000 4.5-s periods to reach a VDVdayof 0.2 ms−1.75.
4.4. Influence of the sound on perception of vibra-tion
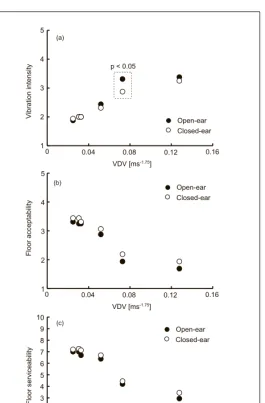
Human responses to vibrations generated in buildings de-pend on various factors including audible noise, visual cues, population type, familiarity with vibration, struc-tural appearance, confidence in a building structure, and knowledge of the source of vibration [28]. The influence of sound on response to floor vibration was investigated in the present study. Subjective ratings with open-ear ditions were compared with those from closed-ear con-ditions during two walking tests (Figures 10 and 11). Independent t-tests were conducted with subjective rat-ings as a dependent variable and two different conditions (open-ear and closed-ear) as the independent variables. Significant differences between the open-ear and closed-ear conditions were found only with floor #1 for the rat-ings of vibration intensity in Test I (where vibration in-tensity was judged greater when not wearing ear plugs;
(a)
(b)
(c)
0
0
0
0.04
0.04
0.04
0.08
0.08
0.08
0.12 Open-ear p < 0.05
Open-ear Open-ear Closed-ear
Closed-ear Closed-ear
0.12
0.12 VDV [ms-1.75]
Vi
bration
intensity
Floor
acceptability
Floor
serviceability
VDV [ms-1.75]
VDV [ms-1.75]
0.16
0.16
0.16 1
1 2
2 3
3 4
4 5
5
[image:10.595.87.490.47.460.2]0 1 2 3 4 5 6 7 8 9 10
Figure 10. Perceptions of floor vibration for the Test I with and
without ear plug as a function ofWb-weighted VDV: (a)
vibra-tion intensity, (b) floor acceptability, and (c) floor serviceability (Mean values over 20 subjects).
used in the study of Howarth and Griffin [35] was around 45 dB (in terms of the A-weighted equivalent noise level,
LAeq), and the levels of sound used in the experiments of
Huang and Griffin [23, 33, 34] were more than 60 dB. The
maximum noise level (LAeq) produced by walking was
less than 40 dB in the present study. It seems reasonable to conclude that perception of vibration induced by hu-man walking was not influenced by the sounds associated with barefoot walking within the range of magnitudes of vibration and levels of sound investigated.
4.5. Prediction of vibration perception using a stan-dard impact source
In the field of building acoustics, human walking has been simulated using an impact source such as a tapping machine or a heavy/soft impact source [30, 36]. It has been suggested that a heavy/soft impact source is a good representative of human walking in terms of mechanical impedance and impact force as well as subjective
similar-(a)
(b)
(c)
0
0
0
0.04
0.04
0.04
0.08
0.08
0.08
0.12
0.12
0.12 Open-ear
Open-ear Open-ear Closed-ear
Closed-ear Closed-ear VDV [ms-1.75]
VDV [ms-1.75]
VDV [ms-1.75]
Vi
bration
intensity
Floor
acceptability
0.16
0.16
0.16 1
1 2
2 3
3 4
4 5
5
[image:10.595.27.292.59.461.2]0 1 2 3 4 5 6 7 8 9 10
Figure 11. Perceptions of floor vibration for the Test II with and
without ear plug as a function ofWb-weighted VDV: (a)
vibra-tion intensity, (b) floor acceptability, and (c) floor serviceability (Mean values over 20 subjects).
ity [37, 38, 39]. A heavy/soft impact source is a hollow rubber ball with a restitution coefficient of 0.8 dropped from a height of 1 m. The standard size of a heavy/soft im-pact source is 178 mm in diameter and its weight is around 2.5 kg. In the present study, floor vibrations were also mea-sured using a heavy/soft impact source dropped from a height of 1 m, conforming to ISO 10140-5:2010 Annex F. The accelerations were measured while the heavy/soft im-pact source was dropped at five positions along the walk-ing line (Figure 2).
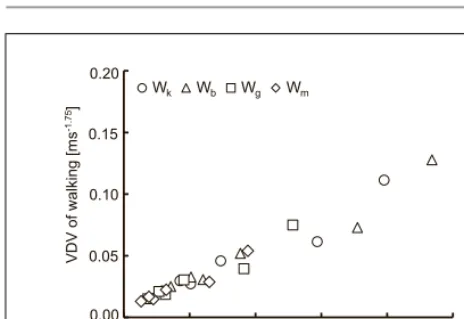
Figure 12 shows the relationships between the measured VDVs induced by human walking for Test I and the VDVs induced by the heavy/soft impact source. The VDV of floor vibrations induced by the heavy/soft impact source were highly correlated with the VDVs induced by human walking, for all frequency weightings. The correlation co-efficients were 0.97 for Wb, Wk, and Wm (p < 0.01),
and 0.96 for Wg (p < 0.01). This implies that the
VDV of impact ball [ms-1.75]
0 0.1
0.00 0.05 0.10 0.15 0.20
0.2 0.3 0.4 0.5
VDV
of
walking
[ms
]
-1.75
[image:11.595.21.253.54.213.2]wkWk wbWb wgWg wmWm
Figure 12. Relationships between accelerations induced by hu-man walking and impact ball in terms of VDV.
obtained using a heavy/soft impact source instead of field measurements with humans walking. However, the VDVs produced by the heavy/soft impact source were about four times greater than those induced by human walking, be-cause the impact force from the heavy/soft impact source dropped from a 1-m height is greater than that from hu-man walking. Previous studies have used different drop-ping heights of a heavy/soft impact source to simulate adult walking and jumping on lightweight floors [16, 40]. A 10-cm drop has been chosen to produce a similar sound pressure level as adult jumping [40], while Kim and Jeon [16] used 0.2 m when considering the impact forces from adult walking. It would also seem appropriate to reduce the dropping height of the heavy/soft impact source with heavy-weight floors.
The VDVs induced by the heavy/soft impact source showed a strong association with the subjective judge-ments obtained in Test I. With the frequency weighting
Wb, the correlation coefficients were more than 0.9 (0.97
for vibration intensity and −0.99 for floor acceptability and serviceability,p < 0.01 for all). This is also consis-tent with the heavy/soft impact source providing a useful prediction of the perceptions induced by humans walking on heavy-weight floors.
A recent study reported that the tapping machine was found to have an acceptable uncertainty of the injected power even at low frequencies [41]. It has also been shown that a modified tapping machine is much closer to human walking than the tapping machine in terms of mechanical impedance and impact sound pressure level [42], and that the force spectrum of the modified tapping machine can be similar to that of the adult walking [37]. The use of the tapping machine and the modified tapping machines may be appropriate in future studies.
4.6. Relationships between dynamic characteristics of the floors and perceptions
In the present study, structural properties (thickness of floors and resilient isolators) and modal parameters (fun-damental frequency and damping ratio) were not signifi-cantly associated with subject perceptions in either Test 1
or Test 2. This result is not consistent with a previous study [11] in which the walking discomfort of floating floors was related to structural components such as thickness and joist spacing. However, that study was a parametric study with variations of panel thickness and spacing of the supporting beams, and the floor structures were simpler than those used in the present study. Insignificant relationships be-tween the modal parameters and vibration perceptions are also inconsistent with floor design criteria since these of-ten rely upon the fundamental frequency. These inconsis-tencies might have arisen because the present study con-ducted a simple driving-point mobility test with a single accelerometer and did not consider the full dynamic be-haviour of the floors such as the mode shapes. It may be valuable to investigate the impact of the dynamic proper-ties on subject perceptions with different resilient isolators (e.g. different thickness and dynamic stiffness) with more precise modal testing.
5. Conclusions
Different levels of floor vibration were produced by hu-mans walking on six different types of floating floors used in the apartments of heavyweight buildings. Subjective ratings of the floor vibration were highly correlated with the magnitude of vibration after weighting using any of four different frequency weighting functions (Wb, Wk,
Wg, or Wm). The vibration dose value, VDV, provided
reliable correlations with the subjective responses to the vibration of the floating floors. Judgements of floor vi-bration induced by barefoot walkers were not influenced by the sound of footsteps. Perceptions of floor vibration were highly correlated with vibration produced using the heavy/soft impact source as defined in ISO 10140-5. Dy-namic properties of the floors were not associated with the subjective ratings.
Acknowledgement
This research was supported by a grant (15RERP-B0 82204-02) from Residential Environment Research Pro-gram funded by Ministry of Land, Infrastructure and Transport of Korean government.
References
[1] J. Woodcock, A. Moorhouse, D. Waddington: A multi-dimensional evaluation of the perception and annoyance caused by railway induced groundborne vibration. Acta
Acustica united with Acustica100(2014) 614–627.
[2] M. J. Griffin: Handbook of human vibration. Academic
Press, London, 1990.
[3] J. Kullaa, A. Talja: Vibration performance tests for light-weight steel-joist floors. Proceedings of the Fourth Inter-national Conference on Steel and Aluminium Structures, Espoo, Finland, 1999, 719–726.
[4] A. Pavic, P. Reynolds: Vibration serviceability of long-span concrete building floors. Part 1: Review of background
in-formation. The Shock and Vibration Digest34(2002) 191–
211.
[5] T. M. Murray: Floor vibration and the electronic office.
[6] B. Ellis: On the response of long-span floors to walking loads generated by individuals and crowds. Structural
En-gineer78(2000) 17–25.
[7] T. Toratti, A. Talja: Classification of human induced floor
vibrations. Building Acoustics13(2006) 211–221.
[8] J. Y. Jeon, J. H. Jeong, M. Vorländer, R. Thaden: Evalua-tion of floor impact sound insulaEvalua-tion in reinforced concrete
buildings. Acta Acustica united with Acustica90(2004)
313–318.
[9] J. Y. Jeon, S. Y. Yoo, P. J. Lee: The effect of damping
mate-rials on heavy-weight floor impact in apartment buildings.
Journal of the Acoustical Society of America120(2006)
3146–3146.
[10] K. W. Kim, G. C. Jeong, K. S. Yang, J. Y. Sohn:
Corre-lation between dynamic stiffness of resilient materials and
heavyweight impact sound reduction level. Building and
Environment44(2009) 1589–1600.
[11] J. H. Kim, J. Y. Jeon: Effects of vibration characteristics on the walking discomfort of floating floors on concrete slabs.
Journal of the Acoustical Society of America136(2014)
1702–1711.
[12] A. Pavic, P. Reynolds: Experimental assessment of
vibra-tion serviceability of existing office floors under
human-induced excitation. Experimental Techniques 23 (1999)
41–45.
[13] M. Setareh: Vibration serviceability of a building floor structure. II: Vibration evaluation and assessment. Journal
of Performance of Constructed Facilities24(2010) 508–
518.
[14] J. Arrieta Crespo: Measurements of vibrations in wooden floors induced by walking. Thesis of Bachelor, Lund Uni-versity, 2009.
[15] P. Johansson: Vibration of hollow core concrete elements induced by walking. Thesis of Master, Lund University, 2009.
[16] J. H. Kim, J. Y. Jeon: Vibration measurements for eval-uating walking discomfort of floating floors in residen-tial buildings. Proceedings Internoise, Innsbruck, Austria, 2013, 5170–5174.
[17] ISO 9052-1: Acoustics - Determination of dynamic stiff
-ness - Part 1: Materials used under floating floors in dwellings. International Standard Organization, Geneva, Switzerland, 1989.
[18] V. Racic, A. Pavic, J. Brownjohn: Experimental identifica-tion and analytical modelling of human walking forces:
lit-erature review. Journal of Sound and Vibration326(2009)
1–49.
[19] Webpage: http://www.sizekorea.kats.go.kr, 2010.
[20] T. M. Murray: Acceptability criterion for occupant-induced
floor vibrations. Engineering Journal18(1981) 62–70.
[21] J. Negreira, A. Trollé, K. Jarnerö, L.-G. Sjökvist, D. Bard: Psycho-vibratory evaluation of timber floors – Towards the determination of design indicators of vibration acceptabil-ity and vibration annoyance. Journal of Sound and
Vibra-tion340(2015) 383–408.
[22] A. Pavic, P. Reynolds: Vibration serviceability of long-span concrete building floors. Part 1: Review of background
in-formation. Shock and Vibration Digest34(2002) 191–211.
[23] Y. Huang, M. J. Griffin: The effects of sound level and
vi-bration magnitude on the relative discomfort of noise and
vibration. Journal of the Acoustical Society of America131
(2012) 4558–4569.
[24] P. J. Lee, M. J. Griffin: Combined effect of noise and vibra-tion produced by high-speed trains on annoyance in
build-ings. Journal of the Acoustical Society of America133
(2013) 2126–2135.
[25] ISO 2631-1: Mechanical vibration and shock: Evaluation of human exposure to whole-body vibration. Part 1: General requirements. International Organization for Standardiza-tion, Geneva, Switzerland, 1997.
[26] BS 6841: Guide to measurement and evaluation of human exposure to whole-body mechanical vibration and repeated shock. British Standards Institution, London, 1987. [27] BS 6472-1: Guide to evaluation of human response to
vibration in buildings (1 Hz to 80 Hz). Part 1: Vibration sources other than blasting. British Standards Institution, London, 2008.
[28] ISO 10137: IBases for design of structures - Serviceability of buildings against vibration. International Organization for Standardization, Geneva, Switzerland, 2007.
[29] ISO 2631-2: Mechanical vibration and shock - Evaluation of human exposure to whole-body vibration - Part 2: Vibra-tion in buildings (1 Hz to 80 Hz). InternaVibra-tional Organiza-tion for StandardizaOrganiza-tion, Geneva, Switzerland, 2003. [30] ISO 10140-3: Acoustics - Laboratory measurement of
sound insulation of building elements - Part 3: Measure-ment of impact sound insulation. International Standard Organization, Geneva, Switzerland, 2010.
[31] M. Morioka, M. J. Griffin: Magnitude-dependence of
equivalent comfort contours for fore-and-aft, lateral and vertical whole-body vibration. Journal of Sound and
Vi-bration298(2006) 755–772.
[32] H. Howarth, M. Griffin: The relative importance of noise
and vibration from railways. Applied Ergonomics 21
(1990) 129–134.
[33] Y. Huang, M. J. Griffin: The relative discomfort of noise
and vibration: effects of stimulus duration. Ergonomics57
(2014) 1244–1255.
[34] Y. Huang, M. J. Griffin: The discomfort produced by noise
and whole-body vertical vibration presented separately and
in combination. Ergonomics57(2014) 1724–1738.
[35] H. Howart, M. Griffin: Subjective response to combined
noise and vibration: summation and interaction effects.
Journal of Sound and Vibration143(1990) 443–454.
[36] C. Hopkins: Revision of international standards on field measurements of airborne, impact and façade sond insu-lation to form the ISO 16283 series. Building and
Environ-ment92(2015) 703–712.
[37] J. Y. Jeon, J. K. Ryu, J. H. Jeong, H. Tachibana: Review of the impact ball in evaluating floor impact sound. Acta
Acustica united with Acustica92(2006) 777–786.
[38] J. Y. Jeon, P. J. Lee, S. Sato: Use of the standard rubber ball as an impact source with heavyweight concrete floors.
Journal of the Acoustical Society of America126(2009)
167–178.
[39] S. Schoenwald, B. Zeitler, T. R. Nightingale: Prediction of the blocked force at impact of Japanese rubber ball source.
Acta Acustica united with Acustica97(2011) 590–598.
[40] J. Ryu, H. Sato, K. Kurakata, A. Hiramitsu, M. Tanaka, T. Hirota: Relation between annoyance and single-number quantities for rating heavy-weight floor impact sound insu-lation in wooden houses. Journal of the Acoustical Society
of America129(2011) 3047–3055.
[41] V. Wittstock: On the spectral shape of the sound generated by standard tapping machines. Acta Acustica united with
Acustica98(2012) 301–308.
[42] W. Scholl: Impact sound insulation: The standard tapping
machine shall learn to walk! Building Acoustics8(2001)
![Table I. Floor structures used in the study. d: Total thickness [mm], s�: Dynamic stiffness [MN/m3].](https://thumb-us.123doks.com/thumbv2/123dok_us/8040746.221170/2.595.20.252.192.492/table-floor-structures-study-total-thickness-dynamic-stiness.webp)