HIGH DEFINITION VIDEO CAMERAS FOR MEASURING
MOVEMENT OF VIBRATING BRIDGE STRUCTURE
Albert K. Chong1, Jasim Ahmad Ali Al-Baghdadi2, Duaa Alshadli1
1Faculty of Civil Engineering and Surveying
University of southern Queensland, Australia E-mail: [email protected]
2Technical College – Baghdad, IRAQ
E-mail: [email protected]
Keywords: engineering, measurement, structure, videogrammmetry, vibration.
ABSTRACT
This paper presents the techniques and results of an innovative non-contact technique using low-cost high-definition video cameras and videogrammetric image processing techniques for measuring movement of vibrating object in daylight or night-time. Structural vibration can cause damage to engineering structure and reduces the lifespan of the structure, particularly highway bridges. The objective of the investigation was to determine the measurement quality of these video cameras for capturing the movement of structures during vibration such as the vibration caused by a trunk loading on a bridge. Indoor simulated object vibration was carried out to determine the suitable vibration levels for monitoring. An outdoor engineering bridge structure was also included in the investigation. High definition video cameras were utilised in the trials. The research findings show that these video cameras are suitable for low-accuracy close-up continuous monitoring of objects in low vibration level or at low frequency rate. The ground vibration around the camera setup site has minimal effect on the accuracy of the measurement. The current prototype developed has an achievable measurement accuracy of approximately ±0.17 mm in a three-dimensional reference frame.
1. INTRODUCTION
Engineering structural movement monitoring using high-accuracy, purpose-built high quality videogrammetric cameras began around the early 1990s [1]. The authors reported sub-millimetre measurement accuracy results in a military steel bridge movement study. Recently, a number of authors investigated the use of similar photogrammetric techniques on engineering structures such as a steel girder bridge [2]; a concrete beam [3]; and a concrete reservoir wall [4]. All the authors reported sub-millimetre to two millimetre accuracy in their investigations. In [5] argued that multiple accelerometers were often used to study the shape-variant aircraft wing during vibration testing. However, the advances in optical vision metrology systems allowed these systems to be utilised in this type of application. The authors initiated an investigation to determine the suitability of this technology to model the dynamic modes of a vibrating aircraft wing structure. They found that this non-intrusive method of determining the dynamics responses from structures where the excitation was controlled may be advantageous in a number of applications. The authors in [6] discussed an approach of using a single video camera to capture the vibration of the stay cables of Jing Jiang Bridge in Fujian province, China. Black solid circle targets were attached to the selected cable, accelerometers were installed on the cables and video clips were captured. Video frames were selected from the clips, target digitised and measurements along the video frame y-axis were obtained. They found good agreement in the measurement between the two techniques. However, the authors argued that the technique developed could be improved by using multi-video cameras, advanced multi-video-camera lens calibration technique and advanced videogrammetric software. Authors of [7] applied stereo-videogrammetric techniques to capture the vibration parameters of a model bridge in a wind tunnel test. Four laser LVDTs were used to confirm the magnitude of the introduced vibration. The innovative stereo-videogrammetric system was found to be reliable for the application. In [8], authors applied a stereo-pair of high speed cameras and digital stereo-image correlation (DIC) technique to map the three-dimensional surface of an object which was subjected to mechanical shaking. Also, a current technique based on scanning laser doppler vibrometers (LDVs) was used to determine the surface in a similar simulation. In the comparison, the authors argued that results shows high correlation between the two methods. In addition, the author highlighted the benefits of DIC:
1. Data captured are related to the entire visible surface rather than pre-defined points only.
2. The DIC camera movement during the image capture does not affect the measurement accuracy, while the LDVs system is highly sensitive to change (movement) in the setup.
3. The DIC captured data has higher spatial resolution.
In this investigation, an innovative four low-cost video cameras and high precision multi-image videogrammetric processing were used to improve the quality of vibration measurement. Also, high-precision camera lens calibration techniques were applied to reduce lens distortion errors. Lab simulations examined the quality of the measurement of the low intensity vibrations that involved truck loading. Subsequently, a highway concrete bridge was selected for low intensity vibration detection study.
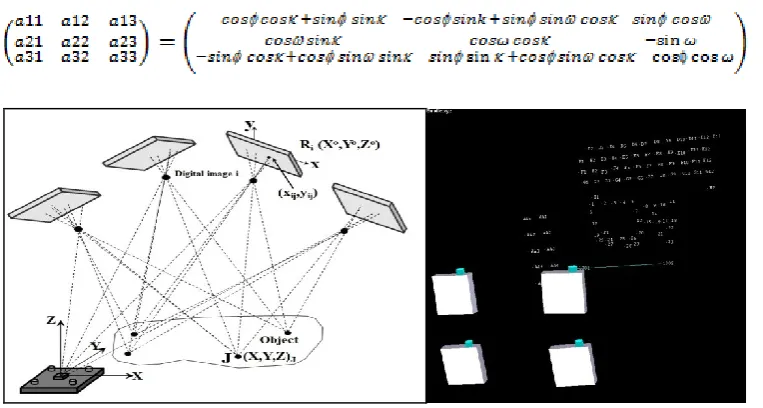
2. VIDEOGRAMMETRIC ALGORITHMS
rotation angles , , around the object-space X, Y and Z coordinate axes, and the object-space coordinates of the point (XP,YP, ZP). These equations are given as follows [9]:
+ (1)
+ (2)
Where f = principal distance of camera lens, and , are camera lens distortion corrections (see equations 4 and 5), and a11 to a33 are given by the following rotation matrix
relationship.
3)
Figure 1: (left) multi-video camera bundle network adjustment. (right) A four-video-camera lab testing.
The following equations are used in the video camera calibration of this research [9]:
4)
(5)
where
: axis-related correction values for imaging errors, : small corrections for camera lens centre (x0, and y0),
: small correction for principal distance of the lens, , , : lens distortion parameters,
, : lens decentring parameters, , : affinity and shear parameters, and
: radial distance from the principal point to the image point.
The above equations are linearized and the unknown parameters such as each camera lens centre coordinates (XL,YL,ZL), each camera orientation (,,), each lens distortion (K1,K2,K3),
each lens decentring (P1,P2) and each lens affinity and shear parameters (C1,C2) are
[image:3.595.110.492.215.419.2]point of interest are determined to fit the collinearity models. An invar scale bar is always used to provide precise object-space scaling and an orientation device is used to establish the object-space coordinate exes (Figure 1).
3. DATA ACQUISITION SYSTEMS AND SOFTWARE
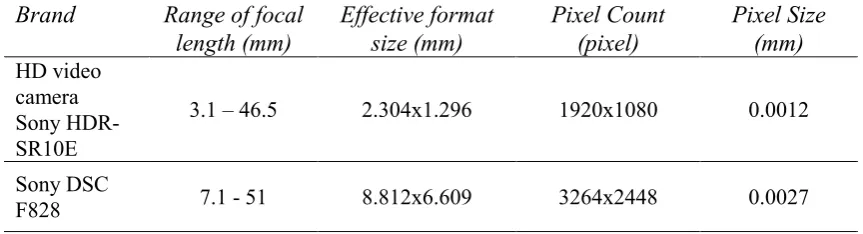
The main equipment for the investigation included compact digital cameras (Sony cyber-shot DSC-F828), high definition NIR cameras (Sony HDR-SR-10E) and near-infrared illuminators (Sony HVL-IRM). The video cameras provided the continuous structural vibration monitoring investigation whereas the compact cameras were utilised to evaluate the measurement quality of the video cameras measurements. These cameras were suitable for the capture of colour and NIR video clips. The cameras’ sensor specifications are provided in Table 1. In general, NIR illuminators were required in all night-time (low-light or in darkness) tests.
Three pieces of software were used for the processing. They were:
a) VirtualDub: video frame-grabbing and field de-interlacing software, Internet freeware.
b) PhotoModeler: videogrammetric 3D surface modelling, Eos Systems Inc. Canada c) Australis: Camera geometric calibration software, Photometrix, VIC Australia. VirtualDub was used to extract video frames from the captured video clips. Australis was utilised to calibrate the cameras and process the video frames and images using multiple camera bundle adjustment techniques. Photomodeler was exploited to provide the cameras’ sensor chip pixel size during camera calibration and generate 3D surface model of the studied objects.
4. METHODS
Precision video camera calibration, laboratory vibration simulation and a highway bridge structural vibration monitoring are discussed in this section. In the laboratory simulation a frequency generator was used as the gold standard. In the bridge structural vibration monitoring a pre-stressed concrete bridge was subjected to loading by a loaded moving truck.
4.1 Video cameras lens distortion calibration
[image:4.595.82.514.624.741.2]The Sony SR10E video cameras (Table 1) were calibrated at a university photogrammetric laboratory using videogrammetric collinearity model techniques as discussed in [6],[5]. However, the video cameras were calibrated separately in their normal colour and NIR video recording modes. The NIR video recording mode was switched on by means of night-shot buttons on both the compact cameras and the video cameras. Photomodeler DSM software and Australis bundle adjustment software were used in the determination of the intrinsic video cameras’ sensor chip pixel size and lens parameter values.
Table 1. Project camera specifications.
Brand Range of focal
length (mm) Effective format size (mm) Pixel Count (pixel) Pixel Size (mm) HD video camera Sony HDR-SR10E
3.1 – 46.5 2.304x1.296 1920x1080 0.0012
Sony DSC
4.2 Video camera synchronisation
Synchronisation of the camera is critical if accurate movement measurement needs to be determined. The technique applied in this investigation is based on [10] and [11] approach which exploits a light flash near the object. The light flash can be delivered by a small laser pointer or by turning on a LED that is placed near the object. The camcorders video clips are synchronised by tracking the video frame which records the particular light flash. Preliminary tests showed that a light flash delivered by a conventional flash light was equally suitable for normal video recording speed. This technique is the easiest and most uncomplicated method in camcorder video clip synchronisation indoors or outdoors. In this research, the developed LED synchronization device produced a red colour flash lasting four (4) video frames or approximately 0·133 second (Figure 2).
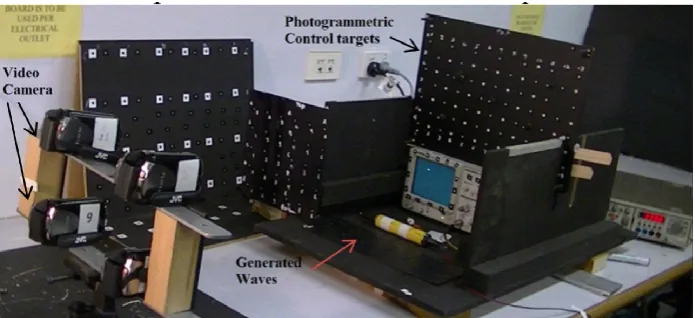
4.3 Laboratory simulation
The laboratory simulation determines the quality of the measurement based on the vibration level. A frequency generator was used as the gold standard. The internal oscillator of a frequency counter provides accurate time signals and the device is used to calibrate the signal output of the signal generator. A set of frequency settings was selected and the values were: 0.1, 1, 5, 10, 15 and 20 Hz. The range was based on the truck loading vibration profile reported in [12]. The trial examined low-frequency range (1- 5Hz) and low intensity vibration at around (10 - 20Hz). The signal is manipulated to obtain a sine wave of a suitable amplitude and scale. The video cameras captured the simulations as required.
Figure 3. (a) The simulated laboratory test, the video cameras and the retro-reflective target panel. (b) The camera configuration.
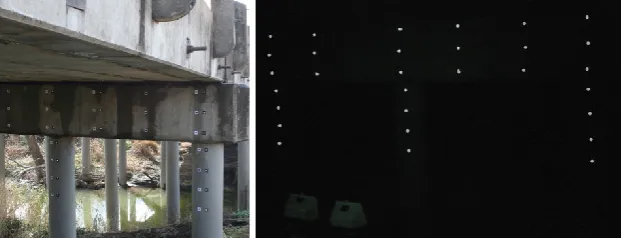
4.4 Highway bridge structural vibration
[image:5.595.125.473.355.514.2]Figure 4. (a). The highway concrete pile bridge vibration testing. (b) The retro-reflective target layout.
4.5 Photogrammetric target placement at the bridge piles
Similar to that of the laboratory simulation study, retro-reflective targets were used in the bridge vibration investigation. In this investigation, the vertical movement was considered the most important. It was decided that the pier headstock would contain three rows of targets and that the piers would contain four rows of targets. Horizontally (left-to-right) and based on the dimensions of the structure, it was decided that there would be 21 columns of targets, making a total number of 106 targets for each type of target material (Figure 4b).
4.6 Ground control acquisition for structural movement validation
In order to establish control data (coordinates) for the vibration movement a survey traverse was undertaken at the bridge site. The survey was carried out using a Leica high-precision total-station. Datum was established between stable permanent two survey marks. The targets on the bridge piles were surveyed when traffic on the bridge was light. The accuracy of the survey was in the order of ±1.0 mm in the x, y and z axes.
4.7 Image capture at the bridge
The video cameras were setup in a configuration similar to the lab simulation (Figure 3b). Given the width of the structure and the limited ground coverage of the video cameras, it was determined that only the right set of piles were to be observed (Figure 4b). Both day-light and night-time video clips were captured when trucks pass over the bridge. Figure 5a shows the day-light video frame while Figure 5b shows the near infrared video frame in darkness.
Figure 5. (a) Colour video frame taken in day-light. (b) Near infrared video frame taken at night showing the retro-reflective targets only.
4.8 Multi-video frame processing
[image:6.595.108.491.42.168.2] [image:6.595.144.458.552.671.2]corresponding video frames for the four cameras the synchronising laser flash was checked for each video clip. Once, the frame having the laser flash was found subsequent frames were synchronised. Next, each set of synchronised video frames were batch processed using Australis photogrammetric software. Also, the processing involved the removal of the camera lens distortion and sensor chip errors (Eqs. 4 and 5). The calculated target coordinates were compared with the survey captured data to determine the movement along the vertical and horizontal components.
5. RESULTS AND ANALYSES
5.1 Laboratory simulation test results
[image:7.595.98.502.350.714.2]The calculated measurement of the simulated wave at 0.1 Hz was used as the gold standard. The measured amplitude at 0.1 Hz was 69.98 mm. The calculated measurements of the vibration level setting were compared to this gold standard. Extensive tests show that the measurements accuracy obtained by the multi-camera videogrammetric techniques has a standard deviation of ±0.17 mm. Table 3 presents the results whereas Figure 6 depicts the trend line of the trial. It is apparent that the photogrammetric measurement is always positive and as the vibration level increases beyond 12 Hz the measurement accuracy degrades significantly.
Table 3. Vibration level vs. amplitude measurement accuracy.
Vibration level (Hz)
Measurement accuracy (mm)
1 0.04±0.17
5 0.37±0.17
10 0.62±0.17
15 1.02±0.17
20 0.83±0.17
5.2 The bridge structural vibration results
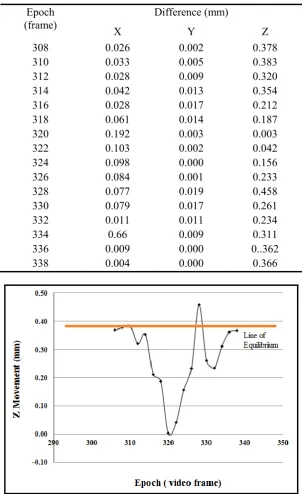
[image:8.595.146.450.241.736.2]The surveyed target coordinates were used as the bench mark because it is the most accurate technique for capturing the vertical (Z) and horizontal components (X, Y) of targets placed on large outdoor engineering projects where precise control coordinate such as the vertical component must be brought in from stable control datum outside the vibration zone. To determine the vertical displacement caused by the vibration of the structure a comparison was made between the survey data and the videogrammetric data. The mean of the vertical and horizontal components mean are provided in Table 4. The graphic plot of the Z-component is provide in Figure 7. As the precision of the outdoor measurement is similar to the laboratory testing of ±0.17 mm the photogrammetric system is reliable. Figure 7 shows a typical trend of loading where the line of equilibrium is crossed more in the negative than the positive position.
Table 4.Difference between survey data and videogrammetric data. Epoch
(frame)
Difference (mm)
X Y Z
308 0.026 0.002 0.378
310 0.033 0.005 0.383
312 0.028 0.009 0.320
314 0.042 0.013 0.354
316 0.028 0.017 0.212
318 0.061 0.014 0.187
320 0.192 0.003 0.003
322 0.103 0.002 0.042
324 0.098 0.000 0.156
326 0.084 0.001 0.233
328 0.077 0.019 0.458
330 0.079 0.017 0.261
332 0.011 0.011 0.234
334 0.66 0.009 0.311
336 0.009 0.000 0..362
[image:8.595.147.452.245.730.2]338 0.004 0.000 0.366
7. CONCLUSIONS
The research set out to determine whether a prototype utilising low-cost high-definition video cameras could be used for engineering structure vibration study. The selected cameras can operate in colour mode in daylight and in near-infrared mode in darkness. Two sets of trials were carried out: (1) the prototype measurement accuracy test in the laboratory; and (2) truck loading of a 42 year old concrete state highway bridge. In the lab simulation, the measurement accuracy reduced down to an uncertainty of 0.5 mm at vibration level of 10 Hz and 1.0mm at 15 Hz. In the field, the prototype achieved higher measurement accuracy than the common surveying techniques. The measurement accuracy is similar for daylight and night-time observations.
The prototype is suitable for many applications, such as railway noise vibration study, structural health monitoring and vehicle dynamic. It can be used as a low-cost system for the monitoring of older bridges where daylight and nigh-time warming is required for safety reasons.
ACKNOWLEDGEMENT
The authors thank Mr Paul Lenton, a surveyor of the Queensland Transport and Main Roads for the survey and placement of the photogrammetric targets.
REFERENCES
[1] Cooper, M.A.R., and Robson, S., High precision photogrammetric monitoring of the deformation of a steel bridge, The Photogrammetric Record, 13(76) (1990): 505–510. [2] Jiang, R. and Jáuregui, D.V., Development of a digital close-range photogrammetric
bridge deflection measurement system, Measurement, 43(10) (2010): 1431-1438.
[3] Rönnholm, P., Nuikka, M., Suominen, A., Salo, P., Hyyppä, H., Pöntinen, P., Haggrén, H., Vermeer, M., Puttonen, J., Hirsi, H, Kukko, A., Kaartinen, H., Hyyppä, J. & Jaakkola, A., Comparison of measurement techniques and static theory applied to concrete beam deformation. The Photogrammetric Record, 24(128) (2009): 351-71.
[4] Maas, H.G. and Hampel, U., Photogrammetric techniques in civil engineering material testing and structure monitoring. The Photogrammetric Engineering and Remote Sensing, 7(21) (2006): 29-45.
[5] Rayall T.G., Fraser, C.S., Determination of Structural modes of vibration using digital photogrammetry. AIAA Journal of Aircraft. 2002, 39(1):114-119.
[6] Zhou, X., a, XIA, T., Wei, Z, Wu, Q., A videogrammetric technique for measuring the vibration displacement of stay cables, Geo-spatial Information Science, 2012, 15(2), 135-141.
[7] Chang C.C. and Y. F. Ji, Y.F, Flexible Videogrammetric Technique for Three-Dimensional Structural Vibration Measurement. Journal of Engineering Mechanics, 2007, 133 (6):656-664.
[8] Helfrick, M.N., Niezrecki, C., Avitabile, P., Schmidt, T, 3D digital image correlation methods for full-field vibration measurement. Mechanical Systems and Signal Processing, 2011, 25: 917–927
[9] Luhmann, T., Robson, S., Kyle, S., and Harley, I., Close range photogrammetry: principles, techniques and applications. Whittles Publishing, Caithness, UK, 2006, 510 pages.
[10] Chong, A. K.. Low-cost compact camera for CMT disorder application, The Photogrammetric Record, 26(134) (2011): 263-273.