SHORT REPORT
Performance of variable selection
methods using stability-based selection
Danny Lu
1, Aalim Weljie
2, Alexander R. de Leon
3*, Yarrow McConnell
4, Oliver F. Bathe
5,6and Karen Kopciuk
2,5,7*Abstract
Background: Variable selection is frequently carried out during the analysis of many types of high-dimensional data, including those in metabolomics. This study compared the predictive performance of four variable selection methods using stability-based selection, a new secondary selection method that is implemented in the R package BioMark. Two of these methods were evaluated using the more well-known false discovery rate (FDR) as well.
Results: Simulation studies varied factors relevant to biological data studies, with results based on the median values of 200 partial area under the receiver operating characteristic curve. There was no single top performing method across all factor settings, but the student t test based on stability selection or with FDR adjustment and the variable importance in projection (VIP) scores from partial least squares regression models obtained using a stability-based approach tended to perform well in most settings. Similar results were found with a real spiked-in metabolomics dataset. Group sample size, group effect size, number of significant variables and correlation structure were the most important factors whereas the percentage of significant variables was the least important.
Conclusions: Researchers can improve prediction scores for their study data by choosing VIP scores based on stabil-ity variable selection over the other approaches when the number of variables is small to modest and by increas-ing the number of samples even moderately. When the number of variables is high and there is block correlation amongst the significant variables (i.e., true biomarkers), the FDR-adjusted student t test performed best. The R pack-age BioMark is an easy-to-use open-source program for variable selection that had excellent performance characteris-tics for the purposes of this study.
Keywords: Stability-based variable selection, False discovery rate (FDR), High-dimensional biological data, Partial area under the receiver-operating characteristic curve (pAUC), Variable importance in projection (VIP)
© The Author(s) 2017. This article is distributed under the terms of the Creative Commons Attribution 4.0 International License (http://creativecommons.org/licenses/by/4.0/), which permits unrestricted use, distribution, and reproduction in any medium, provided you give appropriate credit to the original author(s) and the source, provide a link to the Creative Commons license, and indicate if changes were made. The Creative Commons Public Domain Dedication waiver (http://creativecommons.org/ publicdomain/zero/1.0/) applies to the data made available in this article, unless otherwise stated.
Background
Variable selection is an important first step in the anal-ysis of diverse chemical data, where often the goal is to identify a subset of measured variables that can distin-guish between two or more different groups. Including all measured variables is impossible in practice and leads to reduced precision of model estimates and over-fitting in most analytical methods [1]. Many variable selec-tion methods have been developed for high- and ultra
high-dimensional data settings and for a variety of mod-elling approaches and data types [2–4].
The R package Biomark [5, 6] includes these popu-lar variable selection methods: student t test, Variable Importance in Projection (VIP) scores [7, 8] from Partial Least Squares Regression (PLS-DA) models, Least Abso-lute Shrinkage and Selection Operator (LASSO) [9], and Elastic Net [10, 11]. Each method has different strengths and weaknesses for identifying significant variables often found in biological data like in metabolomics, and pos-sibly, for modelling them. Models for such data should be able to handle multi-collinearity in the measured vari-ables, small n-large p cases (i.e., more variables than sam-ples), sparsity (i.e., few significant variables), and multiple
Open Access
*Correspondence: [email protected]; [email protected]; [email protected]
3 Department of Mathematics and Statistics, University of Calgary, 2500
University Drive NW, Calgary, AB T2N 1N4, Canada
7 Cancer Epidemiology and Prevention Research, Alberta Health Services,
2210 – 2 Street SW, Calgary, AB T2S 3C3, Canada
variables in a regression context, and should have ease of interpretation.
Resampling approaches used for prediction with vari-able selection methods tend to perform poorly when the numbers of samples within groups are small. Stability-based selection is a new general approach that can be used with several different analytical methods, from stu-dent t tests to various regression techniques [12, 13]. It is similar to multiple-testing methods like the FDR [14] and q-values [15, 16], as these approaches all employ secondary selection based on an initial evaluation of the variables. Stability-based selection operates by repeat-edly taking subsets of variables and samples from the full data set, and then estimates and ranks the coefficients, scores or P values as generated by the chosen analytical method in each perturbed dataset. If the fraction of the time a variable is included in a fixed number of top vari-ables in the perturbed datasets is high, it is deemed to be stable and, therefore, a potential significant variable (i.e., a biomarker). Those variables appearing by chance in a few perturbations will not be a consistent indicator of class differences when the results are averaged, so are not selected. Thus, stability-based selection, like the jackknife [17] approach, perturbs the data to identify those vari-ables that are consistently selected as group difference indicators [5, 12, 13] to improve prediction.
Performance of the variable selection methods using their selected significant variables can be evaluated using Receiver Operating Characteristic (ROC) curves when the real significant variables (i.e., true biomarkers) are known, such as with simulated and spiked-in data. ROC curves are generated by starting with the first selected biomarker then sequentially including the remain-ing ones and plottremain-ing the proportion of false positives (x-axis) against the proportion of true positives (y-axis) at each step. The Area Under the ROC curves (AUC) sum-marizes the performance of the selected set of signifi-cant variables by a variable selection method on a scale between zero and one; that is, the AUC measures how well a random pair of samples, one from each group, is correctly classified. The higher the AUC, the better the biomarker classification method performs. Instead of cal-culating the AUC for the whole curve, often the partial AUC (pAUC) is calculated [18–20] since most of the true significant variables are usually selected first without too many false ones. Restricting the calculation of the AUC to a smaller range of values of the false positive rate (i.e., higher specificity) is appropriate for diagnostic and other medical tests based on biomarkers for use in a clinical situation [21] and is the metric adopted here.
The objective of this study was to evaluate the perfor-mance of four popular variable selection methods using the robust stability-based selection criterion and two
of these methods (VIP and student t test) with an FDR adjustment to identify significant variables. Our evalu-ation metric for each method was the pAUC, which assesses predictive performance using model-based sim-ulated biological data for each of the variable selection methods.
Methods
Simulation study design
To evaluate the variable selection methods, we used model-based simulated data that mimicked biological data that have undergone pre-processing and pre-treat-ment steps in a metabolomics analysis pipeline [22]. By varying several biological and experimental factors likely to impact variable selection, we could systematically eval-uate their effects across the methods we considered, since we knew the identity of the true significant variables.
Metabolomics data are typically right skewed and their range can vary substantially between individual metabolites. Logarithmic or other transformations are used along with centering and scaling the data to unit variance before analysis [22]. The simulated datasets were generated assuming these pre-analytical steps have been followed, resulting in standard multivariate normal dis-tributions, which is the joint distribution of correlated univariate normal variables with zero means and unit variances (i.e., scaled data). The parameters that were varied included the combined study sample size N = 50, 100; the number P = 50, 200, 1000 of measured variables; the percentage Q = 10, 15, 20% of significant variables; the effect size (or mean abundance or signal) Δ = 0.2, 0.4, 0.8 in the treatment (or disease) group; and the correla-tion structure. Similar to Wehrens et al. [13], the follow-ing correlation structures were adopted: (1) independent (i.e., pair-wise and higher order correlations were zero), (2) block correlation (i.e., correlation between significant variables was 0.7, between non-significant variables was 0.1, and between blocks was zero), and (3) autoregressive of order 1 [AR(1), with correlation rhoabs(i−j) between
var-iables i and j, for rho = 0.5].
per group (oob.size) were used. A default top fraction ntop = 10 and a stringent consistency threshold level min. present = 0.5 (i.e., 50%) [13] were used so that a selected variable had to be in the top 10 variables in at least half of the 200 resampled datasets. In every set-ting, two groups of equal sample sizes were used to compare the ability of the four stability-based and two FDR-adjusted selection methods to correctly identify the significant variables associated with the treatment group. The pAUC was set at 0.2, which corresponds to a false positive fraction of 0.2 or equivalently, a specific-ity of 80%. The R code used to generate these data and the results can be found here: https://people.ucalgary. ca/~kakopciu/Simulated Metabolomics Biomarkers R Code.docx.
Spiked‑in metabolomics dataset
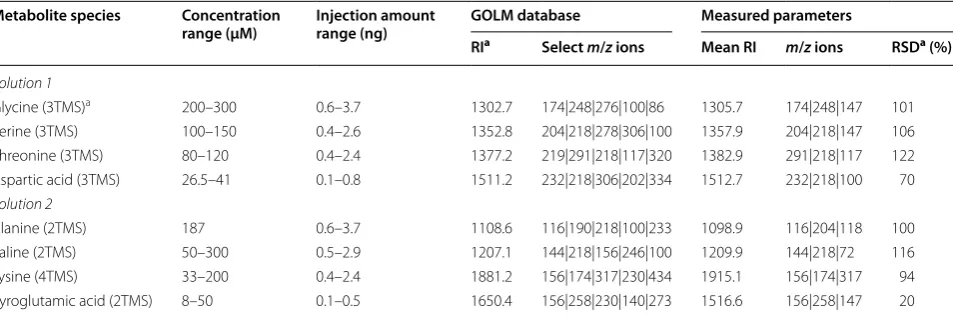
The spiked-in dataset was from a study that developed a standardized approach to untargeted metabolomics biomarker discovery [23]. Standardized human serum samples from the National Institute for Standards and Technology (NIST) were spiked at physiologic concentra-tions (50-300 um) with two sets of distinct metabolites. Maximum spiked concentration was calculated at double the target concentration, with dilution sets of samples of 0.33 to twofold concentration differences prepared. Sample extraction and derivatization followed our stand-ard laboratory protocols and each sample underwent gas chromatography-mass spectrometry (GC–MS) on a Waters Technology machine. All samples were randomly ordered and run on the same day. A total of 18 repli-cates from each of the two solution sets were compared to each other. Spiked-in metabolites from Solution 1 included glycine (Gly), serine (Ser), threonine (Thr), and aspartic acid (Asp) while those from Solution 2 included
alanine (Ala), valine (Val), lysine (Lys), and pyroglutamic acid (Pyr). Table 1 provides details on the concentration ranges. Fifty-two other metabolites were included as all samples could be measured, i.e., were above the detec-tion limits. Addidetec-tional details on our experimental pro-tocol and the dataset used in this study are available here: https://people.ucalgary.ca/~kakopciu/Steps in design-ing and prepardesign-ing the spiked-in Data set.pdf and https:// people.ucalgary.ca/~kakopciu/Spiked-in Data Set BMC Notes paper.csv, respectively.
Findings
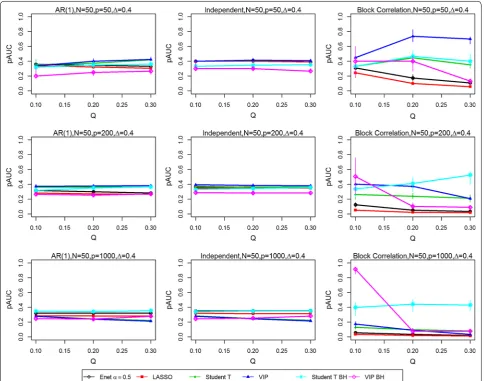
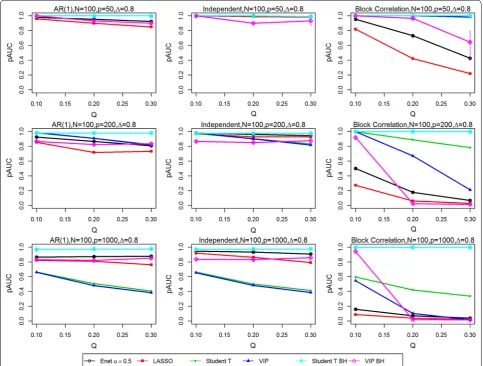
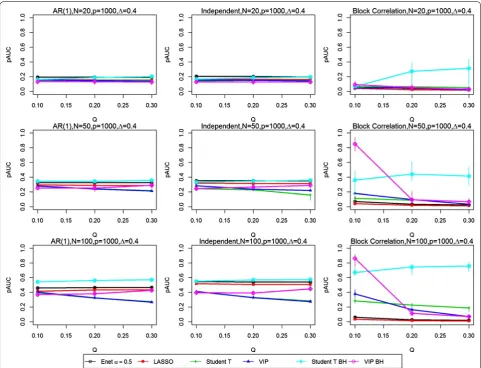
Figures 1, 2, 3 and 4 present the simulation study results for the six variable selection methods for various com-bined sample size N, proportion of true significant variables Q, number of variables P, effect size Δ from treatment group, and correlation structure [i.e., AR(1), independent and block-correlation]. Point estimates rep-resent the median values of pAUC for the 200 simulated datasets for each parameter configuration. Bootstrap sampling was carried out to estimate the 95% confidence intervals (CIs) for the medians of the 200 replicates using algorithm Basic in the R package boot [6]. The widths of the estimated CIs were quite narrow, with an inter-quartile range of 0.0408, suggesting that the estimated medians did not vary substantially. They are available in tabular form in the Supplementary Materials (https:// people.ucalgary.ca/~kakopciu/BootstrapCIs for Simula-tion Study BMC.xlsx).
In the independent correlation setting (centre panels in all figures), all selection methods provided nearly iden-tical results, except when the number of variables and the effect size was high (P = 1000, Δ = 0.8). The study parameters with the greatest effect on the pAUC val-ues were the combined sample size N (Figs. 1 vs. 2, 3 vs.
Table 1 Reference and measured identification parameters for spiked metabolites, with range of serum concentrations and injected amounts over the dilutional series
aRI Retention index, RSD relative standard deviation, TMS trimethylsilyl groups
Metabolite species Concentration
range (μM) Injection amount range (ng) GOLM database Measured parameters
RIa Select m/z ions Mean RI m/z ions RSDa (%)
Solution 1
Glycine (3TMS)a 200–300 0.6–3.7 1302.7 174|248|276|100|86 1305.7 174|248|147 101
Serine (3TMS) 100–150 0.4–2.6 1352.8 204|218|278|306|100 1357.9 204|218|147 106 Threonine (3TMS) 80–120 0.4–2.4 1377.2 219|291|218|117|320 1382.9 291|218|117 122 Aspartic acid (3TMS) 26.5–41 0.1–0.8 1511.2 232|218|306|202|334 1512.7 232|218|100 70
Solution 2
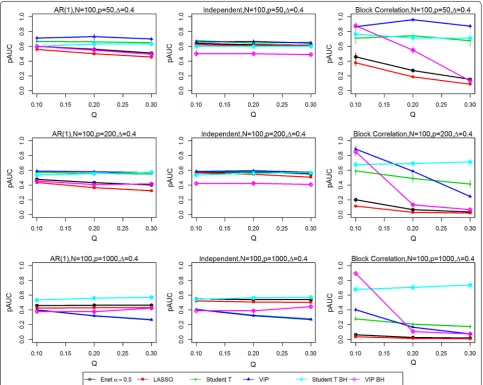
[image:3.595.61.538.555.713.2]4) and the effect size Δ (Figs. 1 vs. 3, 2 vs. 4). Doubling the combined sample size from 50 (i.e., 25 per group) to 100 (i.e., 50 per group) increased the pAUC values by at least 0.15 when Δ was 0.4 or 0.8, but had no effect at 0.2 (results not shown). Doubling the effect size (Figs. 1 vs. 3, 2 vs. 4) from 0.4 to 0.8 increased the pAUC values by at least 0.2. pAUC values increased the most when both N and the Δ were increased for all combinations of P and Q compared to when Δ was 0.2 (not all results shown). In the setting with P = 1000 variables and a large effect size (Δ = 0.8), the FDR-adjusted student t test and the Elastic Net had pAUCs values that were from 0.15 to 0.4 higher than those for the other four methods.
In the AR(1) correlation setting (left panel in all fig-ures), all selection methods provided results that were
quite similar to those for the Independent Correlation setting; however, the Elastic Net and LASSO methods had slightly lower pAUC values than in the Independent Correlation setting. For number of variables P = 50 or 200, the FDR-adjusted student t test or the student t test and VIP obtained using the stability-based approach had pAUC values that were generally higher by at least 0.1 than those for the other methods. As in the Independent Correlation setting, when either the number of variables or effect size was high, the FDR-adjusted student t test and the Elastic Net had the highest pAUCs values.
[image:4.595.57.542.88.469.2]pAUC values for any P, any Q (i.e., percentage of signifi-cant variables), and for any N, and for modest or high Δ. The VIP scores based on an FDR adjustment had higher pAUC values when Q was 0.1, but performed poorly as it increased to 0.2 and 0.3. As Δ was increased, the pAUC values for both unadjusted and FDR-adjusted student t tests and the stability-based VIP scores increased sub-stantially: twofold to fourfold when Δ was doubled from 0.2 to 0.4 (results not shown), and from 0.4 to 0.8 when N was 50, but generally only when Q was low (0.1) to modest (0.2). When N was 100, a two-fold increase was observed when Δ was doubled from 0.2 to 0.4 (results not shown), with less dramatic but still substantial increases (0.15 to 0.45) when it was doubled from 0.4 to 0.8. The only scenario where the VIP scores tended to perform
worse in the block correlation setting was when Q was high (0.3) and P was at least 200. Both unadjusted and FDR-adjusted student t tests were less affected with increasing P and high Q, especially at the greatest effect size (Δ = 0.8). However, when P was high (1000) and Q was greater than 0.1, the FDR-adjusted student t test out-performed all other methods.
[image:5.595.57.541.88.473.2]contrast, when the FDR-adjusted P values from the VIP and student t test were estimated, noticeably lower pAUC values were obtained than for their corresponding meth-ods adopting the stability-based approach. The pAUC from the FDR-adjusted VIP method was 0 versus 0.875 with resampling, and was 0.75 for the FDR-adjusted student t test versus 0.875 with resampling. The FDR-adjusted student t test selected only six of the eight bio-markers but fewer non-biobio-markers, resulting in higher specificity. None of the methods selected Pyroglutamic acid from Solution 2, and most included 1–10 additional metabolites that were not spiked-in. The modest num-ber of replicates can make identification of the spiked-in metabolites more difficult, and may have led to these low pAUC values [24].
Conclusions
[image:6.595.58.540.89.466.2]now when the number of measured variables (P = 200, 1000) was higher and when the percentage of significant variables was very low (Q = 10%). In addition, variable
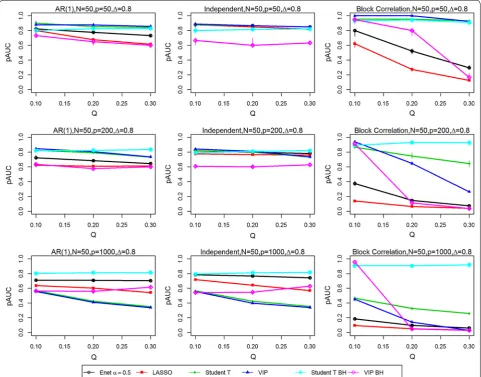
selection based on the student t test has been previously shown to perform well in high-dimensional data set-tings when variables are strongly associated with class Fig. 4 Partial Area Under the ROC curves (pAUCs) as the proportion of significant variables is increased from 0.1 to 0.3. Results are presented for all three correlation structures [independent, AR(1) and block correlation] for the six selection methods [four stability-based methods: Elastic Net (Enet), LASSO, student t test, VIP, and two FDR-adjusted methods: student t test BH and VIP BH]. The total number N of samples is 100 and the effect size Δ is 0.8. The total number P of variables is 50 (Top row), 200 (Middle row) and 1000 (Bottom row)
Table 2 Comparison of results between stability-based and FDR-adjusted methods for the spiked-in data set for four selection methods (true biomarkers in italics font)
apAUC Partial area under the receiver operating characteristic curve (0.2)
Method Test statistic Biomarkers selected pAUCa, sensitivity 1‑Specificity
Stability (0.5) VIP Gly Ser Thr Ala Val Lys 20 36 24 13 42 23 41 44 57 19 Asp 0.875 0.169 Student t test Gly Ser Thr Ala Val Lys 20 36 13 23 42 41 Asp 44 57 24 48 0.875 0.169 Lasso Gly Ala Val 20 23 Thr 21 0.5 0.034 Elastic net Gly Ala Val 23 20 Thr 0.5 0.051 FDR Student t test P values <0.05 Gly Ser Thr Ala Val Lys 25 0.75 0.034
[image:7.595.57.541.89.455.2] [image:7.595.58.539.564.659.2]label [28]; this was also confirmed in this study when the effect sizes were large (Δ = 0.8) and the number of variables is larger than the sample size (≥100). Chong and Jun [8] also found that selection based on VIP scores performed better than LASSO using similar experimen-tal factors but different performance metrics. The Elastic Net was expected to outperform LASSO when variables are highly correlated [11], which was the case in the sim-ulated data with AR(1) and block correlation, and in the independent correlation setting only when the effect size and number of variables were both large.
Not surprisingly, our finding that increasing the sam-ple size improves prediction was also found to increase classification accuracy in high-dimensional data settings [28, 29]. Implicit in this result for simulated data is that additional heterogeneity is not introduced; that is, all samples are drawn from the same population. To evaluate
the effect of a smaller ratio of sample size to number of variables, we examined the setting where the number of variables is high (P = 1000), the effect size is mod-est (Δ = 0.4) and the sample size per group is modest, low and very low (N/2 = 50, 25 and 10). As we can see in Fig. 5, the effect on the pAUC values of reducing the sample size even further is evident in their general shift downwards, with the single exception of the student t test in the Block correlation setting when the number of sig-nificant variables is 200 or 300. However, the wide 95% CIs for the student t test suggest high variability.
[image:8.595.57.539.87.455.2]scores from the projection-based PLS-DA models using the stability-based method when effect sizes are not large and the number of variables is low or modest (≤200).
Finally, the findings from this study provide new results for variable selection methods, especially for the stabil-ity-based variable selection approach, which has not previously been extensively evaluated for LASSO and Elastic Net [5, 12]. The stability-based student t test and VIP scores outperformed Elastic Net and LASSO in all parameter configurations but not when the effect size and the number of variables were large. In general, the stability-based VIP scores performed similarly to or bet-ter than the student t test while Elastic Net performed the same as or slightly better than LASSO. When the number of variables was very large, the FDR-adjusted student t test performed consistently well.
The objective of this paper was to provide guidance on popular and easily accessible variable selection meth-ods already available in R and readily accessible to any researcher. The R package BioMark provides several addi-tional variable selection methods for identifying impor-tant variables to classify new observations into one of two groups, including principal components. The stability-based selection approach adopted in this study avoids over-fitting and is robust even when the sample size in each group is small. Our results suggest that using the VIP scores over the other three stability-based variable selec-tion methods, as it generally provides the highest pAUC values. It was the best performing method when the num-ber of variables was low, and especially when the effect size was modest (≤0.4). When there is a large number of variables (P = 1000) and block correlation is present, the FDR-adjusted student t test performed the best—even in the very-small-sample size setting (10 per group). Thus, it should be the preferred approach in this high variable-to-sample ratio setting. Doubling the sample size from small (50 observations in total) to modest (100 observa-tions in total) tended to yield an increase in the pAUC for any method and any correlation structure with at least some signal in the data (Δ ≥ 0.2). Future research direc-tions should examine ultra high-dimensional data set-tings to see if similar findings hold and should explore the performance of the regularization methods Elastic Net and LASSO across a wider range of sparse data settings. Finally, extension of the stability-based selection approach to other study designs (e.g., three or more groups) would increase its usefulness and widen its applicability.
Abbreviations
Ala: alanine; AR(1): autoregressive of order 1; Asp: aspartic acid; AUC: area under the roc curves; GC–MS: gas chromatography–mass spectrometry; Gly: glycine; LASSO: least absolute shrinkage and selection operator; Lys: lysine; NIST: National Institute for Standards and Technology; pAUC: partial area
under the receiver-operating curve; PLS-DA: partial least squares regression-discriminant analysis models; Pyr: pyroglutamic acid; RI: retention index; ROC: receiver operating characteristic curves; RSD: relative standard deviation; Ser: serine; Thr: threonine; TMS: trimethylsilyl groups; Val: valine; VIP: variable importance in projection.
Authors’ contributions
KK conceived of the project idea, analysed the spiked-in data, and wrote the manuscript. DL carried out the simulation studies and prepared the figures. AW designed the spiked-in data set study as part of YM’s MSc thesis, co-supervised YM who generated the GC-MS spiked-in data set, proposed experimental parameters to evaluate in the simulation study, and revised the manuscript. AD contributed to the simulation study design, methods to be evaluated, and revised the manuscript. OB contributed to the design of the spiked-in data set as YM’s thesis co-supervisor, contributed to the design of the simulation study, and revised the manuscript. All authors read and approved the final manuscript.
Author details
1 Sick Kids Research Institute, 555 University Avenue, Toronto, ON M5G 1X8,
Canada. 2 Department of Systems Pharmacology and Translational
Thera-peutics, Perelman School of Medicine, University of Pennsylvania, 10-113 Translational Research Center, 3400 Civic Center Blvd, Bldg 421, Philadelphia, PA 19104, USA. 3 Department of Mathematics and Statistics, University of
Cal-gary, 2500 University Drive NW, CalCal-gary, AB T2N 1N4, Canada. 4 Department
of Surgery, University of British Columbia, 950 West 10th Avenue, Vancouver, BC V5Z 1M9, Canada. 5 Department of Oncology, Tom Baker Cancer Centre,
University of Calgary, 1331-29th St NW, Calgary, AB T2N 4N2, Canada. 6
Depart-ment of Surgery, University of Calgary, 3330 Hospital Drive NW, Calgary, AB T2N 4N1, Canada. 7 Cancer Epidemiology and Prevention Research, Alberta
Health Services, 2210 – 2 Street SW, Calgary, AB T2S 3C3, Canada.
Competing interests
The authors declare that they have no competing interests.
Availability of data and materials
Option 2: The spiked-in dataset supporting the conclusions of this article is available here: https://people.ucalgary.ca/~kakopciu/Spiked-in Data Set BMC Notes paper.csv. Additional details on our experimental protocol and the data set used in this study are available here: https://people.ucalgary.ca/~kakopciu/
Steps in designing and preparing the spiked-in Data set.pdfThe R software
code written explicitly to generate the simulated data, identify true biomarkers and generate the AUC’s to compare various parameter settings can be found here: https://people.ucalgary.ca/~kakopciu/Simulated Metabolomics Biomark-ers R Code.docx. The program is written using the R programming language, which is licensed as a GNU GPL. R can be run on these operating systems: Unix (including FreeBSD and Linux),Windows, MacOS. It requires the R contributed package BioMark, that will load Matrix, foreach, pls, MASS, st, sda, entropy, corpcor, fdrtool and glmnet packages.
Ethics and consent to participate
Standardized pooled human serum was obtained from the National Institute for Standards and Technology for the spiked-in data experiment (http://
www.nist.gov/srm/index.cfm). Thus, ethics and consent to participate are not
applicable.
Funding
This work was supported by an Undergraduate Student Research Award by the Natural Sciences and Engineering Research Council (NSERC) of Canada to Danny Lu and an NSERC Discovery Grant to A. R. de Leon. The funder had no role in study design, data collection and analysis, decision to publish, or preparation of the manuscript.
Publisher’s Note
Springer Nature remains neutral with regard to jurisdictional claims in pub-lished maps and institutional affiliations.
• We accept pre-submission inquiries
• Our selector tool helps you to find the most relevant journal • We provide round the clock customer support
• Convenient online submission • Thorough peer review
• Inclusion in PubMed and all major indexing services • Maximum visibility for your research
Submit your manuscript at www.biomedcentral.com/submit
Submit your next manuscript to BioMed Central
and we will help you at every step:
References
1. Fan J, Lv J. A selective overview of variable selection in high dimensional feature space. Stat Sin. 2010;20(1):101–48.
2. Andersen CM, Bro R. Variable selection in regression-a tutorial. J Chemom. 2010;24(11–12):728–37.
3. Kang Y, Billor N. Variable selection in the Chlamydia pneumoniae lung infection study. J Data Sci. 2013;11(2):371–87.
4. Clarke R, Ressom HW, Wang A, Xuan J, Liu MC, Gehan EA, Wang Y. The properties of high-dimensional data spaces: implications for exploring gene and protein expression data. Nat Rev Cancer. 2008;8(1):37–49. 5. Wehrens R, Franceschi P. Meta-statistics for variable selection: The R
Pack-age BioMark. J Stat Softw. 2012;51(10):1–18.
6. Team RC. R: a language and environment for statistical computing. Vienna: R Foundation for Statistical Computing; 2016. ISBN 3-900051-07-0. http://
www.R-project.org; 2016.
7. Wold S, Sjostrom M, Eriksson L. PLS-regression: a basic tool of chemomet-rics. Chemom Intell Lab Syst. 2001;58(2):109–30.
8. Chong IG, Jun CH. Performance of some variable selection methods when multicollinearity is present. Chemom Intell Lab Syst. 2005;78(1–2):103–12. 9. Tibshirani R. Regression shrinkage and selection via the Lasso. J R Stat Soc
Ser B Methodol. 1996;58(1):267–88.
10. Zou H, Hastie T. Regularization and variable selection via the elastic net. J R Stat Soc Ser B (Statistical Methodology). 2005;67(2):301–20.
11. Cho S, Kim K, Kim YJ, Lee JK, Cho YS, Lee JY, Han BG, Kim H, Ott J, Park T. Joint identification of multiple genetic variants via elastic-net variable selection in a genome-wide association analysis. Ann Hum Genet. 2010;74:416–28. 12. Meinshausen N, Buhlmann P. Stability selection. J R Stat Soc Ser B Stat
Methodol. 2010;72:417–73.
13. Wehrens R, Franceschi P, Vrhovsek U, Mattivi F. Stability-based biomarker selection. Anal Chim Acta. 2011;705(1):15–23.
14. Benjamini Y, Hochberg Y. Controlling the false discovery rate: a practical and powerful approach to multiple testing. J R Stat Soc Ser B (Methodo-logical). 1995;57(1):289–300.
15. Storey JD. A direct approach to false discovery rates. J R Stat Soc Ser B (Statistical Methodology). 2002;64(3):479–98.
16. Storey JD, Tibshirani R. Statistical significance for genomewide studies. Proc Natl Acad Sci. 2003;100(16):9440–5.
17. Karaman İ, Qannari EM, Martens H, Hedemann MS, Knudsen KEB, Kohler A. Comparison of Sparse and Jack-knife partial least squares regression methods for variable selection. Chemom Intell Lab Syst. 2013;122:65–77.
18. Walter SD. The partial area under the summary ROC curve. Stat Med. 2005;24(13):2025–40.
19. Ma H, Bandos AI, Rockette HE, Gur D. On use of partial area under the ROC curve for evaluation of diagnostic performance. Stat Med. 2013;32(20):3449–58.
20. Hsu M-J, Chang Y-C, Hsueh H-M. Biomarker selection for medical diagnosis using the partial area under the ROC curve. BMC Res Notes. 2014;7(1):1.
21. Pepe M, Janes H. Methods for evaluating prediction performance of biomarkers and tests. In: Lee M-LT, Gail M, Pfeiffer R, Satten G, Cai T, Gandy A (eds) Risk assessment and evaluation of predictions. Berlin: Springer; 2013. pp. 107–142.
22. Goodacre R, Broadhurst D, Smilde AK, Kristal BS, Baker JD, Beger R, Bessant C, Connor S, Capuani G, Craig A. Proposed minimum reporting standards for data analysis in metabolomics. Metabolomics. 2007;3(3):231–41. 23. McConnell Y. Serum metabolomics: development and validation of a
new diagnostic test for pancreatic cancer. Calgary; 2012 (unpublished thesis).
24. Franceschi P, Masuero D, Vrhovsek U, Mattivi F, Wehrens R. A bench-mark spike-in data set for biobench-marker identification in metabolomics. J Chemom. 2012;26(1–2):16–24.
25. Fonville JM, Richards SE, Barton RH, Boulange CL, Ebbels T, Nicholson JK, Holmes E, Dumas ME. The evolution of partial least squares models and related chemometric approaches in metabonomics and metabolic phenotyping. J Chemom. 2010;24(11–12):636–49.
26. Madsen R, Lundstedt T, Trygg J. Chemometrics in metabolomics—a review in human disease diagnosis. Anal Chim Acta. 2010;659(1):23–33. 27. Saccenti E, Hoefsloot HC, Smilde AK, Westerhuis JA, Hendriks MM.
Reflections on univariate and multivariate analysis of metabolomics data. Metabolomics. 2014;10(3):0.
28. Hua J, Tembe WD, Dougherty ER. Performance of feature-selection methods in the classification of high-dimension data. Pattern Recogn. 2009;42(3):409–24.
29. Chu C, Hsu A-L, Chou K-H, Bandettini P, Lin C. Does feature selection improve classification accuracy? Impact of sample size and feature selection on classification using anatomical magnetic resonance images. Neuroimage. 2012;60(1):59–70.