Open Access
Technical Note
Prediction of protein secondary structures with a novel kernel
density estimation based classifier
Darby Tien-Hao Chang
1, Yu-Yen Ou
2,3, Hao-Geng Hung
4, Meng-Han Yang
4,
Chien-Yu Chen
5and Yen-Jen Oyang*
4,6,7,8Address: 1Department of Electrical Engineering, National Cheng Kung University, Tainan, 70101, Taiwan, ROC, 2Graduate School of
Biotechnology and Bioinformatics, Yuan Ze University, Chung-Li, 320, Taiwan, ROC, 3Department of Computer Science and Engineering, Yuan
Ze University, Chung-Li, 320, Taiwan, ROC, 4Department of Computer Science and Information Engineering, National Taiwan University, Taipei,
106, Taiwan, ROC, 5Department of Bio-Industrial Mechatronics Engineering, National Taiwan University, Taipei, 106, Taiwan, ROC, 6Graduate
Institute of Biomedical Electronics and Bioinformatics, National Taiwan University, Taipei, 106, Taiwan, ROC, 7Graduate Institute of Networking
and Multimedia, National Taiwan University, Taipei, 106, Taiwan, ROC and 8Center for Systems Biology and Bioinformatics, National Taiwan
University, Taipei, 106, Taiwan, ROC
Email: Darby Tien-Hao Chang - [email protected]; Yu-Yen Ou - [email protected]; Hao-Geng Hung - [email protected]; Meng-Han Yang - [email protected]; Chien-Yu Chen - [email protected]; Yen-Jen Oyang* - [email protected] * Corresponding author
Abstract
Background: Though prediction of protein secondary structures has been an active research issue in bioinformatics for quite a few years and many approaches have been proposed, a new challenge emerges as the sizes of contemporary protein structure databases continue to grow rapidly. The new challenge concerns how we can effectively exploit all the information implicitly deposited in the protein structure databases and deliver ever-improving prediction accuracy as the databases expand rapidly.
Findings: The new challenge is addressed in this article by proposing a predictor designed with a novel kernel density estimation algorithm. One main distinctive feature of the kernel density estimation based approach is that the average execution time taken by the training process is in the order of O(nlogn), where n is the number of instances in the training dataset. In the experiments reported in this article, the proposed predictor delivered an average Q3 (three-state prediction
accuracy) score of 80.3% and an average SOV (segment overlap) score of 76.9% for a set of 27 benchmark protein chains extracted from the EVA server that are longer than 100 residues.
Conclusion: The experimental results reported in this article reveal that we can continue to achieve higher prediction accuracy of protein secondary structures by effectively exploiting the structural information deposited in fast-growing protein structure databases. In this respect, the kernel density estimation based approach enjoys a distinctive advantage with its low time complexity for carrying out the training process.
Published: 23 July 2008
BMC Research Notes 2008, 1:51 doi:10.1186/1756-0500-1-51
Received: 14 June 2008 Accepted: 23 July 2008
This article is available from: http://www.biomedcentral.com/1756-0500/1/51
© 2008 Chang et al; licensee BioMed Central Ltd.
Findings
MotivationIn structural biology, protein secondary structures act as the building blocks for the protein tertiary structures [1,2]. Therefore, analysis of protein secondary structures is an essential intermediate step toward obtaining a compre-hensive picture of the tertiary structure of a protein. In this respect, one of the main challenges is how to accurately identify the polypeptide segments that could fold to form a secondary structure. This problem is normally referred to as prediction of protein secondary structures [1,3]. Though prediction of protein secondary structures has been an active issue in bioinformatics research for quite a few years and many approaches have been proposed [1,4-10], a new challenge emerges as the sizes of contemporary protein structure databases continue to grow rapidly. The new challenge, which has been addressed in several recently completed studies [9-11], is concerned with how we can effectively exploit the information implicitly deposited in the ever-growing protein structure databases and deliver ever-improving prediction accuracy. In this respect, this article proposes the Prote2S predictor designed with a novel kernel density estimation algorithm [12], which features an average time complexity of
O(nlogn) for carrying out the training process, where n is the number of instances in the training dataset.
Experimental results
This section reports the experiments conducted to investi-gate how Prote2S performs in comparison with the other existing predictors of protein secondary structures. The design of Prote2S is based on the relaxed variable kernel density estimator (RVKDE) that we have recently pro-posed [12]. In the next section, we will discuss how the RVKDE has been incorporated in the design of Prote2S and the related issues.
For Prote2S, the training dataset was derived from the PDB version available at the end of May, 2007. In order to guarantee that no protein chains used to generate the training dataset is homologous to the benchmark protein chains on the EVA server [13], from which the testing dataset was extracted, BLAST [14] was invoked and the cri-terion of homology was set to sequence identity higher than 25%. Then, the CD-HIT clustering algorithm [15] with the similarity threshold set to 0.4 was invoked to remove redundant protein chains in the PDB. After these two processes, a total of 8006 protein chains remained. To generate the training dataset, we followed the approach employed in [6]. Accordingly, one training instance was created for each residue in the 8006 protein chains by associating the residue with the position specific scoring matrix (PSSM) computed by the PSI-BLAST software pack-age [14] with window size set to 15. As a result, a total of
1,801,039 training instances were generated and each was labeled by DSSP [16] as one of the three types of second-ary structure elements: alpha-helix, beta-strand, or coil. The testing dataset used in the following experiments was derived from the 106 benchmark protein chains released on the EVA server between September 7, 2004 and March 1, 2006. We extracted only those 89 protein chains of which the prediction results made by all the 5 predictors involved in the comparison are available on the EVA server. The testing dataset then comprises 27 long protein chains, each of which contains more than 100 residues, and 62 short protein chains.
In addition to the training and testing datasets, we gener-ated a validation dataset for tuning the parameters in Prote2S. How the validation dataset was generated and how the validation process was carried out will be elabo-rated in the next section.
Table 1, 2, 3 show how Prote2S performs with the testing dataset in comparison with the other predictors whose results are available on the EVA server. In Tables 1 and 2, we report the accuracies deliver by alternative predictors with protein chains longer than 100 residues and with those shorter than 100 residues, respectively. One inter-esting observation is that most predictors delivered higher prediction accuracy with the long protein chains than with the short ones. Furthermore, Prote2S delivered the highest prediction accuracy with the long protein chains in comparison with the other predictors. If we use the rule-of-thumb proposed in [11], then the Q3 score deliv-ered by Prote2S with long protein chains is significantly higher than those delivered by the other predictors. On the other hand, though Prote2S still leads in terms of the SOV score with long protein chains, the difference is not significant.
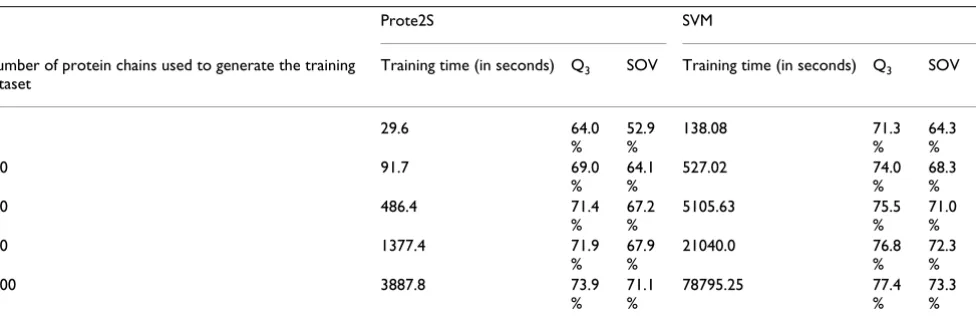
is conceivable that Prote2S can effectively cope with the high growth rate of the PDB and deliver ever-increasing prediction accuracy. In this respect, the experiment reported in Table 4 has been conducted to evaluate the related effects. In this experiment, we provided Prote2S and the LIBSVM package [17] with randomly generated subsets of the training dataset and testing was conducted with the 27 long protein chains in the testing dataset. The Gaussian kernel was adopted in LIBSVM and the two related parameters were set as C = 2 and γ= 0.01 based on the model selection process employed in [18]. The execu-tion times shown in Table 4 were measured on a worksta-tion equipped with an Intel Xeon 3.2GHz CPU and 8-GByte memory and do not include the time taken to carry out model selection or cross validation.
The first observation about the experimental results pre-sented in Table 4 is that the training time with the LIBSVM increases approximately in the order of O(n2). On the
other hand, the training time with the Prote2S increases approximately in the order of O(nlogn). Accordingly, it is conceivable that simply employing the SVM might be impractical for some bioinformatics applications, in which the database involved is already large and still growing fast. Another observation with Table 4 is that LIB-SVM generally delivered higher prediction accuracy than Prote2S but the difference diminishes as the size of the training dataset increases. This observation is consistent with that reported by the research team led by D.T. Jones [6]. According to their study, the SVM can deliver higher prediction accuracy than a neural network when the train-ing dataset is small and the difference diminishes as the size of the training dataset increases.
[image:3.612.54.559.109.264.2]Our proposition concerning the inferior accuracies deliv-ered by Prote2S in Table 4 is that it results from the asymptotic approach employed to establish the mathe-matical foundation of kernel density estimation [12,19].
Table 1: Prediction accuracies delivered by alternative predictors with the 27 protein chains longer than 100 residues extracted from the EVA server.
Q3 Q3H_O Q3H_P Q3E_O Q3E_P Q3C_O Q3C_P SOV SOVH SOVE SOVC
Prote2S 80.3% 76.4% 78.3% 60.5% 75.8% 84.1% 76.3% 76.9% 77.7% 64.9% 75.2% Errsig 2.0% 3.8% 3.4% 9.3% 7.8% 2.0% 2.4% 2.2% 3.2% 9.4% 2.4% PSIPRED 78.2% 78.0% 76.4% 60.6% 67.3% 77.0% 75.3% 75.0% 76.2% 62.7% 72.0%
Errsig 1.2% 4.1% 3.8% 9.0% 9.4% 1.8% 1.9% 1.4% 3.7% 9.0% 1.8% PROFsec 77.9% 71.6% 81.6% 61.0% 63.4% 80.2% 72.7% 76.1% 75.4% 64.1% 73.0%
Errsig 1.2% 3.7% 3.8% 9.2% 9.2% 2.0% 1.6% 1.4% 3.8% 9.2% 1.9% PHDpsi 75.2% 76.4% 77.3% 55.5% 61.9% 74.1% 72.5% 72.5% 75.6% 56.3% 70.1%
Errsig 1.3% 3.5% 3.7% 8.8% 9.3% 2.6% 2.1% 1.7% 3.4% 8.9% 2.4% SABLE2 77.0% 74.0% 79.3% 55.2% 75.0% 80.2% 71.4% 72.6% 74.5% 59.9% 70.1%
Errsig 1.3% 3.5% 3.1% 8.9% 4.8% 2.4% 1.7% 2.0% 3.1% 9.1% 2.6% PROF_king 70.7% 56.6% 72.7% 55.8% 57.8% 77.6% 67.1% 67.5% 60.9% 58.6% 68.2%
Errsig 1.5% 4.6% 7.8% 9.1% 7.2% 1.8% 2.1% 1.6% 4.6% 9.1% 2.2%
Errsig is the significant difference margin for each score and is defined as the standard deviation over the square root of the number of proteins. Q3H/E/C and SOVH/E/C values are the specific Q3 and SOV scores of the predicted helix, strand and coil regions, respectively. Q3H_O (Q3E_O and Q3C_O, respectively) represents correctly predicted helix (strand and coil, respectively) residues (percentage of helix observed), and Q3H_P (Q 3E_P and Q3C_P, respectively) represents correctly predicted helix (strand and coil, respectively) residues (percentage of helix predicted).
Table 2: Prediction accuracies delivered by alternative predictors with the 62 protein chains shorter than 100 residues extracted from the EVA server.
Q3 Q3H_O Q3H_P Q3E_O Q3E_P Q3C_O Q3C_P SOV SOVH SOVE SOVC
Prote2S 75.1% 73.1% 79.4% 69.7% 73.7% 85.3% 70.6% 69.4% 74.7% 71.8% 72.4% Errsig 1.5% 3.5% 3.6% 4.4% 4.7% 1.6% 2.2% 2.5% 3.5% 4.3% 2.1% PSIPRED 77.0% 78.4% 80.3% 69.8% 76.9% 77.5% 77.7% 73.2% 75.4% 72.1% 72.6%
Errsig 1.6% 3.9% 3.2% 4.3% 3.9% 1.8% 2.0% 2.2% 3.9% 4.3% 2.2% PROFsec 76.4% 78.0% 82.4% 75.8% 69.7% 79.6% 74.0% 72.9% 79.7% 77.7% 71.0%
Errsig 1.5% 3.1% 3.2% 3.5% 4.4% 1.6% 1.9% 2.2% 3.1% 3.5% 2.3% PHDpsi 75.6% 82.7% 76.1% 70.4% 67.5% 75.4% 77.2% 70.2% 79.4% 72.0% 69.1%
Errsig 1.7% 3.1% 3.6% 4.1% 4.7% 1.9% 1.9% 2.4% 3.3% 4.1% 2.5% SABLE2 76.3% 76.1% 76.4% 71.3% 61.2% 80.7% 74.8% 71.5% 77.1% 72.1% 71.0%
Errsig 1.6% 3.6% 4.0% 4.1% 5.0% 1.4% 2.0% 2.3% 3.7% 4.2% 2.2% PROF_king 72.5% 67.4% 83.5% 72.6% 66.6% 79.9% 70.1% 65.8% 67.2% 72.8% 68.5%
[image:3.612.54.557.574.729.2]Since the asymptotic approach assumes that the number of training instances approaches infinity, under circum-stances in which the size of the training dataset is not suf-ficiently large, the mathematical model of a kernel density estimator may become inaccurate and the kernel density estimation based predictor may deliver inferior accuracy. Nevertheless, as the size of the training dataset increases, this effect should diminish.
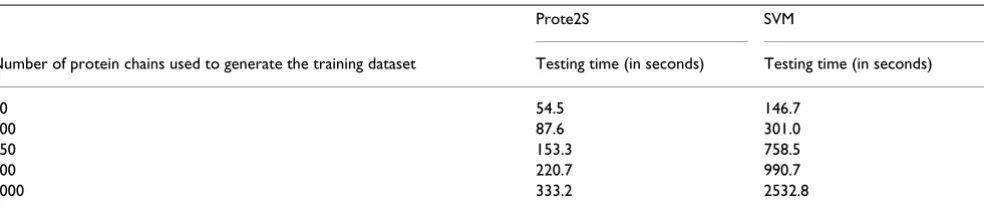
[image:4.612.54.558.110.264.2]Another aspect of the execution time with a predictor is the time taken to make a prediction. In this respect, it has been shown in our recent article that the average time taken by the RVKDE-based predictor to make predictions with n' incoming objects is in the order of O(n' log n) [12]. Table 5 shows how the execution times taken by Prote2S and LIBSVM to make predictions increase with the size of the training dataset. The results show that the execution time taken by Prote2S increases slower than that taken by the SVM, which grows approximately in the same order as the size of the training dataset. In this experiment, we pro-vided Prote2S and the LIBSVM package [17] with ran-domly generated subsets of the training dataset and
testing was conducted with the 27 long protein chains in the testing dataset.
The RVKDE based predictor
As mentioned above, the design of Prote2S is based on a novel kernel density estimation algorithm. The mathe-matical fundamentals of the so-called RVKDE can be found in our recent publication [12]. A kernel density esti-mator is in fact an approximate probability density func-tion. Let {s1, s2..., sn} be a set of sampling instances randomly and independently taken from the distribution governed by fX in the m-dimensional vector space. Then, with the RVKDE algorithm, the value of fX at point v is esti-mated as follows:
1) ; ˆ( )
| | exp
|| || , f n i i m
v v si
si = ⋅ ⎛ ⎝ ⎜ ⎞ ⎠ ⎟ − − ⎛ ⎝ ⎜ ⎜⎜ ⎞ ⎠ ⎟ ⎟⎟
∑
1 1 2 2 2 2p s s wherre
si b R p
k m
m =
+
( )
( )
+( )si
1 2 1
[image:4.612.315.544.464.541.2]Γ
Table 3: Prediction accuracies delivered by alternative predictors with the 89 benchmark protein chains extracted from the EVA server.
Q3 Q3H_O Q3H_P Q3E_O Q3E_P Q3C_O Q3C_P SOV SOVH SOVE SOVC
Prote2S 76.7% 74.1% 79.1% 71.4% 76.6% 84.9% 72.3% 71.7% 75.6% 74.2% 73.3% Errsig 1.3% 2.7% 2.7% 3.2% 3.5% 1.3% 1.7% 1.9% 2.6% 3.2% 1.6% PSIPRED 77.4% 78.3% 79.1% 71.5% 78.5% 77.3% 77.0% 73.7% 75.7% 73.8% 72.4%
Errsig 1.2% 3.0% 2.5% 3.1% 2.9% 1.4% 1.5% 1.6% 2.9% 3.1% 1.6% PROFsec 76.9% 76.0% 82.1% 75.8% 72.3% 79.7% 73.6% 73.9% 78.4% 78.0% 71.6%
Errsig 1.1% 2.5% 2.5% 2.6% 3.2% 1.3% 1.4% 1.6% 2.5% 2.6% 1.7% PHDpsi 75.5% 80.8% 76.5% 70.4% 70.3% 75.0% 75.8% 70.9% 78.2% 71.7% 69.4%
Errsig 1.3% 2.4% 2.7% 3.0% 3.4% 1.5% 1.5% 1.7% 2.5% 3.0% 1.9% SABLE2 76.5% 75.5% 77.3% 70.9% 65.4% 80.6% 73.7% 71.8% 76.3% 72.9% 70.7%
Errsig 1.2% 2.7% 2.9% 3.0% 3.8% 1.2% 1.5% 1.7% 2.7% 3.1% 1.7% PROF_king 72.0% 64.1% 82.5% 72.0% 66.2% 79.2% 69.1% 66.3% 65.3% 73.0% 68.4%
Errsig 1.2% 3.2% 2.6% 3.1% 3.5% 1.2% 1.7% 1.8% 3.3% 3.2% 1.8%
Table 4: Size of the training dataset vs. execution times taken by the Prote2S and the SVM during the training process.
Prote2S SVM
Number of protein chains used to generate the training dataset
Training time (in seconds) Q3 SOV Training time (in seconds) Q3 SOV
50 29.6 64.0
% 52.9 % 138.08 71.3 % 64.3 %
100 91.7 69.0
% 64.1 % 527.02 74.0 % 68.3 %
250 486.4 71.4
% 67.2 % 5105.63 75.5 % 71.0 %
500 1377.4 71.9
% 67.9 % 21040.0 76.8 % 72.3 %
1000 3887.8 73.9
[image:4.612.67.555.568.730.2]2) R(si) is the maximum distance between si and its k near-est training instances;
3) Γ (·) is the Gamma function [20];
4) βand k are parameters to be set either through cross validation or by the user.
[image:5.612.63.555.99.204.2]For prediction of protein secondary structures, one kernel density estimator is created to approximate the distribu-tion of each class of training instances. As mendistribu-tioned ear-lier, in our experiment, each residue is associated with a PSSM computed with the PSI-BLAST software package, and is labeled as one of the three types of secondary struc-ture elements: alpha-helix, beta-strand, or coil, as deter-mined by DSSP. Then, a query instance located at v is predicted to belong to the class that gives the maximum value with the likelihood function defined as follows:
where |Sj| is the number of class-j training instances, and is the kernel density estimator corresponding to class-j training instances. In our current implementation, in order to improve the efficiency of the predictor, we include only a limited number, denoted by k', of the near-est class-j training instances of v while computing . With the predictions made by the RVKDE based algorithm for the query protein chain, Prote2S carries out a smooth-ing process as the last step before outputtsmooth-ing the results. The smoothing process includes two phases. In the first phase, each single-residue segment of secondary struc-tures with its two neighboring residues belonging to the same secondary structure is examined to determine whether switching the prediction of the single-residue seg-ment to the same secondary structure as its neighbors can form a new segment containing 4 or more residues. If yes, then the switching is carried out. Otherwise, nothing will
happen. In the second phase, all the remaining single-res-idue segments of secondary structures except those pre-dicted to be a coil are located and the prediction of each segment is switched to the secondary structure of its longer neighboring segment.
Parameter tuning
In the experiments reported in this article, the 4 parame-ters in the RVKDE algorithm were set as m = 1, β= 3, k = 38, and k' = 60, through a validation process. The valida-tion dataset was derived from the 1903 protein chains deposited into the PDB between June 1 and August 31 in 2007. In order to remove redundancy, BLAST was invoked to guarantee that the BLAST-computed e-value similarity score between any two protein chains in the validation dataset is larger than 0.1. Furthermore, we removed those protein chains that are homologous to one or more of the protein chains used to generate the training dataset with a BLAST-computed sequence identity larger than 25%. As a result, a total of 302 protein chains remained. Among these 302 protein chains, we then included those 45 chains that are longer than 100 residues to generate the validation dataset.
Competing interests
The authors declare that they have no competing interests.
Authors' contributions
YJO proposed the RVKDE algorithm and conceived the study. DTHC and YYO implemented the Prote2S predic-tor. HGH, MHY, and CYC designed the experiments reported in this article. All authors read and approved the final manuscript.
Acknowledgements
This research has been supported by the National Science Council of R.O.C. under the contracts NSC 95-3114-P-002-005-Y and NSC 96-2627-B-002-003 to Y.J. Oyang, 96-2320-B-006-027-MY2 and 96-2221-E-006-232-MY2 to D.T.H. Chang.
References
1. Eidhammer I, Jonassen I, Taylor WR: Protein Bioinformatics: An Algorithmic Approach to Sequence and Structure Analysis.
Chichester: John Wiley & Sons Ltd; 2004. L S j f j
Sh fh h
j( )
| | ( ) | | ( ),
v
v
v
= ⋅
⋅ ∑
ˆ ( )
fj v
ˆ ( )
fj v
Table 5: Size of the training dataset vs. execution times taken by Prote2S and the SVM for making predictions.
Prote2S SVM
Number of protein chains used to generate the training dataset Testing time (in seconds) Testing time (in seconds)
50 54.5 146.7
100 87.6 301.0
250 153.3 758.5
500 220.7 990.7
Publish with BioMed Central and every scientist can read your work free of charge "BioMed Central will be the most significant development for disseminating the results of biomedical researc h in our lifetime."
Sir Paul Nurse, Cancer Research UK
Your research papers will be:
available free of charge to the entire biomedical community
peer reviewed and published immediately upon acceptance
cited in PubMed and archived on PubMed Central
yours — you keep the copyright
Submit your manuscript here:
http://www.biomedcentral.com/info/publishing_adv.asp
BioMedcentral 2. Lesk A: Introduction to Bioinformatics. Oxford: Oxford
Univer-sity Press; 2005.
3. Baldi P, Brunak S: Bioinformatics: the Machine Learning Approach. Cambridge: MIT Press; 2001.
4. Cuff JA, Barton GJ: Application of multiple sequence alignment profiles to improve protein secondary structure prediction. Proteins-Structure Function and Genetics 2000, 40(3):502-511. 5. McGuffin LJ, Bryson K, Jones DT: The PSIPRED protein
struc-ture prediction server. Bioinformatics 2000, 16(4):404-405. 6. Ward JJ, McGuffin LJ, Buxton BF, Jones DT: Secondary structure
prediction with support vector machines. Bioinformatics 2003,
19(13):1650-1655.
7. Wu KP, Lin HN, Chang JM, Sung TY, Hsu WL: HYPROSP: a hybrid protein secondary structure prediction algorithm – a
knowl-edge-based approach. Nucleic Acids Research 2004,
32(17):5059-5065.
8. Lin HN, Chang JM, Wu KP, Sung TY, Hsu WL: HYPROSP II – A knowledge-based hybrid method for protein secondary structure prediction based on local prediction confidence. Bioinformatics 2005, 21(15):3227-3233.
9. Montgomerie S, Sundararaj S, Gallin WJ, Wishart DS: Improving the accuracy of protein secondary structure prediction using structural alignment. BMC Bioinformatics 2006, 7:301.
10. Dor O, Zhou Y: Achieving 80% Ten-fold Cross-validated Accu-racy for Secondary Structure Prediction by Large-scale Training. Proteins: Structure, Function, and Bioinformatics 2007, 66:. 11. Przybylski D, Rost B: Alignments grow, secondary structure
prediction improves. Proteins-Structure Function and Genetics 2002,
46(2):197-205.
12. Oyang YJ, Hwang SC, Ou YY, Chen CY, Chen ZW: Data classifica-tion with radial basis funcclassifica-tion networks based on a novel ker-nel density estimation algorithm. IEEE Transactions on Neural Networks 2005, 16(1):225-236.
13. EVA [http://cubic.bioc.columbia.edu/eva/]
14. Altschul SF, Madden TL, Schaffer AA, Zhang JH, Zhang Z, Miller W, Lipman DJ: Gapped BLAST and PSI-BLAST: a new generation of protein database search programs. Nucleic Acids Research
1997, 25(17):3389-3402.
15. Li WZ, Godzik A: CD-HIT: a fast program for clustering and comparing large sets of protein or nucleotide sequences. Bio-informatics 2006, 22(13):1658-1659.
16. Kabsch W, Sander C: Dictionary of Protein Secondary Struc-ture – Pattern-Recognition of Hydrogen-Bonded and Geo-metrical Features. Biopolymers 1983, 22(12):2577-2637. 17. Chang CC, Lin CJ: LIBSVM: a library for support vector
machines. 2001 [http://www.csie.ntu.edu.tw/~cjlin/libsvm]. 18. Hsu CW, Lin CJ: A comparison of methods for multiclass
sup-port vector machines. IEEE Transactions on Neural Networks 2002,
13(2):415-425.
19. Silverman BW: Density Estimation for Statistics and Data Analysis. Boca Raton: Chapman & Hall/CRC; 1986.