R E S E A R C H A R T I C L E
Open Access
Evaluation of bottom-up interventions
targeting community-dwelling frail older
people in Belgium: methodological
challenges and lessons for future
comparative effectiveness studies
Anne-Sophie Lambert
1*, Sophie Ces
1, Espoir Bwenge Malembaka
1,2, Thérèse Van Durme
1, Anja Declercq
3and
Jean Macq
1Abstract
Background:Optimizing the organization of care for community-dwelling frail older people is an important
issue in many Western countries. In Belgium, a series of complex, innovative, bottom-up interventions was recently designed and implemented to help frail older people live at home longer. As the effectiveness of these interventions may vary between different population groups according to their long-term care needs, they must be evaluated by comparison with a control group that has similar needs.
Methods: The goal was to identify target groups for these interventions and to establish control groups with
similar needs and to explore, per group, the extent to which the utilization of long-term care is matched to needs. We merged two databases: a clinical prospective database and the routine administrative database for healthcare reimbursements. Through Principal Component Analysis followed by Clustering, the intervention group was first stratified into disability profiles. Per profile, comparable control groups for clinical variables were established, based on propensity scores. Using chi-squared tests and logistic regression analysis, long-term care utilization at baseline was then compared per profile and group studied.
Results: Stratification highlighted five disability profiles: people with low-level limitations; people with limitations in
instrumental activities of daily life and low-level of cognitive impairment; people with functional limitations; people with functional and cognitive impairments; and people with functional, cognitive, and behavioral problems. These profiles made it possible to identify long-term care needs. For instance, at baseline, those who needed more assistance with hygiene tasks also received more personal nursing care (P< 0.05). However, there were some important discrepancies between the need for long-term care and its utilization: while 21% of patients who were totally dependent for hygiene tasks received no personal nursing care, personal nursing care was received by 33% of patients who could perform hygiene tasks.
Conclusions:The disability profiles provide information on long-term care needs but not on the extent to which those
needs are met. To assess the effectiveness of interventions, controls at baseline should have similar disability profiles and comparable long-term care utilization. To allow for large comparative effectiveness studies, these dimensions should ideally be available in routine databases.
Keywords:Comparative effectiveness studies, Bottom-up interventions, Stratification of population, Aging, Belgium
© The Author(s). 2019Open AccessThis article is distributed under the terms of the Creative Commons Attribution 4.0 International License (http://creativecommons.org/licenses/by/4.0/), which permits unrestricted use, distribution, and reproduction in any medium, provided you give appropriate credit to the original author(s) and the source, provide a link to the Creative Commons license, and indicate if changes were made. The Creative Commons Public Domain Dedication waiver (http://creativecommons.org/publicdomain/zero/1.0/) applies to the data made available in this article, unless otherwise stated. * Correspondence:[email protected]
1Institute of Health and Society (IRSS), Université Catholique de Louvain, Clos chapelle aux champs 30 /B1.30.15.05, 1200 Brussels, Belgium
Background
The health status of older people is often characterized by the interplay between frailty, multi-morbidity, and disabil-ity. Frail older people are usually more vulnerable to stressors as a consequence of a significant reduction of physiological reserves [1,2]. Multi-morbidity is defined by the presence of two or more chronic conditions [3]. The World Health Organization (WHO) defines disability as
“an umbrella term for impairments, activity limitations or participation restrictions”[4]; the last-named refers to dif-ficulties in carrying out essential tasks for independent liv-ing and is assessed by the activities of daily life (ADL) and instrumental activities of daily life (IADL) scales [5]. How-ever, it is worth noting that disability is strongly influenced by cognitive status [6,7].
These three distinct concepts are strong determinants of service needs and utilization, and more specifically of home care support [5]. Frailty is associated with a higher utilization of both health services–including the primary care providers, clinical specialist physicians, hospital ad-missions, and emergency department visits–and home care services such as nursing care, home help, and meals-on-wheels [8]. People with multi-morbidity consult spe-cialists and general practitioners more often and are more frequently admitted to hospital, where they have longer stays, on average, than people without multi-morbidity [3]. Multi-morbidity is also associated with long-term care needs. Indeed, long-term care needs are high in people suffering from neurological disorders such as dementia and Parkinson’s disease, as well as in people who have had a stroke or suffer from diabetes or oncological conditions [9]. However, the level of disability is the foremost deter-minant of long-term care expenditure. The level of disabil-ity has different repercussions on long-term care needs [10] and determines the necessity to start using home care and to move from home care to a nursing home [11].
Finally, health services utilization is uneven among people with similar needs. Two situations of mismatch between needs and services utilization may be at play. First, the overuse of healthcare services that are unlikely to improve or may even negatively affect people’s health, what are called “lower-value services” [12]; and second, the underuse of health and social services that would improve people’s health. As a consequence, patterns of health service utilization should be analyzed in the light of service (mis)use.
In Belgium, the number of older persons and the num-ber of frail or dependent older persons with multi-morbidity will rise in the coming years [13]. An increasing number of dependent people are expected to remain at home, because of the expected shortage of beds in nursing homes [14]. The majority of older people also prefer to re-main in their own surroundings, rather than be admitted to a nursing home [14]. Consequently, older people with
many more disabilities will live at home, supported by both formal and informal caregivers. Against this back-ground, a nationwide program (Protocol 3 (P3)), which consists of a set of innovative, bottom-up-designed inter-ventions that include case management, occupational therapy at home, psychological support, and respite care, were financed by the National Institute of Health and Dis-ability Insurance and were implemented in the form of pilot projects [15]. Case management intervention con-sisted of (a) an individualized assessment of needs and preferences, (b) planning of services, according to the re-sults of this assessment, (c) patient-centered care coordin-ation, and (d) re-evaluation and adjustment of care coordination. Occupational therapy provided mainly home adaptation in order to: (1) adapt patients’living en-vironments to their current conditions and (2) offer better work conditions to home caregivers. Psychological sup-port interventions delivered psychological, psychosocial support, and psychotherapy at home, provided by a trained psychologist or psychotherapist. The focus of these heterogeneous interventions was on the support of frail older people at home with the aim of preventing the risk of institutionalization in a nursing home while maintain-ing a satisfactory quality of life, without increasmaintain-ing the burden on family carers, and fostering a more efficient use of health and social care services [15].
The evaluation of these interventions consisted of de-scribing them, identifying the facilitators and barriers to their implementation, and assessing their impact on clin-ical outcomes, service utilization, and cost for different sub-populations. Given the heterogeneity of both the in-terventions and the targeted populations, a comparative effectiveness design and multi-embedded case studies were considered to be more appropriate than a random-ized control trial. This paper discusses the methodo-logical challenges of the comparative effectiveness study; the case studies are the focus of another paper [16]. We used an observational longitudinal study design, with routine data and prospective data collection, to compare frail older people receiving care and benefiting from dif-ferent types of interventions (intervention group) with a group of study participants benefitting from “routine care”(control group).
Two challenges are usually encountered in designing comparative effectiveness studies: first, the relevant stratification of the overall sample so as to identify the most suitable intervention per sub-group of frail older people; second, the definition of an adequate control group in order to evaluate the consequences of the interventions.
of the intervention groups. As mentioned above, this can be done by looking at disability, family caregiving, and health services utilization. This paper will therefore propose a systematic methodological approach to ad-dressing the following questions:
Is it possible to identify the need for long-term care? Can this lead to a meaningful stratification of frail older people and a clear definition of a control group?
To what extent does the utilization of long-term care match the need for long-term care?
Is it possible to use a routine database of healthcare reimbursements to select controls with long-term care needs similar to those of the intervention groups?
Methods
Overall methodological approach
We developed a step-by-step methodological process combining different approaches. First, we divided the intervention group into intragroup-homogeneous strata to define different disability profiles. Second, we carried out a one-by-one matching of the participants from the intervention group with the control group to account for people with similar long-term care needs. Third, we compared healthcare utilization between the groups studied in order to evaluate the baseline difference in how widely those needs are met (low and high value).
Inclusion criteria
The inclusion criteria for selecting participants in the intervention and the control groups included: [17] being at least 60 years old and scoring at least six on the Edmon-ton Frail Scale [18]; having a dependency status of A, B, or C on the Katz home scale or a B, C, or Cd status on the Katz residential scale [19]; or having been diagnosed with dementia by a geriatrician, neurologist, or psychiatrist. People in both groups were living at home at baseline.
Characteristics of the databases used
Two databases were available and were merged with na-tional registration numbers for this study.
The first is the BelRAI database which is the Belgian version of an internationally validated geriatric compre-hensive assessment, the interRAI Instrument Home Care version (interRAI HC) [20]. This provided prospective data on the main clinical variables. Functional perform-ance in activities of daily life (ADL) was evaluated by four items (personal hygiene, toilet use, locomotion, and eat-ing) with a total score varying from 0 to 6. A total score above 3 (cut-off of ADL scale) indicates major depend-ency; 6 is the maximum level of dependency [21]. Func-tional performance in instrumental activities of daily life
(IADL) was evaluated by eight items (meal preparation, ordinary housework, managing finances, managing medi-cations, phone use, stairs, shopping, and transportation) with item scores varying from 0 to 6 and total scores vary-ing from 0 to 48 [22]. A total score above 24 (cut-off of IADL scale) indicates major dependency; 48 is the max-imum level of dependency. Cognitive status was evaluated by a cognitive performance score (CPS), which consisted of four items (decision-making, short-term memory, pro-cedural memory, and comprehension). The total score ranges from 0 to 6; a total score above 3 (cut-off of CPS scale) indicates major cognitive impairment [23]. The de-pression rating scale (DRS), with total scores ranging from 0 to 14, was used to evaluate depression symptoms. A total score above 3 (cut-off of DRS scale) indicates signifi-cant depressive symptoms; a score of 14 indicates the presence of all mood symptoms in the last 3 days [24]. Be-havioral problems (Behav.) were evaluated by the Aggres-sive Behavior Scale (ABS), which includes five items (wandering, verbal aggression, physical violence, abnormal social behavior, and resistance of care) [25]. The total score varies from 0 to 12 [25]. A total score above 0 indi-cates behavioral problems (cut-off of Aggressive Behavior Scale); a score of 12 indicates frequent and varied behav-ioral problems [25]. The level of presence of a family carer, the Zarit Burden interview, and the WHO-QoL-8 were added to interRAI Instrument in the BelRAI database. The level of presence of a family carer was encoded, ac-cording to living arrangements, as a categorical variable with three levels (without a family carer, with a non- resi-dent family carer, and with a co-resiresi-dent family carer). This categorization allows the differentiation of the inten-sity of informal caregiving provided [26]. The 12-item ver-sion of the Zarit Burden interview (ZBI-12) was used to estimate the burden on family carers. This scale contains 12 items, with scores from 0 to 4. The total score ranges from 0 to 48; higher scores are indicative of greater bur-dens on family carers. A total score above 10 (cut-off of ZBI-12 scale) indicates that a family carer has significant depressive symptoms [27]. The WHO- QoL-8 was used as a concise instrument to measure the client’s perceived generic quality of life [28]. Finally, an ad-hoc economic questionnaire was used to measure social care services utilization and informal aid. The interRAI HC instrument was filled out at enrolment, at the exit of the patient from the project, and 6 months after enrolment [15]. Only the baseline evaluation data were used for this paper.
Secondly, the IMA database from the Inter-mutuality Agency provided routine data on the healthcare services reimbursed by the National Insurance for Health and Disability Institute (NIHDI).
(intervention group) and 605 older persons benefitting from“usual care”, who were recruited at home by nurs-ing care organisations (control group). Of the beneficiar-ies of Protocol 3 intervention, 1811 lived at home and had no family carer, 5735 had a non-resident family carer, and 3842 had a co-resident family carer. In the control group, 78 lived at home and had no family carer, 268 had a non-resident family carer, and 259 had a co-resident family carer.
In addition, the median fiscal income per household by municipality (data fromstatbel.fgov.be) was used as a proxy for socioeconomic level. Belgian municipalities were classified in three categories by using the first and the third quartiles of the median fiscal income per household. Municipalities included in the first quartile, accordingly, have a low median fiscal income per house-hold. The municipalities included between the first and the third quartile, have a medium median fiscal income per household. And the municipalities in the last quar-tile have a high median fiscal income per household.
Stratification of the intervention group
In order to identify population groups with specific long-term care needs, we identified“natural” clustering of indi-viduals with a similar disability profile in the intervention group, using statistical analysis to establish classification schemes [29].
The variables used for the establishment of classifica-tion schemes were inspired by existing classificaclassifica-tions in which clinical scales (ADL, IADL, depression, and cogni-tion) and comorbidity were included [30–32]. These classifications highlighted the fact that cognitive and functional limitations fit the different disability profiles better than comorbidities [30]. Indeed, the need for long-term care services is associated with specific limita-tions [10] (i.e. significant IADL limitations are associated with needing household aid services (domestic help, home care worker, or meals-on wheels, etc.); significant ADL limitations are associated with needing personal nursing care; and significant cognitive impairment is as-sociated with needing supervision [33]). Hence, the co-morbidities were not included in our classification. A specific scale for behavioral problems was included in our classification because people with behavioral prob-lems represent a population with specific health and so-cial care needs, including the need for supervision by family carers and the need for respite care for those carers [34]; in addition, this population is likely to make less use of support services [34] and imposes a greater burden on family carers [35].
The “natural” clustering was, consequently, established by combining the different scores on functional limita-tions, cognitive performance, and the presence of behav-ioral problems in a Principal Component Analysis (PCA),
followed by a cluster analysis (based on the PCA correl-ation matrix between the initial variables and the principal components) [36]. A hierarchical algorithm (Ward algo-rithm) was used to define the number of groups by the de-composition of the inertia of the cloud of points while minimizing the loss of information at each additional clus-tering. The number of groups obtained was the result of a trade-off between intra-group homogeneity and inter-group heterogeneity [36]. This method was employed using the FactoMineR package [37] in R. Disability profiles were presented by means of the descriptive statistics of the BelRAI scales. For each scale, the median and inter-quartile range, both for the total score and for each item, and the proportion of individuals above the total score cut-off were presented.
One-by-one matching of participants from the intervention group with the control group
The control group was constituted by one-by-one match-ing of P3 beneficiaries with individuals from the control group, based on a similar level of presence of a family carer and maximum similarity in scores on the clinical scales, age, and sex.
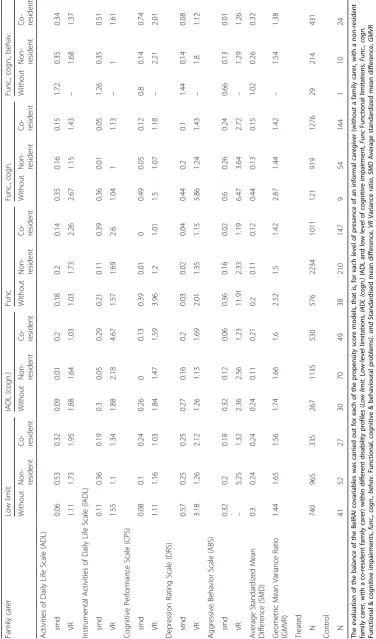
Finally, the evaluation of the covariate balance was carried out using the standardized mean difference (smd) and the analogous variance ratio (VR). To evalu-ate multiple covarievalu-ates balance, the average standardized mean difference (SMD) and the Geometric Mean Vari-ance Ratio (GMVR) were used [41,42].
Relationship between disability profiles and healthcare utilization
Identification and selection of relevant IMA-AIM proxies of chronic disability profiles
The selection of proxies of disability was done by experts (geriatrician, liaison nurse, clinical pharmacist) based on two questions: (1) which kinds of healthcare utilization can be identified as signs of a long-term disability in older people? (2) Which kinds of healthcare utilization allow us to distinguish between different disability pro-files among older people?
To identify chronic disability status, proxies were de-fined based on a one-year observation period before inclu-sion in a P3 project. By way of illustration, medication was considered chronic when a medicine was taken for more than 3 months in a given year. This selection was con-firmed by a univariate test assessing whether proxies de-fined as binary variables were associated with the risk of institutionalization. The latter was strongly associated with cognitive and functional impairment [43]. Therefore, the factors associated with the risk of institutionalization were considered as good proxies for disability status.
Besides the proxies for chronic disability status, multi-morbidity is also frequently discussed in the literature [5]. The multi-morbidity variables were created from prescription drug data using the Anatomical Therapeutic Chemical (ATC) classification system [44], which recog-nizes 22 chronic conditions. The presence of two or more chronic conditions in the same individual indicates multi-morbidity [5].
Comparison of healthcare utilization between different disability profiles within the intervention group
Proportions of healthcare users were presented to de-scribe the healthcare utilization for the different disabil-ity profiles and were compared by a chi-squared test.
Comparison of healthcare utilization by groups studied The difference in proportion of healthcare users between the intervention and the control groups was calculated by a logistic regression for all the proxies, with the interven-tion group status equaling one and the control group sta-tus equaling zero. The odds ratios with their normal bootstrap percentile confidence intervals were adjusted to socioeconomic variables (age, gender, median fiscal in-come by municipality, and region) and were computed using the Boot package in R [38, 45]. The bootstrapping
method used to build the confidence intervals withstands the assumption of normality and equality of variances.
Results
Description of the disability profiles of the intervention group
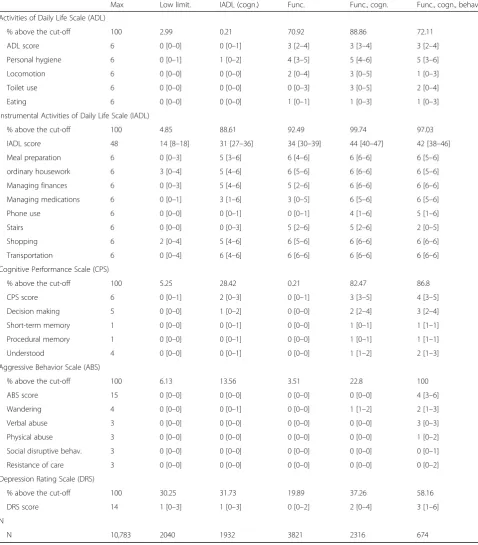
The cluster analysis highlighted five disability profiles (Table 1). The first disability profile (N= 2040) was called “low-level limitations (low limit.)”, and consisted of individuals with no significant functional limitation or cognitive impairment.
The second disability profile (N= 1932) was the“IADL and low level of cognitive impairment (IADL (cogn.)” group. Basically, it consisted of individuals with IADL difficulties, of whom 88% were above the IADL cut-off, with difficulties mainly in preparing meals, performing ordinary housework, managing finances, managing med-ications, shopping, and transportation. In addition, a ma-jority (55%) of individuals in this group had minor cognitive impairments (CPS score higher than 1), 14% had behavioral problems (mainly wandering), and 32% suffered from depressive symptoms.
The third disability profile (N= 3821), referred to as
“functional limitations (func.)”, was made up of individuals whose limitations were mostly functional ones. Of these, 92.5% had an IADL score above the cut-off of dependency and 71% had difficulties performing ADL, especially in hy-giene tasks. Indeed, up to 64% of individuals in this group needed some help to accomplish 50% of personal hygiene-related tasks.
The fourth disability profile (N= 2316) was called“ func-tional and cognitive impairments (func., cogn.)” and con-sisted of individuals with both functional limitations and cognitive impairment. Up to 100 and 89% of individuals in this group were above the IADL and ADL cut-offs respect-ively and 82.5% had CPS scores above the cut-off that de-fines cognitive impairment. Additionally, over 75% of participants in this category were completely dependent for almost all IADL tasks. The main ADL limitation was related to hygiene tasks, with which 86% of the participants needed extensive assistance. Such difficulties were more pronounced in this group than among those grouped under the “functional limitations” disability profile, prob-ably due to the concurrence of functional limitations with cognitive impairment.
of the three prior to the evaluation. Individuals in this group were similar to those grouped under the “ func-tional and cognitive impairments” disability profile
[image:6.595.58.537.101.647.2]with regard to functional aspects, but they suffered from more serious cognitive problems (mainly in decision-making and comprehension).
Table 1Description of the total and item-specific scores of the BelRAI scales for disability profiles
Max Low limit. IADL (cogn.) Func. Func., cogn. Func., cogn., behav.
Activities of Daily Life Scale (ADL)
% above the cut-off 100 2.99 0.21 70.92 88.86 72.11
ADL score 6 0 [0–0] 0 [0–1] 3 [2–4] 3 [3–4] 3 [2–4]
Personal hygiene 6 0 [0–1] 1 [0–2] 4 [3–5] 5 [4–6] 5 [3–6]
Locomotion 6 0 [0–0] 0 [0–0] 2 [0–4] 3 [0–5] 1 [0–3]
Toilet use 6 0 [0–0] 0 [0–0] 0 [0–3] 3 [0–5] 2 [0–4]
Eating 6 0 [0–0] 0 [0–0] 1 [0–1] 1 [0–3] 1 [0–3]
Instrumental Activities of Daily Life Scale (IADL)
% above the cut-off 100 4.85 88.61 92.49 99.74 97.03
IADL score 48 14 [8–18] 31 [27–36] 34 [30–39] 44 [40–47] 42 [38–46]
Meal preparation 6 0 [0–3] 5 [3–6] 6 [4–6] 6 [6–6] 6 [5–6]
ordinary housework 6 3 [0–4] 5 [4–6] 6 [5–6] 6 [6–6] 6 [5–6]
Managing finances 6 0 [0–3] 5 [4–6] 5 [2–6] 6 [6–6] 6 [6–6]
Managing medications 6 0 [0–1] 3 [1–6] 3 [0–5] 6 [5–6] 6 [5–6]
Phone use 6 0 [0–0] 0 [0–1] 0 [0–1] 4 [1–6] 5 [1–6]
Stairs 6 0 [0–0] 0 [0–3] 5 [2–6] 5 [2–6] 2 [0–5]
Shopping 6 2 [0–4] 5 [4–6] 6 [5–6] 6 [6–6] 6 [6–6]
Transportation 6 0 [0–4] 6 [4–6] 6 [6–6] 6 [6–6] 6 [6–6]
Cognitive Performance Scale (CPS)
% above the cut-off 100 5.25 28.42 0.21 82.47 86.8
CPS score 6 0 [0–1] 2 [0–3] 0 [0–1] 3 [3–5] 4 [3–5]
Decision making 5 0 [0–0] 1 [0–2] 0 [0–0] 2 [2–4] 3 [2–4]
Short-term memory 1 0 [0–0] 0 [0–1] 0 [0–0] 1 [0–1] 1 [1–1]
Procedural memory 1 0 [0–0] 0 [0–1] 0 [0–0] 1 [0–1] 1 [1–1]
Understood 4 0 [0–0] 0 [0–1] 0 [0–0] 1 [1–2] 2 [1–3]
Aggressive Behavior Scale (ABS)
% above the cut-off 100 6.13 13.56 3.51 22.8 100
ABS score 15 0 [0–0] 0 [0–0] 0 [0–0] 0 [0–0] 4 [3–6]
Wandering 4 0 [0–0] 0 [0–1] 0 [0–0] 1 [1–2] 2 [1–3]
Verbal abuse 3 0 [0–0] 0 [0–0] 0 [0–0] 0 [0–0] 3 [0–3]
Physical abuse 3 0 [0–0] 0 [0–0] 0 [0–0] 0 [0–0] 1 [0–2]
Social disruptive behav. 3 0 [0–0] 0 [0–0] 0 [0–0] 0 [0–0] 0 [0–1]
Resistance of care 3 0 [0–0] 0 [0–0] 0 [0–0] 0 [0–0] 0 [0–2]
Depression Rating Scale (DRS)
% above the cut-off 100 30.25 31.73 19.89 37.26 58.16
DRS score 14 1 [0–3] 1 [0–3] 0 [0–2] 2 [0–4] 3 [1–6]
N
N 10,783 2040 1932 3821 2316 674
Evaluation of the matching balance
The matching balance was respected: all the average standardized mean difference were smaller than 0.25 and all the geometric mean variance ratio were smaller than 2, excepted for strata with a small number of Protocol 3 beneficiaries and a small number of potential controls (e.g., where there were only 29 beneficiaries and one control without informal caregivers and with func-tional, cognitive, and behavioral problems, or where there were 121 beneficiaries and 9 controls without an informal caregiver and with functional and cognitive im-pairment) (Table 2). That can be explained by the lim-ited number of people living alone at home who had significant cognitive impairment.
Relationship between disability profile and healthcare utilization
Description of healthcare utilization by disability profile in the intervention group
The five disability profiles allow us to identify long-term care needs. However, it was not always clear to what ex-tent the need for healthcare of those with particular dis-ability profiles matched utilization of that care.
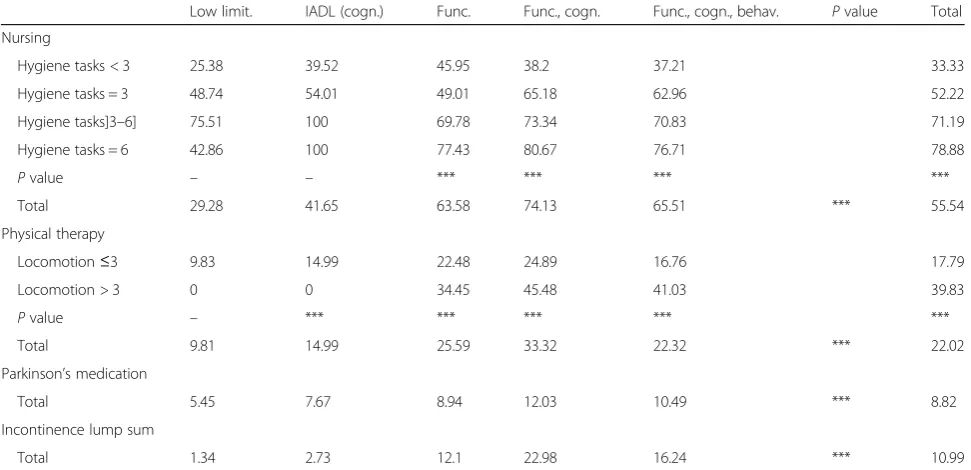
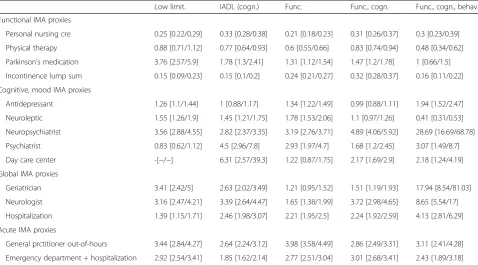
People who had used nursing services for hygiene tasks (personal nursing care) more than twice a week for more than 3 months in the year preceding inclusion in the study were considered to be chronic users of nursing care for dependency reasons. The greater the need of as-sistance with hygiene tasks, the more personal nursing care was used. Personal nursing care was given to 33% of people without hygiene task difficulties, to 52% of those in need of occasional assistance, to 71% of those whose need of assistance was judged to be major or maximal, and to 79% of people with total dependency for hygiene tasks (Table 3). People who used physical therapy for dependency reasons had a prescription as part of the treatment of severe pathologies or for 60 physical therapy sessions after experiencing a fall. This need for physical therapy increased significantly with the need for assistance with locomotion: it was seen in 40% of people needing assistance with locomotion as against 18% of those not in need of assistance with locomotion (Table 3). Parkinson’s medication intake varied signifi-cantly between disability profiles, ranging from 5% for individuals with a low-level limitations profile up to 12% for people with high levels of functional and cognitive impairment (Table 3). The same variation was seen in those receiving the incontinence lump sum (a fixed pay-ment system for incontinence material [46]), with pro-portions ranging from 1% among individuals with low-level limitations up to 23% for people with high low-levels of functional and cognitive impairment (Table3).
Antidepressant intake was reported in 42% of the study participants (Table4). It was more frequent (53%) among
people whose depression rating score was above the cut-off. However, 38% of people who scored lower on the DRS scale took antidepressants (Table 4). Neuroleptic intake was significant among people with cognitive impairments (31% of those with CPS above the cut-off ) and was higher among those with cognitive and behavioral problems, be-ing prevalent in 41% of people who had the “functional, cognitive, and behavioral problems” disability profile. However, their use was not limited to people who were cognitively impaired: 15.5% of those without cognitive problems also took neuroleptics (Table 4). Visits to a neuropsychiatrist (at least one visit in the year preceding inclusion in the study) were more frequent among individ-uals suffering from cognitive problems than among people with depressive symptoms. On the other hand, consult-ation of a psychiatrist (at least one consultconsult-ation in the year preceding inclusion) was more common in people with depressive symptoms than in those who were cognitively impaired. Day care center use was less frequent (3% of the total sample), but was higher in people with cognitive im-pairments (7%) (Table4).
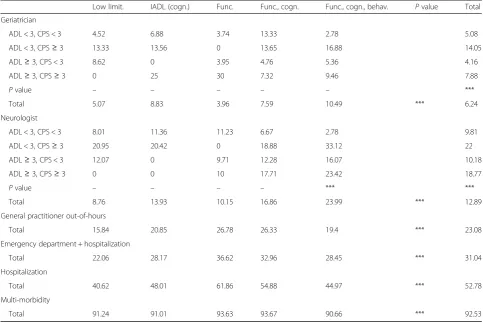
Geriatricians were consulted more often by people with cognitive problems, whether these were combined with functional limitations or not. The more complex the disability profile, the more often a neurologist was consulted. For people with similar disability profiles, a neurologist was more frequently consulted by those with cognitive impairment. Neurologists were more fre-quently visited than geriatricians (13% versus 6% of the total sample) (Table5). The association between visits to an emergency department or out-of-hours general prac-titioner visits (evening, weekend, or public holiday con-sultations) and the severity of disabilities was unclear. Beneficiaries of Protocol 3 with functional limitations were the biggest users of emergency departments (36.62% used an emergency department at least once a year), followed by beneficiaries with functional and cog-nitive impairment (32.96%), followed by beneficiaries with functional, cognitive, and behavioral problems (28.45%) and beneficiaries with IADL limitations and a low level of cognitive impairment (28.17%) (Table5). Fi-nally, up to 92.5% of people suffered from multi-morbidity (Table 5) and the number of morbidities was roughly similar in the different disability profiles, with a median number of comorbidities equal to 4 in all dis-ability profiles.
Disability profiles: adjusted comparison of healthcare utilization between groups studied
socioeconomic variables (Additional file 1 presents socio-economic variables). Participants in the control group re-ceived significantly more personal nursing care and physical therapy and more of them received the incontin-ence lump sum. Parkinson’s medication was prescribed more often in the intervention group, except for individuals with functional, cognitive, and behavioral problems, for whom there was no difference. Neuroleptics, a specific medication for cognitive impairments, was used more in the intervention group than in the control group by those who did not have significant cognitive impairments. Indi-viduals with low to severe levels of cognitive impairment used day care centers significantly more often in the inter-vention group than in the control group. Finally, people in the intervention group consulted more specialists and used the emergency department significantly more than those in the control group, regardless of their disability profile.
Discussion
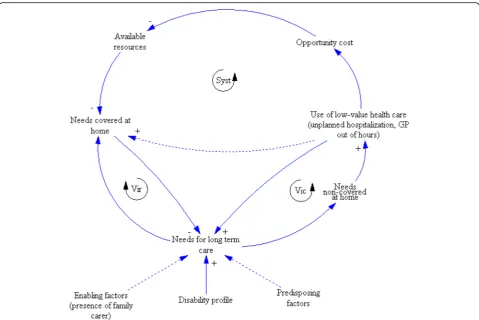
As argued in the introduction, schematized in Fig.1, and described in Anderson’s socio-behavioral model of health service utilization [47], the need for and the utilization of long-term care depend on predisposing factors associated with the likelihood of needing health services (e.g.. age or gender), on enabling factors (including the availability of health facilities and the capacity to avail of health ser-vices), and on health-related factors such as the level of disability [48]. In the context of aging, a crucial enabling factor for utilization of long-term care is social support
and especially the living arrangements of a family carer. The living arrangements of a family carer influence both informal and formal care [26], as a co-resident family carer is more involved in help (i.e. intimate care) [49], while a non-resident family carer is more likely to call on health and social care services [39].
[image:9.595.56.542.100.335.2]As the results showed that older persons with simi-lar disability profiles don’t necessary utilize healthcare in similar ways, the coverage of long-term care needs could be described by two distinct pathways when healthcare utilization and disability profiles are com-bined. First, a virtuous pathway (Vir loop) is present when the needs for health and social care are cov-ered. The coverage of these needs diminishes future needs and lessens the use of services that have low value. For instance, it is known that the use of both a primary physician and primary care services along with a high level of continuity of care are associated with lower rates of emergency department use [50]. Second, a vicious loop is initiated by a lack of cover-age of long-term care needs, leading to an overuse of low-value services (unplanned hospitalization, out-of-hours general practitioner visits); this results either in an increase in needs (Vic loop) or a break of the vi-cious loop when a response is provided to initial needs (dotted arrow). This vicious loop is well docu-mented for emergency department use. People with unmet healthcare needs and without primary and supportive care services have been shown to visit
Table 3Functional IMA proxies by disability profile and level of limitation for specific ADL tasks
Low limit. IADL (cogn.) Func. Func., cogn. Func., cogn., behav. Pvalue Total
Nursing
Hygiene tasks < 3 25.38 39.52 45.95 38.2 37.21 33.33
Hygiene tasks = 3 48.74 54.01 49.01 65.18 62.96 52.22
Hygiene tasks]3–6] 75.51 100 69.78 73.34 70.83 71.19
Hygiene tasks = 6 42.86 100 77.43 80.67 76.71 78.88
Pvalue – – *** *** *** ***
Total 29.28 41.65 63.58 74.13 65.51 *** 55.54
Physical therapy
Locomotion≤3 9.83 14.99 22.48 24.89 16.76 17.79
Locomotion > 3 0 0 34.45 45.48 41.03 39.83
Pvalue – *** *** *** *** ***
Total 9.81 14.99 25.59 33.32 22.32 *** 22.02
Parkinson’s medication
Total 5.45 7.67 8.94 12.03 10.49 *** 8.82
Incontinence lump sum
Total 1.34 2.73 12.1 22.98 16.24 *** 10.99
emergency departments more often. These people are extremely vulnerable and the focus on acute problems in emergency departments and inadequate follow-up can lead to recurring emergency department visits, subsequent hospitalizations, institutionalization, or even death [51].
The potential gain obtained from the coverage of previ-ously uncovered needs by Protocol 3 interventions is not limited to the individual; these interventions can also sub-stantially reduce the pressure on the health system. This has been supported by literature suggesting that a signifi-cant proportion of emergency department visits by older people could potentially be prevented by better primary
healthcare [52]. It has also been shown that older people take up a higher proportion of emergency department use and of hospital stays [51]. Their emergency department visits are more complex and more likely to result in hospitalization than those of younger people [53].
The consequences of P3 interventions on the individ-ual vicious loop and the systemic vicious loop can be studied adequately, provided that the three essential questions in conducting comparative effectiveness stud-ies, and at the basis of this paper’s objective, can be tackled.
[image:10.595.57.540.99.519.2]We will now review key lessons and elements of re-sponses to these questions in the light of our results.
Table 4Cognitive and mood IMA proxies by disability profile and level of DRS and/or CPS impairments
Low limit. IADL (cogn.) Func. Func., cogn. Func., cogn., behav. Pvalue Total
Antidepressant
DRS < 3 33.59 36.99 37.23 43.54 42.61 37.92
DRS≥3 55.02 56.82 50.98 51.49 50.13 52.88
Pvalue *** *** *** *** NS ***
Total 40.07 43.29 39.97 46.51 46.98 *** 42.43
Neuroleptic
CPS < 3 13.68 18.52 14.48 21.50 25.00 15.51
CPS≥3 20.18 23.95 10.00 30.04 43.71 31.11
Pvalue NS ** NS *** ** ***
Total 14.02 20.09 14.47 28.55 41.24 *** 20.12
Neuropsychiatrist
DRS < 3, CPS < 3 15.20 21.71 19.11 22.14 37.93 18.85
DRS < 3, CPS≥3 25.86 33.72 16.67 26.56 31.76 28.53
DRS≥3, CPS < 3 16.17 20.00 19.76 25.68 29.51 19.52
DRS≥3, CPS≥3 34.69 28.91 33.33 28.59 27.25 28.54
Pvalue *** *** – NS NS ***
Total 16.24 24.25 19.24 26.64 29.6 *** 21.82
Psychiatrist
DRS < 3, CPS < 3 3.95 3.67 1.79 1.15 0 2.59
DRS < 3, CPS≥3 10.34 4.99 0 2.41 4.71 3.44
DRS≥3, CPS < 3 11.60 9.14 4.71 3.38 3.28 7.50
DRS≥3, CPS≥3 12.24 9.95 0 5.11 5.09 6.13
Pvalue – *** – – – ***
Total 6.46 5.73 2.37 3.17 4.57 *** 4.05
Day care center
CPS < 3 0.20 1.28 1.80 5.80 3.26 1.53
CPS≥3 0 2.62 0 8.27 10.10 7.32
Pvalue – NS – NS NS ***
Total 0.19 1.67 1.80 7.84 9.20 *** 3.24
Is it possible to identify the need for long-term care? Can this lead to a meaningful stratification of frail older people and a clear definition of a control group?
The stratification of the study population is often pre-sented in the literature as a crucial process in order to test the effectiveness of interventions and their adapta-tion to the specific needs of people within groups [54]. The five disability profiles created in this study identify groups with specific long-term care needs [30].
A control group with similar characteristics in term of disability and predisposing and enabling factors was established. However, the groups studied differ in terms of healthcare utilization. The study sheds light on the difficulties involved in combining disability profiles and healthcare utilization to define the control group, in the actual context of available Belgian data.
To what extent does the utilization of long-term care match the need for long-term care?
Our results show that a database of healthcare reimburse-ments is not a good proxy for disability profiles (which
make possible the identification of needs for long-term care). Not only are these data not specific enough to dif-ferentiate between disability profiles, but people with simi-lar disability profiles do not necessarily utilize healthcare in similar ways.
A partial explanation of this difference could be the oc-currence of acute health problems versus a progressive de-terioration of health status. In our case, hospitalization within the 2 months before inclusion in the cohort has been used as a proxy for deterioration of health. This de-terioration could mainly result either from acute problems for which the patient was being hospitalized [55] or from
[image:11.595.56.540.99.421.2]“iatrogenic disability”, defined as “the avoidable depend-ency which often occurs during the course of care” [56]. The disability profile of older people without recent hospitalization was considered to be the consequence of a progressive deterioration and not the result of a recent acute problem. For people with such a profile, differences between the intervention and control groups could be viewed as underutilization of the healthcare system or as mismanagement of people’s health problems.
Table 5Global or acute IMA proxies by disability profile and level of ADL and CPS impairment
Low limit. IADL (cogn.) Func. Func., cogn. Func., cogn., behav. Pvalue Total
Geriatrician
ADL < 3, CPS < 3 4.52 6.88 3.74 13.33 2.78 5.08
ADL < 3, CPS≥3 13.33 13.56 0 13.65 16.88 14.05
ADL≥3, CPS < 3 8.62 0 3.95 4.76 5.36 4.16
ADL≥3, CPS≥3 0 25 30 7.32 9.46 7.88
Pvalue – – – – – ***
Total 5.07 8.83 3.96 7.59 10.49 *** 6.24
Neurologist
ADL < 3, CPS < 3 8.01 11.36 11.23 6.67 2.78 9.81
ADL < 3, CPS≥3 20.95 20.42 0 18.88 33.12 22
ADL≥3, CPS < 3 12.07 0 9.71 12.28 16.07 10.18
ADL≥3, CPS≥3 0 0 10 17.71 23.42 18.77
Pvalue – – – – *** ***
Total 8.76 13.93 10.15 16.86 23.99 *** 12.89
General practitioner out-of-hours
Total 15.84 20.85 26.78 26.33 19.4 *** 23.08
Emergency department + hospitalization
Total 22.06 28.17 36.62 32.96 28.45 *** 31.04
Hospitalization
Total 40.62 48.01 61.86 54.88 44.97 *** 52.78
Multi-morbidity
Total 91.24 91.01 93.63 93.67 90.66 *** 92.53
Another explanation could be the social characteris-tics. Anderson’s socio-behavioral model of health service utilization proposes a series of predisposing factors alongside age and gender as social structure compo-nents, the health beliefs and a series of other enabling factors alongside the living arrangements of family car-eer as the community ressources, the organization of health and social care, the knowledge of the services, the autonomy in their utilization, the income, the supple-mentary health insurance,... These factors should be in-tegrated to the analysis to better understand the utilization and the need for health services [47]. How-ever, these variables are not available.
To obtain more accurate information on disability profiles and more generally on health status, Elec-tronic Health Records (EHR) may be of use in the fu-ture. However, in Belgium, these are not yet used by every practitioner and therefore they are not routinely available for scientific research [57]. The whole sys-tem is actually in development (EHR and pooling of information for population health and scientific stud-ies), in Belgium. It is nevertheless not expected to in-clude information collected by social worker. Indeed, in Belgium, due to a split decision-making power be-tween the federal authorities and the federated en-tities [46, 58] the organization and the funding of formal social services are separated from health care
services. These information are even though essential to better support frail older persons at home.
Is it possible to use routine databases of healthcare reimbursement to select controls with long-term care needs similar to those of the intervention groups?
If the objective is to assess the effectiveness of an inter-vention, the easiest way to evaluate it is to compare the intervention group to a control group with similar base-line characteristics (in our case, with similar long-term care needs) [59]. As discussed earlier, the baseline char-acteristics must include disability profiles and healthcare utilization. Indeed, a similar disability profile allows us to evaluate the impact of the intervention on the evolu-tion of clinical outcomes and on long-term care needs. On the other hand, similar baseline healthcare utilization facilitates the evaluation of the consequences of the in-terventions for how widely long-term care needs are met and for reducing the use of low-value healthcare ser-vices. Such a reduction can be interpreted as a decrease of the pressure on the healthcare system.
[image:12.595.59.538.99.364.2]As shown in this study, some proxies for healthcare utilization appeared to be associated with some disability profiles. However, this association was not clear enough to allow the determination of disability profiles from healthcare utilization. So, in our study, we were not lim-ited by the “technical” capacity to use variables in the
Table 6Comparison of history of healthcare utilization (from IMA proxies) between groups studied
Low limit. IADL (cogn.) Func. Func., cogn. Func., cogn., behav.
Functional IMA proxies
Personal nursing cre 0.25 [0.22/0.29] 0.33 [0.28/0.38] 0.21 [0.18/0.23] 0.31 [0.26/0.37] 0.3 [0.23/0.39]
Physical therapy 0.88 [0.71/1.12] 0.77 [0.64/0.93] 0.6 [0.55/0.66] 0.83 [0.74/0.94] 0.48 [0.34/0.62]
Parkinson’s medication 3.76 [2.57/5.9] 1.78 [1.3/2.41] 1.31 [1.12/1.54] 1.47 [1.2/1.78] 1 [0.66/1.5]
Incontinence lump sum 0.15 [0.09/0.23] 0.15 [0.1/0.2] 0.24 [0.21/0.27] 0.32 [0.28/0.37] 0.16 [0.11/0.22]
Cognitive, mood IMA proxies
Antidepressant 1.26 [1.1/1.44] 1 [0.88/1.17] 1.34 [1.22/1.49] 0.99 [0.88/1.11] 1.94 [1.52/2.47]
Neuroleptic 1.55 [1.26/1.9] 1.45 [1.21/1.75] 1.78 [1.53/2.06] 1.1 [0.97/1.26] 0.41 [0.31/0.53]
Neuropsychiatrist 3.56 [2.88/4.55] 2.82 [2.37/3.35] 3.19 [2.76/3.71] 4.89 [4.06/5.92] 28.69 [16.69/68.78]
Psychiatrist 0.83 [0.62/1.12] 4.5 [2.96/7.8] 2.93 [1.97/4.7] 1.68 [1.2/2.45] 3.07 [1.49/8.7]
Day care center -[−/−] 6.31 [2.57/39.3] 1.22 [0.87/1.75] 2.17 [1.69/2.9] 2.18 [1.24/4.19]
Global IMA proxies
Geriatrician 3.41 [2.42/5] 2.63 [2.02/3.49] 1.21 [0.95/1.52] 1.51 [1.19/1.93] 17.94 [8.54/81.03]
Neurologist 3.16 [2.47/4.21] 3.39 [2.64/4.47] 1.65 [1.38/1.99] 3.72 [2.98/4.65] 8.65 [5.54/17]
Hospitalization 1.39 [1.15/1.71] 2.46 [1.98/3.07] 2.21 [1.95/2.5] 2.24 [1.92/2.59] 4.13 [2.81/6.29]
Acute IMA proxies
General prctitioner out-of-hours 3.44 [2.84/4.27] 2.64 [2.24/3.12] 3.98 [3.58/4.49] 2.86 [2.49/3.31] 3.11 [2.41/4.28]
Emergency department + hospitalization 2.92 [2.54/3.41] 1.85 [1.62/2.14] 2.77 [2.51/3.04] 3.01 [2.68/3.41] 2.43 [1.89/3.18]
control group (indeed, the propensity score method does not limit the number of control variables [60]). The limi-tations of this study are related to the availability of indi-vidually measured variables in the control group.
There were two difficulties related to the scarcity of the variables required to create an “ideal” control group. First, people in the intervention group were recruited through different entry points, including at discharge from hospital, from the waiting lists of the nursing homes, and from other sources. People in the control group were recruited from among those re-ceiving nursing care at home, for organizational rea-sons. The different recruitment points constituted an important potential for a selection bias. However, they make it possible to appreciate the importance of inte-grating healthcare utilization into the discussion about unmet long-term care needs. Second, the number of controls was considerably smaller than the number in the intervention group, due to resource constraints. The method of one-by-one matching of the nearest neighbors with replacement that was used in this study accounted for the replication of certain con-trols. Other statistical approaches were considered, in-cluding bootstrapping on the matching or changing
the ratio of Protocol 3beneficiaries to controls. How-ever, these alternatives did not entirely resolve the scarcity of some profiles within the control group. The best solution would have been to include more controls from diverse entry points, which would have demanded considerable time and financial resources. Another option would be to exclusively use more di-verse routine data (such data is either not yet avail-able in Belgium or else links cannot yet be made between such data) to establish the control group. In-deed, routine data are recognized as the best tool for evaluating large-scale interventions. They are recom-mended in comparative effectiveness studies [61], as they are available for the whole population. The use of routine data also makes it possible to study real-world effective-ness [62, 63] and helps in policy- and decision-making, both through prediction of future needs and comparison with other public programs [64].
In Belgium, routine data provides information on re-imbursed healthcare consumption, including healthcare utilization and proxies for comorbidities, but not disabil-ity profiles. These data can therefore help track the utilization of healthcare services over time, but they give no idea of long-term care needs and the coverage of
[image:13.595.58.538.86.406.2]those needs. Nevertheless, Belgium is trying to reorgan-ize its health system and hopes to draw on the expertise gained from Protocol 3 projects to take a step forward in the implementation of projects designed to provide integrated care for people with chronic health problems [58]. These integrated care projects should involve a comprehensive reorganization of healthcare and social services, as well as the pooling of resources and pol-icy adjustments. Such projects can only be successful if, at the same time, appropriate tools for data sharing are developed. These tools may be used for assessing the needs of patients and for evaluating healthcare utilization (by using population data). Clinical scales may help to better characterize disability profiles.
Conclusions
This paper raised three key questions that need to be ad-dressed in order to understand the relationship between individual disability status, patterns of use of healthcare services, and the effectiveness of interventions. To ex-plore the first question, we discussed an approach to stratifying and establishing a control group for the as-sessment of the effectiveness of interventions targeting frail older people at home. As a consequence, and in re-sponse to the second question, this study sheds more light on the association between disability profiles and healthcare utilization. Finally, and in relation to our third question, this study encourages both researchers and policy-makers to reflect on the best trade-off be-tween using large databases with a limited number of available variables (such as healthcare utilization data without disability variables) and a relatively small sample with a sufficient number of variables (disability variables) specifically collected in an observational comparative ef-fectiveness study. These results therefore represent an important contribution to future designs of comparative effectiveness studies. This contribution is all the more relevant at a time when important transformations in electronic records on health and healthcare use and resulting databases are under scrutiny in Belgium and other European countries. Our findings should definitely pave the way for better use of new routine databases to evaluate interventions.
Additional file
Additional file 1:Socio-demographic characteristics of the groups studies by disability profile. (DOCX 25 kb)
Abbreviations
ABS:Aggressive Behavior Scale; ADL: Activities of daily life; CPS: Cognitive performance scale; DRS: Depression rating scale; EHR: Electronic Health Records; FC: Family carer; Func: Functional; Func., cogn.: Functional & cognitive; Func., cogn., behav.: Functional, cognitive & behavioural problems; GMVR: Geometric Mean Variance Ratio; GP: General practitioners; IADL
(cogn.): IADL and low level of cognitive impairment; IADL: Instrumental activities of daily life; IMA: Inter-mutuality Agency; Low limit.: Low-level limitations; NIHDI: National Insurance for Health and Disability Institute; PCA: Principal Component Analysis; SMD: Average Standardised Mean Difference; smd: Standardised mean difference; Vic loop: Vicious loop; Vir loop: Virtuous loop; VR: Variance ratio; WHO: World Health Organization
Acknowledgements
We are grateful to the Protocol 3 project workers for their participation in the scientific evaluation; to the National Institute of Health and Disability Insurance for their support and their interest in finding alternatives to institutionalization; to the Protocol 3 scientific team members including Johanna De Almeida Mello, Sibyl Anthierens, Maja Lopez-Hartmann, and Roy Remmen for their involvement in this evaluation and their advice.
Authors’contributions
ASL, SC, TVD, AD, and JM designed and coordinated the study. ASL and SC did the data collection and management. ASL performed the statistical analyses. ASL, JM, and EBM drafted the manuscript. All authors reviewed and approved the final report.
Funding
This study is part of a scientific evaluation of alternative care interventions, called“Protocol 3”, which aims to prevent the risk of institutionalization while maintaining a satisfactory quality of life. Both the interventions and the scientific evaluation were financed by the National Institute of Health and Disability Insurance (NIHDI).
Availability of data and materials
The datasets generated and/or analyzed during the current study are not publicly available due to recommendations made by the Belgian privacy commission. However, any person can apply for access to the data through the Belgian privacy commission.
Ethics approval and consent to participate
This study was approved by the Belgian Privacy Commission and by the Ethics committees of both the Université Catholique de Louvain and the Katholieke Universiteit Leuven under the dossier number B40320108337. All study participants provided informed consent prior to participating in the study.
Consent for publication
Not applicable.
Competing interests
The authors declare that they have no competing interests.
Author details
1
Institute of Health and Society (IRSS), Université Catholique de Louvain, Clos chapelle aux champs 30 /B1.30.15.05, 1200 Brussels, Belgium.2Ecole Régionale de Santé Publique (ERSP), Faculty of Medicine, Université Catholique de Bukavu, Bukavu, Democratic Republic of Congo.3LUCAS and Center for Sociological Research, KU Leuven, Leuven, Belgium.
Received: 4 April 2018 Accepted: 10 June 2019
References
1. Fried LP, Tangen CM, Walston J, Newman AB, Hirsch C, Gottdiener J, Seeman T, Tracy R, Kop WJ, Burke G. Frailty in older adults: evidence for a phenotype. J Gerontol Ser A Biol Med Sci. 2001;56(3):M146–57.
2. Zaslavsky O, Cochrane BB, Thompson HJ, Woods NF, Herting JR, LaCroix A. Frailty: a review of the first decade of research. Biol Res Nurs. 2013; 15(4):422–32.
3. Bahler C, Huber CA, Brungger B, Reich O. Multimorbidity, health care utilization and costs in an elderly community-dwelling population: a claims data based observational study. BMC Health Serv Res. 2015;15:23. 4. Organization WH. International classification of functioning, disability and
5. Fried LP, Ferrucci L, Darer J, Williamson JD, Anderson G. Untangling the concepts of disability, frailty, and comorbidity: implications for improved targeting and care. J Gerontol Ser A Biol Med Sci. 2004;59(3):M255–63. 6. Mehta KM, Yaffe K, Covinsky KE. Cognitive impairment, depressive
symptoms, and functional decline in older people. J Am Geriatr Soc. 2002; 50(6):1045–50.
7. Salvador-Carulla L, Gasca VI. Defining disability, functioning, autonomy and dependency in person-centered medicine and integrated care. Int J Integr Care. 2010;10(5):e025.
8. Hoeck S, Francois G, Geerts J, Van der Heyden J, Vandewoude M, Van Hal G. Health-care and home-care utilization among frail elderly persons in Belgium. Eur J Pub Health. 2012;22(5):671–7.
9. Koller D, Schön G, Schäfer I, Glaeske G, van den Bussche H, Hansen H. Multimorbidity and long-term care dependency—a five-year follow-up. BMC Geriatr. 2014;14(1):70.
10. Melzer D, McWilliams B, Brayne C, Johnson T, Bond J. Profile of disability in elderly people: estimates from a longitudinal population study. BMJ (Clinical research ed). 1999;318(7191):1108–11.
11. de Meijer CA, Koopmanschap MA, Koolman XH, van Doorslaer EK. The role of disability in explaining long-term care utilization. Med Care. 2009;47(11): 1156–63.
12. Wammes JJG, van den Akker-van ME, Verkerk EW, van Dulmen SA, Westert GP, van Asselt AD, Kool R. Identifying and prioritizing lower value services from Dutch specialist guidelines and a comparison with the UK do-not-do list. BMC Med. 2016;14(1):196.
13. Vandresse M. Perspectives démographiques 2016–2060 population, ménages et quotients de mortalité prospectifs. Brussels: Bureau du plan; 2017. 14. Van den Bosch K, Willemé P, Geerts J, Breda J, Peeters S, Van de Sande S,
Vrijens F, Van de Voorde C, Stordeur S. Soins résidentiels pour les personnes âgées en Belgique: projections 2011–2025. In: Reports K, editor. Health services research. Brussels: Centre fédéral d’expertise des soins de santé (KCE); 2011. 15. Mello JDA, Van Durme T, Macq J, Declercq A. Interventions to delay
institutionalization of frail older persons: design of a longitudinal study in the home care setting. BMC Public Health. 2012;12(1):615.
16. Van Durme T, Schmitz O, Cès S, Anthierens S, Maggi P, Delye S, Mello JDA, Declercq A, Macq J, Remmen R. A comprehensive grid to evaluate case management’s expected effectiveness for community-dwelling frail older people: results from a multiple, embedded case study. BMC Geriatr. 2015;15(1):67.
17. Cès S, Van Durme T, Schmitz O, Macq J, Maggi P, Delye S, Gosset C, De Almeida Mello J, Declercq A, Lopez Hartmann M. Scientific evaluation of projects of alternative forms of care or support of care for frail elderly, in order to allow them to maintain their autonomy and to live independently in their homes“Protocol 3”. Brussels: National Insurance for Health and Disability Institute; 2014.
18. Rolfson DB, Majumdar SR, Tsuyuki RT, Tahir A, Rockwood K. Validity and reliability of the Edmonton frail scale. Age Ageing. 2006;35(5):526–9. 19. De Lepeleire J, Iliffe S, Mann E, Degryse JM. Frailty: an emerging concept for
general practice. Br J Gen Pract. 2009;59(562):e177–82.
20. Mello JDA, Hermans K, Van Audenhove C, Macq J, Declercq A. Evaluations of home care interventions for frail older persons using the interRAI home care instrument: a systematic review of the literature. J Am Med Dir Assoc. 2015;16(2):173. e171–3 e110.
21. Morris JN, Fries BE, Morris SA. Scaling ADLs within the MDS. J Gerontol Ser A. 1999;54(11):M546–53.
22. Morris JN, Carpenter I, Berg K, Jones RN. Outcome measures for use with home care clients. Can J Aging/La Revue canadienne du vieillissement. 2000;19(S2):87–105.
23. Morris JN, Fries BE, Mehr DR, Hawes C, Phillips C, Mor V, Lipsitz LA. MDS cognitive performance scale©. J Gerontol. 1994;49(4):M174–82. 24. Burrows AB, Morris JN, Simon SE, Hirdes JP, Phillips C. Development of a
minimum data set-based depression rating scale for use in nursing homes. Age Ageing. 2000;29(2):165–72.
25. Perlman CM, Hirdes JP. The aggressive behavior scale: a new scale to measure aggression based on the minimum data set. J Am Geriatr Soc. 2008;56(12):2298–303.
26. De Koker B. Socio-demographic determinants of informal caregiving: co-resident versus extra-co-resident care. Eur J Ageing. 2009;6(1):3–15. 27. O'Rourke N, Tuokko HA. Psychometric properties of an abridged version of
the Zarit burden interview within a representative Canadian caregiver sample. Gerontologist. 2003;43(1):121–7.
28. Nosikov A, Gudex C. EUROHIS: developing common instruments for health surveys; 2003.
29. Dilts D, Khamalah J, Plotkin A. Using cluster analysis for medical resource decision making. Med Decis Mak. 1995;15(4):333–46.
30. Lafortune L, Beland F, Bergman H, Ankri J. Health status transitions in community-living elderly with complex care needs: a latent class approach. BMC Geriatr. 2009;9:6.
31. Dubuc N, Hebert R, Desrosiers J, Buteau M, Trottier L. Disability-based classification system for older people in integrated long-term care services: the Iso-SMAF profiles. Arch Gerontol Geriatr. 2006;42(2):191–206. 32. Raiche M, Hebert R, Dubois MF, Gueye NR, Dubuc N. Yearly transitions of
disability profiles in older people living at home. Arch Gerontol Geriatr. 2012;55(2):399–405.
33. Fox P, Maslow K, Zhang X. Long-term care eligibility criteria for people with Alzheimer's disease. Health Care Financ Rev. 1999;20(4):67.
34. Brodaty H, Thomson C, Thompson C, Fine M. Why caregivers of people with dementia and memory loss don't use services. Int J Geriatr Psychiatry. 2005; 20(6):537–46.
35. van der Lee J, Bakker TJ, Duivenvoorden HJ, Droes RM. Multivariate models of subjective caregiver burden in dementia: a systematic review. Ageing Res Rev. 2014;15:76–93.
36. Hastie T, Tibshirani R, Friedman J. Unsupervised learning. In: The elements of statistical learning data mining, inference, and prediction. 2nd ed. Edited by Springer; 2009. p. 485–586.
37. Le S, Josse J, Husson F. FactoMineR: an R package for multivariate analysis. J Stat Softw. 2008;25(1):1–18.
38. Bootstrapping regression models. Appendix to an R and S-PLUS companion to applied regression.https://socialsciences.mcmaster.ca/jfox/Books/ Companion-1E/appendix-bootstrapping.pdf. Accessed 14 June 2019. 39. Litwin H, Attias-Donfut C. The inter-relationship between formal and
informal care: a study in France and Israel. Ageing Soc. 2009;29(1):71–91. 40. Sekhon JS. Multivariate and propensity score matching software with
automated balance optimization: the matching package for R. J Stat Softw. 2011;42(7):1-52.https://www.jstatsoft.org/article/view/v042i07. Accessed 14 June 2019.
41. Linden A, Samuels SJ. Using balance statistics to determine the optimal number of controls in matching studies. J Eval Clin Pract. 2013;19(5):968–75. 42. Rubin DB. Using propensity scores to help design observational studies:
application to the tobacco litigation. Health Serv Outcomes Res Methodol. 2001;2(3):169–88.
43. Luppa M, Luck T, Weyerer S, König H-H, Brähler E, Riedel-Heller SG. Prediction of institutionalization in the elderly. A systematic review. Age Ageing. 2009;39(1):31–8.
44. Huber CA, Szucs TD, Rapold R, Reich O. Identifying patients with chronic conditions using pharmacy data in Switzerland: an updated mapping approach to the classification of medications. BMC Public Health. 2013;13(1):1030.
45. Canty A, Ripley B. Package‘boot’; 2017.
46. Gerkens S, Merkur S. Health systems in transition: Belgium. Copenhagen: Health System Review; 2010.
47. Andersen RM. Revisiting the behavioral model and access to medical care: does it matter? J Health Soc Behav. 1995;36(1):1-10.
48. de Meijer C, Koopmanschap M, TB DU, van Doorslaer E. Determinants of long-term care spending: age, time to death or disability? J Health Econ. 2011;30(2):425–38.
49. Bonsang E. Does informal care from children to their elderly parents substitute for formal care in Europe? J Health Econ. 2009;28(1):143–54. 50. Ionescu-Ittu R, McCusker J, Ciampi A, Vadeboncoeur AM, Roberge D,
Larouche D, Verdon J, Pineault R. Continuity of primary care and emergency department utilization among elderly people. CMAJ. 2007;177(11):1362–8. 51. Gruneir A, Silver MJ, Rochon PA. Emergency department use by older
adults: a literature review on trends, appropriateness, and consequences of unmet health care needs. Med Care Res Rev. 2011;68(2):131–55. 52. Carter MW, Datti B, Winters JM. ED visits by older adults for ambulatory
care-sensitive and supply-care-sensitive conditions. Am J Emerg Med. 2006;24(4):428–34. 53. McCusker J. Determinants of emergency department visits by older adults: a
systematic review. Acad Emerg Med. 2003;10(12):1362–70.
55. Di Pollina L, Guessous I, Petoud V, Combescure C, Buchs B, Schaller P, Kossovsky M, Gaspoz J-M. Integrated care at home reduces unnecessary hospitalizations of community-dwelling frail older adults: a prospective controlled trial. BMC Geriatr. 2017;17(1):53.
56. Lafont C, Gérard S, Voisin T, Pahor M, Vellas B. Reducing“iatrogenic disability”in the hospitalized frail elderly. J Nutr Health Aging. 2011; 15(8):645–60.
57. Truyers C, Goderis G, Dewitte H, Akker M, Buntinx F. The Intego database: background, methods and basic results of a Flemish general practice-based continuous morbidity registration project. BMC Med Inform Decis Mak. 2014;14:48.
58. Paulus D, Van den Heede K, Gerkens S, Desomer A, Mertens R. Development of a national position paper for chronic care: example of Belgium. Health Policy. 2013;111(2):105–9.
59. Habicht J-P, Victora C, Vaughan JP. Evaluation designs for adequacy, plausibility and probability of public health programme performance and impact. Int J Epidemiol. 1999;28(1):10–8.
60. Caliendo M, Kopeinig S. Some practical guidance for the implementation of propensity score matching. J Econ Surv. 2008;22(1):31–72.
61. Cox E, Martin BC, Van Staa T, Garbe E, Siebert U, Johnson ML. Good research practices for comparative effectiveness research: approaches to mitigate bias and confounding in the design of nonrandomized studies of treatment effects using secondary data sources: the International Society for Pharmacoeconomics and Outcomes Research Good Research Practices for retrospective database analysis task force report—part II. Value Health. 2009; 12(8):1053–61.
62. Schneeweiss S. Developments in post-marketing comparative effectiveness research. Clin Pharmacol Ther. 2007;82(2):143–56.
63. Schneeweiss S, Avorn J. A review of uses of health care utilization databases for epidemiologic research on therapeutics. J Clin Epidemiol. 2005;58(4):323–37.
64. Morrato EH, Elias M, Gericke CA. Using population-based routine data for evidence-based health policy decisions: lessons from three examples of setting and evaluating national health policy in Australia, the UK and the USA. J Public Health. 2007;29(4):463–71.
Publisher’s Note