R E S E A R C H A R T I C L E
Open Access
Analysis of the microRNA transcriptome and
expression of different isomiRs in human
peripheral blood mononuclear cells
Candida Vaz
1, Hafiz M Ahmad
2, Richa Bharti
1, Priyatama Pandey
1, Lalit Kumar
4, Ritu Kulshreshtha
3and Alok Bhattacharya
1,2*Abstract
Background:MicroRNAs (miRNAs) have been recognized as one of the key regulatory non-coding RNAs that are involved in a number of basic cellular processes. miRNA expression profiling helps to identify miRNAs that could serve as biomarkers. Next generation sequencing (NGS) platforms provide the most effective way of miRNA
profiling, particularly as expression of different isoforms of miRNA (IsomiRs) can be estimated by NGS. Therefore, it is now possible to discern the overall complexity of miRNA populations that participate in gene regulatory networks. It is thus important to consider different isoforms of miRNA as part of total profiling in order to understand all aspects of the biology of miRNAs.
Results:Here next generation sequencing data of small RNAs derived from normal peripheral blood mononuclear cells (PBMC) and Chronic myeloid leukemia (CML) patients has been used to generate miRNA profiles using a computation pipeline which can identify isomiRs that are natural variants of mature miRNAs. IsomiR profiles have been generated for all the 5p and 3p miRNAs (previously known as major mature miRNA and minor or miRNA*) and the data has been presented as a composite total miRNA transcriptome. The results indicated that the most abundant isomiR sequence of about 68% miRNAs, did not match the reference miRNA sequence as entered in the miRBase and that there is a definite pattern in relative concentration of different isomiRs derived from same precursors. Finally, a total of 17 potential novel miRNA sequences were identified suggesting that there are still some new miRNAs yet to be discovered.
Conclusions:Inclusion of different isoforms provides a detailed miRnome of a cell type or tissues. Availability of miRnome will be useful for finding biomarkers of different cell types and disease states. Our results also indicate that the relative expression levels of different isoforms of a miRNA are likely to be dynamic and may change with respect to changes in the cell or differentiation status.
Keywords:MicroRNA, Next generation sequencing, Normalization, IsomiR, miRnome, Peripheral blood mononuclear cells (PBMC), Chronic myeloid leukemia (CML)
* Correspondence:[email protected]
1School of Computational and Integrative Sciences, Jawaharlal Nehru University, New Delhi 110067, India
2School of Life Sciences Jawaharlal Nehru University, New Delhi 110067, India Full list of author information is available at the end of the article
Background
MicroRNAs (miRNA) are a major class of small non-coding RNAs of about 22 nucleotides that are involved in various cellular functions. miRNAs are transcribed as pri-miRNAs which are processed into pre-miRNAs by an RNase III enzyme, Drosha. Pre-miRNAs are exported to cytoplasm and processed by another RNAse III en-zyme, Dicer to give rise to mature miRNAs. These two enzymes are important not only for processing of inter-mediates to mature miRNAs but also for introducing variations in miRNAs [1-3].
Several reports have established miRNAs as important post transcriptional regulators of gene expression through different mechanisms, such as translational re-pression and destabilization and cleavage of the target mRNA. The processes are initiated by binding of the miRNA to partially complementary sites at the 3′UTR of the target mRNA in animals and completely comple-mentary sites in plants [4,5]. A single miRNA can bind to several target mRNAs and similarly a multitude of them can bind a single target [6]. Recent estimates sug-gest that a substantial fraction (up to 60%) of higher eukaryotic mRNAs is regulated by these small non cod-ing RNAs [7]. Therefore, miRNAs and mRNAs are part of intricate networks that regulate gene expression and cellular decision making [8,9]. The existence of miRNA clusters and families also add to the intricacies of miRNA regulation [10]. In order to understand these networks, knowledge of complete miRNA expression profiles is necessary. Expression profiles can also be helpful in identifying tissue, stage and disease-specific patterns. miRNAs have also been shown to be involved in cancer and tumorigenesis [11-13]. It is generally be-lieved that some of the miRNAs can be useful diagnostic and prognostic markers of different cancers with appli-cations in patient care and therapy [14].
A number of approaches, such as northern blotting, RNase protection assay, PCR, microarrays and RAKE assay have been used for expression profiling of miRNAs [15-20]. In general these methods are either cumber-some for scaling up and/or not sensitive enough to de-tect low levels. miRNAs are expressed at different levels, spanning more than five orders of magnitude and major-ity of methods are not suitable to get accurate expres-sion profiles. Microarrays have problems associated with cross hybridization and creating a single hybridization condition suitable for all miRNAs [20]. Most of these methods could detect only pre-miRNAs owing to the technical difficulty caused by short length of mature-miRNAs. Next generation sequencing (NGS) has pro-vided an edge over other methods in generating, not just an in depth knowledge of known miRNA expression, but also helped in identifying tissue-specific, and rarely expressed miRNAs [21-25]. NGS approach has also been
successful in new miRNA discovery leading to exponen-tial increase in miRBase entries in the last few years (Release 19) [26,27]. Moreover, analysis of small RNA (sRNA) sequencing data derived using NGS platforms has helped to identify alternate processing products of biogenesis. It is clear from some of the preliminary ana-lysis that these alternate processing products are bio-logically relevant and can have functional role probably by binding different Argonaute proteins [24,25,28,29]. The previously known as minor or “miR*” sequences were found to be expressed higher than the major coun-terparts raising the need for a change in the annotation. Therefore, the annotation of miRNAs as-5p/-3p rather than mature and star is now used by the latest miRBase Release 19.
In this report, a detailed analysis on human PBMC miRnome has been described. Our analysis involves dif-ferent processing products that include isomiRs of both miR-5p and miR-3p thus forming a composite miRNA transcriptome. We have generated the reference miRNA profile comprising of the miRNAs in miRBase as well as the abundant isomiR profile using our NGS data. On comparing the reference miRNA and the abundant isomiR profiles we found that the abundant isomiRs dif-fer in difdif-ferent cells suggesting that miRNA profiling must include all the variants for developing biological markers in different diseases.
A few potential novel miRNAs have also been detected during our analysis [30]. Our report highlights intricacies in miRNA biogenesis machinery that can be used as a signature of physiological state of cells.
Results
Annotation and apportionment
sRNA datasets comprising of two Normal PBMCs and two CML patients were pre-processed as described in
human genome and those that matched were extended and used for novel miRNA prediction [30-32].
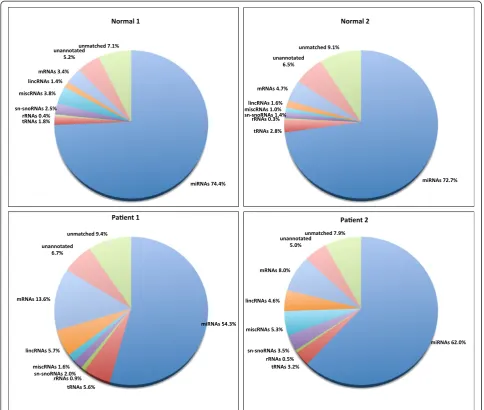
Results from the annotation pipeline (Figure 2) showed that miRNAs were the most abundant small RNA species [74% in Normal1, 73% in Normal2, 54% in Patient1 and 62% in Patient2]. Overall the total fraction of miRNAs in the population was relatively less in the Patient samples as compared to that of the Normal samples. The reads de-rived from other non-coding sRNAs, such as sn/sno RNAs, lincRNAs and miscellaneous RNAs were 1–3%, 1–6% and 1–5% respectively. The reads derived from lar-ger RNA categories, such as the tRNAs were 2–6% and
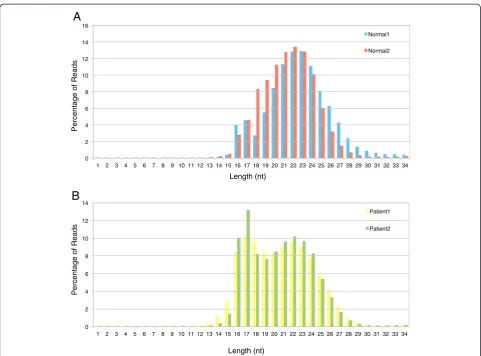
the rRNAs were about 1%. The mRNAs were around 3–5% in the Normals suggesting that degradation was minimal in the Normal samples. However the fraction of mRNAs were slightly higher in Patient samples (8–14%) indicating more degradation in the Patient samples due to cell death and necrosis. This is also evident from the length distribution of the reads (Figure 1).
Reads that matched to the human genome but not with any known RNA species (unannotated reads) were 5–7%. These were taken for novel miRNA prediction. Lastly, the total unmatched pool that failed to match with the human genome was around 7–9% (Figure 2).
A
B
0 2 4 6 8 10 12 14 161 2 3 4 5 6 7 8 9 10 11 12 13 14 15 16 17 18 19 20 21 22 23 24 25 26 27 28 29 30 31 32 33 34
Percentage of Reads
Length (nt)
Normal1
Normal2
0 2 4 6 8 10 12 14
1 2 3 4 5 6 7 8 9 10 11 12 13 14 15 16 17 18 19 20 21 22 23 24 25 26 27 28 29 30 31 32 33 34
Percentage of Reads
Length (nt)
Patient1
[image:3.595.57.539.86.442.2]Patient2
Figure 1Analysis of lengths of the reads from the four samples to determine the optimal cut-off read length. A. Frequency distribution of lengths of the reads from the two Normal samples.B. Frequency distribution of lengths of the reads from the two Patient samples.
Table 1 Details of the samples
Sample Total number of reads Total number of reads (> = 14nt)
Normal1 11,518,605 11,490,402
Normal2 10,878,898 10,855,039
Patient1 10,701,151 10,637,119
[image:3.595.56.542.664.733.2]Reference miRNA identification
In general, the stem part of the precursor sequences is processed with Dicer enzyme to give rise to mature miRNAs. Previously, one of the arms was considered to form the mature miRNA whereas the other formed the minor or the star sequence. The expression levels deter-mined the major/minor nomenclature. Recently, several reports have shown that this nomenclature could vary with the tissue and experimental conditions causing the change in the nomenclature. These are now referred to as miR-5p and miR-3p depending on their location in the precursor sequence. The miRBase [26,27] is a reposi-tory of miRNAs, and the mature form of miRNAs in miRBase is referred here as the reference miRNAs. The
expression profiles of these reference miRNAs were obtained by identifying the reads from our NGS samples that showed an exact match with them.
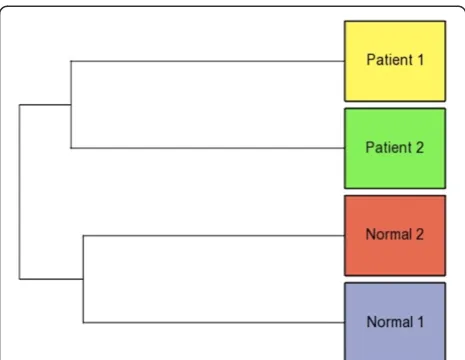
[image:4.595.56.541.89.499.2]The expression profile of these reference miRNAs was called theReference miRNA expression profile(Additional file 1). Furthermore, the similarity and the differences between the samples and within each group, was deter-mined using the Reference miRNA expression profile. The Hierarchical clustering plot computed using the Reference miRNA expression profile, showed that the Normal1 and Normal2 samples were closer to each other forming one group. Similarly, the Patient1 and Patient2 samples were closer to each other forming an-other group (Figure 3).
IsomiR identification and examination
miRNAs are also known to have alternative forms called
“isomiRs”, that differ from each other by a few nucleo-tides at the ends. These are thought to be generated by alternate Dicer cutting [23]. Identification of isomiR family has been discussed in the “Methods” section. Briefly, sequencing reads of each sample were aligned to the human pre-miRNAs to obtain an isomiR family for each mature miRNA (−5p/−3p). The Additional file 2 shows an example of a hsa-let-7b isomiR family with their respective frequency or expression values. Quite often only one of these isomiRs displays dominant ex-pression, that is, has highest number of reads among all the other isomiRs. This dominant isomiR is considered to be the active or mature form of miRNAs.
We generated the isomiR expression profiles of all miRNAs and determined the dominant isomiR for each expressed miRNA based on the highest frequency. The Additional file 3 lists the most abundant isomiR for every expressed mature miRNA (Abundant isomiR ex-pression profile).
The clustering of the samples was once again checked using the Abundant IsomiR expression profile. The Hierarchical clustering plot computed using the Abun-dant IsomiR expression profile gave results similar to that obtained using the Reference miRNA expression profile. The Normal1 and Normal2 samples were closer to each other forming one group. Similarly, Patient1 and Patient2 samples were closer to each other forming an-other group (Figure 3).
We then answered the question whether the most abundant isomiR was the same as the reference miRNA by comparing the Reference and the Abundant isomiR expression profiles. If the most abundant isoform of a miRNA was not the reference miRNA, it was reported as“NO”, whereas if the abundant one matched the refer-ence miRNA it was reported as “YES”. The Additional file 4 lists this comparison.
Analysis of the“YES”or“NO”data revealed some inter-esting facts (Table 2). We focused on a total of 608 miRNAs that were expressed in both the Normal samples and displayed uniformity in being either YES/NO among them. For the rest of 1434 miRNAs in Normals either the expression levels were low, below the detection limit (1289) or were non uniform (145). Out of 608 miRNAs analyzed, the reference miRNA sequence of only 204 miRNAs matched with the most abundant isomiR (YES cases), while for 404 miRNAs, the reference sequence did not match the most abundant isomiR (NO cases) (Table 2).
The same was seen for the patients; around 619 miRNAs were expressed and displayed uniformity in being YES/NO among both the Patient samples. The remaining 1423 miRNAs had either a low expression (1293) or were non uniform (130). Out of the 619 miRNAs analysed, the refer-ence miRNA sequrefer-ences of only 190 miRNAs matched with the most abundant isomiR (YES cases), while for 429 miRNAs, the reference sequence did not match the most abundant isomiR (NO cases) (Table 2).
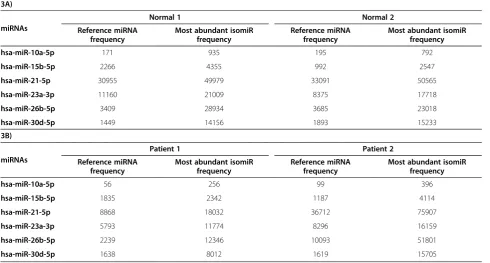
The latter category (NO category) included some of the miRNAs that are known to be involved in cancer biology, such as let-7b-3p, let-7d-5p, let-7 g-3p, 10a-5p, 15b-5p, 16-1-3p, 16-2-3p, 21-5p, 21-3p, 23a-3p, 23b-3p, 26b-5p, 26b-3p, 30d-5p. A few examples of such miRNAs for the Normals and Patients are shown in Table 3A,B respectively. Therefore a mature miRNA is not always the same sequence or isoform and appears to vary though the precursor sequence remains the same.
Expression profile comparison
Reference miRNA expression profile
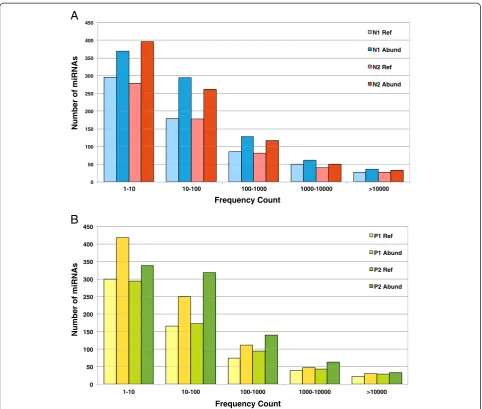
[image:5.595.57.290.87.267.2]Expression of 620 miRNAs (on an average) including about 70–90 singletons were observed in each sample. The level of expression of the miRNAs was found to be
[image:5.595.303.539.643.724.2]Figure 3Hierarchical clustering plot showing the similarity and differences between the samples.The Normal samples (1 and 2) and the Patient samples (1 and 2) cluster into two separate groups. The plot shows the proximity of the two Normals and the two Patients to each other, and the distance between the Normal group and the Patient group on the whole. Clustering plots were generated using both: the Reference miRNAs expression profile and the Abundant IsomiR expression profile.
Table 2 Comparison of the reference and abundant IsomiR expression profiles
Comparison details Normal samples
Patient samples Reference miRNAs that matched the most
abundant isomiRs (YES cases)
204 190
Reference miRNAs that did not match most abundant isomiRs (NO cases)
404 429
MiRNAs not considered 1434 1423
variable (Additional file 1) showing a wide range of values spanning five orders of magnitude in Normals (Figure 4A) and Patients (Figure 4B). The highly expressed miRNAs (>10,000 frequency count) detected by using this profile were the let-7 family followed by hsa-miR-103a-3p, 148a-3p, 16-5p, 185-5p, 191-5p, 192-5p, 223-3p, 24-3p, 25-3p, 26a-5p, 29a-3p, 3184-3p, 320a, 423-5p and 92a-3p similar to what has been seen before [24].
Abundant IsomiR expression profile
On an average about 875 miRNAs including about 20–55 singletons were expressed in each sample. Around 255 more miRNAs were found using this abun-dant isomiR profile that was missed out in the Reference miRNA profile owing to the absence of the reference se-quence for these miRNAs.
The level of expression of the miRNAs was found to be variable just like the reference miRNA (Additional file 3) profiles but of a higher level owing to more number of miRNAs detected by using this profile in Normals (Figure 4A) and Patients (Figure 4B). On using this profile we got a bigger list of highly expressed miRNAs (>10,000 frequency count). This included miRNAs found to be highly expressed using the reference miRNA profile as well as comprised of a few more miRNAs that failed to be picked out as highly expressed on using the reference miRNA profile owing to the presence of another isomiR sequence that had a higher frequency than the reference
sequence. Some of these miRNAs were: hsa-miR-107, 140-3p, 21-5p, 23a-3p, 26b-5p, 3074-5p, 378a-3p.
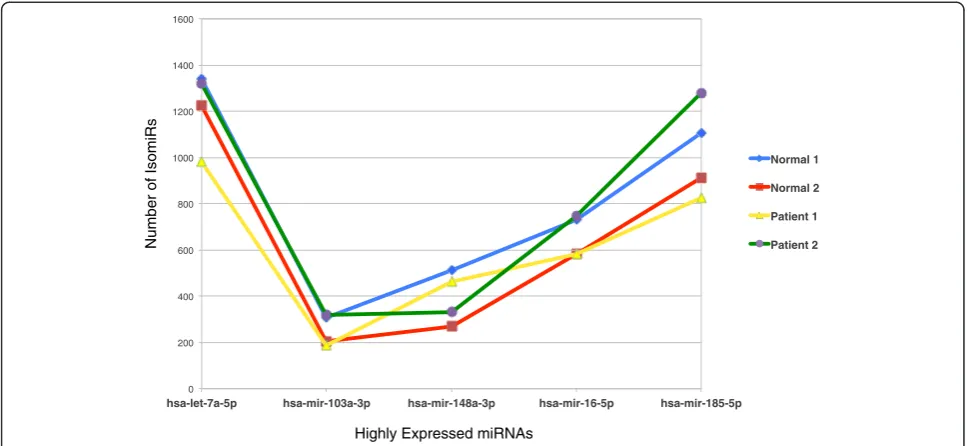
Interestingly, highly expressed miRNAs display more isomiRs as compared to those miRNAs that are expressed at a lower level. Figure 5 shows the distribution of number of IsomiRs of a few selected highly expressed miRNAs among the four samples. The distribution patterns appeared to be similar among the four samples. Number of isomiRs of let-7a-5p was found to be highest followed by hsa-mir-185-5p, hsa-mir-16-5p, hsa-mir-148a-3p, hsa-mir-103a-3p (in descending order).
Novel miRNA identification
[image:6.595.56.547.114.377.2]The reads that did not match with the annotated se-quence databases and that mapped to intergenic and in-tronic regions of the human genome were checked to see if these were potential novel miRNAs. In this case only exact matches were considered for further analysis by extracting the matched region along with 70 nucleo-tides flanking on either side. The extracted sequences were folded and checked by prediction algorithms, such as CID-miRNA [31], CSHMM [32], miRDeep [33] and MiPred [34] for potential pre-miRNAs. The predictions were further analyzed using a set of filters for false posi-tives as described before [24]. This analysis led to detec-tion of 17 potential novel miRNAs which have been given unique names with the prefix “jnu-pat-hsa”. The sequence and the structures of two potential novel
Table 3 Few examples revealing differences in the expression profiles based on selection of the most abundant isomiR versus the reference miRNA
3A)
miRNAs
Normal 1 Normal 2
Reference miRNA frequency
Most abundant isomiR frequency
Reference miRNA frequency
Most abundant isomiR frequency
hsa-miR-10a-5p 171 935 195 792
hsa-miR-15b-5p 2266 4355 992 2547
hsa-miR-21-5p 30955 49979 33091 50565
hsa-miR-23a-3p 11160 21009 8375 17718
hsa-miR-26b-5p 3409 28934 3685 23018
hsa-miR-30d-5p 1449 14156 1893 15233
3B)
miRNAs
Patient 1 Patient 2
Reference miRNA frequency
Most abundant isomiR frequency
Reference miRNA frequency
Most abundant isomiR frequency
hsa-miR-10a-5p 56 256 99 396
hsa-miR-15b-5p 1835 2342 1187 4114
hsa-miR-21-5p 8868 18032 36712 75907
hsa-miR-23a-3p 5793 11774 8296 16159
hsa-miR-26b-5p 2239 12346 10093 51801
hsa-miR-30d-5p 1638 8012 1619 15705
miRNAs is shown in Figure 6. The details of all the 17 potential novel miRNAs, including their frequencies, isomiRs, prediction scores from the tools, the sequences of precursor and mature forms are given in Additional file 5. The structures of the precursors are given in Additional file 6.
Discussion and conclusions
The major goal of this study was to understand the complete miRNA transcriptome in the context of hu-man PBMCs obtained using deep sequencing of small RNA through custom designed computational tools. The expression of the reference mature miRNAs is com-monly considered to form the miRNA transcriptome.
Since NGS allows identification of isomiRs of miR-5p and miR-3p, it is important to include these processing variants as part of the complete miRNA transcriptome [23,27,28]. In our previous study we had profiled miRNAs in Normal PBMC and in CML cell line K562 and identified a number of differentially expressed miRNAs [24]. The study did not include human patient cells and isomiR profiling.
The presence of isomiRs was first reported by Morin et.al. 2008 based on their analysis of miRNA sequences obtained through deep sequencing of human embryonic stem cells [23]. These miRNA variants or the IsomiRs have variable 5′ and 3′ extensions. The miRNA tran-scriptome consists of sum total of different isomiR
A
B
0 50 100 150 200 250 300 350 400 4501-10 10-100 100-1000 1000-10000 >10000
Number of miRNAs
Frequency Count
N1 Ref
N1 Abund
N2 Ref
N2 Abund
0 50 100 150 200 250 300 350 400 450
1-10 10-100 100-1000 1000-10000 >10000
Number of miRNAs
Frequency Count
P1 Ref
P1 Abund
P2 Ref
[image:7.595.57.540.87.496.2]P2 Abund
populations of miR-5p and miR-3p. Among different methods of miRNA profiling, sRNA sequencing using NGS platforms is capable of identifying all these vari-ants. Some recent studies have reported tissue specific accumulation of miRNAs and their counterpart se-quences. Preferential expression of IsomiRs has also been reported in tissue specific manner [35]. Profiling of miRNAs in different lymphoid cells has been carried out. For example, one study reported a comprehensive profiling of miRNAs and their isomiRs expressed in B-cells from Jewish centenarians [36]. There is a manually curated database of extracellular circulating miRNAs called the miRandola which is connected to the miRNA knowledge base, making it useful for inferring the poten-tial biological functions of circulating miRNAs [37].
We have used this extended definition of miRNA tran-scriptome to study the total miRNA trantran-scriptome of Normal PBMCs and CML patients. Since this was a pilot study comprising of two Normal PBMC and two CML patient samples, no attempt was made to identify differ-entially expressed miRNA isoforms among the normal and patient samples. In general, distribution of miRNA isoforms in normal and patient tissues displayed similar patterns (Additional files 1, 2, 3, 4).
Our results show that mature miRNAs have to be de-fined with respect to a specific cell type, as relative levels of different isoforms are dynamic in nature. Therefore, we have taken into consideration different isomiRs and looked for the most abundant isomiR and compared with the reference miRNAs (as in miRBase). Our results
0 200 400 600 800 1000 1200 1400 1600
hsa-let-7a-5p hsa-mir-103a-3p hsa-mir-148a-3p hsa-mir-16-5p hsa-mir-185-5p
Number of IsomiRs
Highly Expressed miRNAs
Normal 1
Normal 2
Patient 1
[image:8.595.56.540.89.312.2]Patient 2
Figure 5Distribution of isomiRs in a group of highly expressed miRNAs.The selected highly expressed miRNAs are hsa-let-7a-5p, hsa-mir-103a-3p, hsa-mir-148a-3p, hsa-mir-16-5p, hsa-mir-185-5p and the patterns appear to be similar across the four samples.
[image:8.595.57.531.548.707.2]show that the most abundant isomiR is not always the same as the reference miRNA sequence (submitted to miRBase). This could be due to various reasons, such as tissue specific expression of a specific isomiR or variable degradation rates of different isomiRs. Overall the results presented here suggest that strand selection and pro-cessing of miRNAs are likely to be regulated and may be related to phenotypic differences of tissues and cells.
This dynamic nature of isomiRs and their tendency of changing with different conditions can affect any ana-lysis that relies on miRNA expression profile. The Refer-ence miRNA expression profile may not provide an exact representation of the miRNA transcriptome. As our results showed that the Reference miRNA expres-sion profile missed out nearly 255 miRNAs and also identified a fewer number of highly expressed miRNAs, this could lead to incomplete and sometimes a mislead-ing analysis. The Abundant isomiR profile can provide a more appropriate and clearer picture of the miRNA transcriptome and should be used for further down-stream analysis such as differential expression estimation and even for finding commonly expressed miRNAs among samples.
Our results on identification of novel miRNAs from sRNA sequences suggest that there are still many novel miRNAs that have not yet been identified. Therefore it is important to find these novel miRNAs in order to define the miRNA transcriptome.
In summary NGS based analysis of sRNA sequences allows complete deciphering of miRNA transcriptome that includes all the isoforms. We are still not clear about the mechanism by which a given cell or tissue de-cides the functional isoform of a given miRNA and regu-lation of isoform switching.
Methods
Cell line and blood samples preparation
Buffy coat of healthy blood donors (Normal1 and Normal2) were collected from volunteers. Red cell lysis buffer (0.144 M NH4Cl, 0.01 M NH4HCO3) was added to buffy coat to lyse the remnant RBCs and pure WBC population was obtained by centrifugation at 3000 g. Peripheral blood mononuclear cells were obtained at diagnosis from patients with CML after signed informed consent had been obtained from the patient in accord-ance with the Declaration of Helsinki. This study was approved by the hospital (AIIMS, New Delhi) according to the guidelines of the hospital’s ethics committee (Reference no. A-36:20/10/04).
RNA isolation and sequencing
Total RNA isolation was carried out from peripheral blood using TRIzol® Reagent (Invitrogen) as per manu-facturer’s instruction. RNA preparations were stored
at−80°C till further use. Small RNA population was iso-lated by separating 10 μg of total RNA on denaturing polyacrylamide gel electrophoresis (PAGE) and cutting a portion of the gel corresponding to the size 18–30 nucleotides based standard oligonucleotide markers. Adapter (5′) was ligated to sRNA population and ligated RNAs (40–60 nt) were purified by running on urea PAGE. This was followed by 3′ adapter ligation and purification of adapter ligated RNAs (70–90 nt) in a similar manner. Modified sRNAs were reverse tran-scribed and then PCR amplified with adapter specific primers and the amplified cDNAs were finally purified on Urea PAGE to generate cDNA tag libraries for se-quencing by illumina genome analyzer.
Data sets information
The sRNA sequencing data containing PBMC of two normal individuals (Normal1, Normal2) and two CML patients (Patient1, Patient2) were obtained from Illumina high throughput sequencing platform. The sequences shorter than the cut-off read length (14nt), as deter-mined by the read length distribution plot (Figure 1), were removed from all the four samples. The total num-ber of reads for all the samples before and after the ap-plication of the read length cut-off is mentioned in Table 1.
Annotation and data classification
The sRNA sequences obtained were annotated against the known databases using the Elimination pipeline as used in our previous work [24,30]. The Elimination module was used for fast matching of the sequences with the databases. A mismatch of up to 2 nucleotides was allowed. The pool of unannotated sequences at the end of the pipeline served as a source of potential novel miRNAs.
Reference miRNA expression profile generation
To generate the expression profile of the reference miRNAs, the sRNA sequences of all the samples were matched against the known mature miRNA sequences in miRBase using BLASTN. The parameters used for BLAST were tuned to obtain maximum matches, such as the word size was set to 7 nucleotides, filtering was turned off and the number of alignments reported were increased. The profile comprises of a list of the “ refer-ence” miRNAs along with their frequency or expression value for all the 4 samples (Additional file 1).
Alignment of the reads and isomiR identification
hairpins is necessary. This alignment facilitates identifi-cation of isomiRs of mature miRNA sequences derived from both, the 5′ and the 3′ region of the pre-miRNA hairpin.
Alignment of the reads to the pre-miRNAs
The alignment was done by the Bowtie software using the default parameters [38]. The pre-miRNAs were downloaded from miRBase Release 19 comprising of 1600 pre-miRNAs and 2042 mature miRNA sequences [26]. Reads from each of the four samples were aligned to the reference pre-miRNAs. The output was an align-ment of the deep sequencing reads to theHomo sapiens reference pre-miRNAs.
Obtaining clusters of the isomiRs
The alignment output was processed by a perl script de-veloped specifically to get a cluster of isomiRs that are actually reads that match at the same location but differ by a few nucleotides at the 5′and 3′ends. Such clusters were obtained for every miRNA from both the regions (5′and 3′region) of the hairpin using the position infor-mation given in the output of the alignment. To demon-strate this, the isomiR family of hsa-let-7b is shown in Additional file 2.
Abundant isomiR expression profile generation
The isomiR clusters generated as mentioned earlier were analyzed to obtain the most abundant member. An abundant isomiR expression profile comprising of a list of the known miRNAs along with the frequency of the
“most abundant isomiR” for all the samples was then created (Additional file 3).
Comparison of the reference miRNA profile and the abundant isomiR expression profile
The most abundant member could either be the refer-ence miRNA or some other isomiR. Cases where the most abundant isomiR was the reference miRNA itself, was denoted by“YES”, whereas the cases where another isomiR was the abundant one was denoted by “NO” (Additional file 4).
Novel miRNA prediction
After the NGS datasets were passed through the elimin-ation pipeline to sieve out all the known RNAs, the unannotated ones were matched with the intergenic and intronic regions of the genome to obtain exact matched sequences. Since the intergenic and intronic regions are known to be sources of the miRNA genes, the unannotated RNA sequences were matched for identify-ing potential novel miRNAs sequences. The exact matches were extended in length corresponding to the average length of a precursor miRNA and then subjected
to the ab-initio miRNA prediction algorithms such as the SCFG based CID-miRNA [31] and CSHMM [32] that can predict miRNAs with high sensitivity and specificity.
The ones predicted as miRNAs by these prediction algorithms were further checked for the following features of a miRNA that serve as filters:
1. Presence of the concerned sRNA in one of the arms of the stem region (−5p or−3p) of the hairpin. 2. Presence of one or more isomiR of that sRNA. 3. Presence of another sRNA in the other arm of the
stem region (−5p or−3p) of the hairpin.
Following is the detailed pipeline for predicting potential novel miRNAs (Vaz et al., 2010) [24,30]:
i. Matching and Extending
The unannotated sRNAs which had frequencies above or equal to 5 were matched to the intergenic/ intronic regions. The exact matched sequences were extracted along with 70 nucleotides flanking both the ends to obtain sequences of length comparable to a precursor miRNA sequence.
ii. Folding and Filtering
The extended sequences were tested by CID-miRNA
[31] and CSHMM [32] prediction tools to find for
potential pre-miRNAs. The potential pre-miRNAs reported by these tools were then checked to see if the concerned sRNA occurred in the folded putative precursor and was located in one of the arms of the stem region. Since mature miRNAs are known to be arising from the stem portion and not the loop, only those hairpins in which the sRNAs occurred in the stem were classified as correct cases and the remaining as prediction errors. These correct cases
were further tested by MiPred [34].
iii.Identifying isomiRs and counterparts
The sRNAs derived from common precursors that were predicted as correct cases, were grouped into a family. The most abundant member of a family was designated as the major mature miRNA. The sRNAs that differed from the representative by a few nucleotides were called its isomiRs and those that had a different, partially complementary sequence and were located in the other strand (stem of the hairpin loop) were treated as its putative counterparts.
The Additional file 5 comprise of the potential
iv.Removing Redundancy
Finally, the novel miRNA candidates from all the samples were pooled and the redundancy was removed to get a final set of potential novel
miRNAs. These were given a unique name and were listed along with their sample IDs. The Additional
file5comprises the details of all the mature and
precursor potential novel miRNAs. The sequence and the structures of two potential novel miRNAs is
shown in Figure 6. The Additional file6comprises
of the structures of all the potential novel precursors.
Availability of supporting data
The raw data sets supporting the results of this article are available in the Sequence Read Archive (SRA) repository. BioProject ID: PRJNA216976.
BioSample accessions: SAMN02333778, SAMN02333 779, SAMN02333780, SAMN02333781.
Additional files
Additional file 1:Reference miRNA Expression Profile.A list of the reference miRNAs, with their raw frequency or expression values as well as the normalized expression values through TPM for all the four samples. TPM (transcripts parts per million) = miRNA Frequency / Total number of reads in the sample * 106.
Additional file 2:An example of a Standard isomiR expression profile.A list of all the let-7b isomiRs for each sample with position and strand information.
Additional file 3:Abundant isomiR Expression Profile.A list of the most abundant isomiR, with their raw frequency or expression values as well as the normalized expression values through TPM for all the four samples.
Additional file 4:Classification of the abundant isomiRs as the reference miRNA or not.Cases where the most abundant isomiR was the reference miRNA itself, was denoted by“YES”, whereas the cases where another isomiR was the most abundant one was denoted by“NO”.
Additional file 5:Details of the potential novel miRNAs.A list of the potential novel miRNAs predicted sample wise, with the information on their frequency, isomiRs and prediction scores from CID-miRNA, CSHMM, miRDeep, MiPred (Sheet 1). The precursor and mature sequences of the total potential novel miRNAs are given as text file (Sheet 2). All these 17 potential novel miRNAs names have a prefix:“jnu-pat-hsa”and are numbered from 1 to 17.
Additional file 6:Structures of the potential novel miRNAs.
Structures of all the 17 potential novel miRNAs from CID-miRNA prediction tool.
Competing interests
The authors declare that they have no competing interests.
Authors’contributions
AB conceptualized and along with RK supervised the entire study. LK provided the samples. CV and RB processed and annotated the data using the elimination pipeline. CV did the novel miRNA prediction analysis. CV and PP did the isomiR analysis. RK analyzed the overall data and wrote the discussions and conclusions. HA did the experimental work. CV, RB, RK and AB drafted the manuscript. CV, HA, PP and AB did the revisions. All the authors read and approved the final manuscript.
Acknowledgements
The authors thank Department of Biotechnology, Government of India for their generous support and UPOE-supported HPCF for computing time. AB also thanks Department of Science & Technology for a JC Bose Fellowship. CV acknowledges fellowship from CSIR (CSIR SRF award no: 9/263/ (0772)/9).
Author details
1
School of Computational and Integrative Sciences, Jawaharlal Nehru University, New Delhi 110067, India.2School of Life Sciences Jawaharlal Nehru University, New Delhi 110067, India.3Department of Biochemical Engineering and Biotechnology, Indian Institute of Technology, New Delhi 110016, India.4Department of Medical Oncology, Institute Rotary Cancer Hospital, All India Institute of Medical Science, New Delhi, India.
Received: 3 October 2012 Accepted: 17 September 2013 Published: 28 September 2013
References
1. Kim VN, Nam JW:Genomics of microRNA.Trends Genet2006,
22(3):165–173.
2. Lee Y, Han J, Yeom KH, Jin H, Kim VN:Drosha in primary microRNA processing.Cold Spring Harb Symp Quant Biol2006,71:51–57. 3. Tijsterman M, Plasterk RH:Dicers at RISC; the mechanism of RNAi.
Cell2004,117(1):1–3.
4. Brennecke J, Stark A, Russell RB, Cohen SM:Principles of microRNA-target recognition.PLoS Biol2005,3(3):e85.
5. Bartel DP:MicroRNAs: target recognition and regulatory functions. Cell2009,136(2):215–233.
6. Lewis BP, Shih IH, Jones-Rhoades MW, Bartel DP, Burge CB:Prediction of mammalian microRNA targets.Cell2003,115(7):787–798.
7. Friedman RC, Farh KK, Burge CB, Bartel DP:Most mammalian mRNAs are conserved targets of microRNAs.Genome Res2009,19:92–105. 8. Zhang R, Su B:Small but influential: the role of microRNAs on gene
regulatory network and 3′UTR evolution.J Genet Genomics2009,36(1):1–6. 9. Bartel DP, Chen CZ:Micromanagers of gene expression: the potentially
widespread influence of metazoan microRNAs.Nat Rev Genet2004,
5(5):396–400.
10. Tanzer A, Stadler PF:Evolution of microRNAs.Methods Mol Biol2006,
342:335–350.
11. Shingara J, Keiger K, Shelton J, Laosinchai-Wolf W, Powers P, Conrad R, Brown D, Labourier E:An optimized isolation and labeling platform for accurate microRNA expression profiling.RNA2005,11(9):1461–1470. 12. Volinia S, Calin GA, Liu CG, Ambs S, Cimmino A, Petrocca F, Visone R, Iorio
M, Roldo C, Ferracin M, Prueitt RL, Yanaihara N, Lanza G, Scarpa A, Vecchione A, Negrini M, Harris CC, Croce CM:A microRNA expression signature of human solid tumors defines cancer gene targets.Proc Natl Acad Sci USA2006,103(7):2257–2261.
13. Deng S, Calin GA, Croce CM, Coukos G, Zhang L:Mechanisms of microRNA deregulation in human cancer.Cell Cycle2008,7(17):2643–2646. 14. Almeida MI, Reis RM, Calin GA:MicroRNA history: discovery, recent
applications, and next frontiers.Mutat Res2011,717:1–8.
15. Sempere LF, Freemantle S, Pitha-Rowe I, Moss E, Dmitrovsky E, Ambros V:
Expression profiling of mammalian microRNAs uncovers a subset of brain-expressed microRNAs with possible roles in murine and human neuronal differentiation.Genome Biol2004,5(3):R13.
16. Pfeffer S, Sewer A, Lagos-Quintana M, Sheridan R, Sander C, Grässer FA, Van Dyk LF, Ho CK, Shuman S, Chien M, Russo JJ, Ju J, Randall G, Lindenbach BD, Rice CM, Simon V, Ho DD, Zavolan M, Tuschl T:Identification of microRNAs of the herpesvirus family.Nature Meth2005,2:269–276. 17. Chen C, Ridzon DA, Broomer AJ, Zhou Z, Lee DH, Nguyen JT, Barbisin M, Xu
NL, Mahuvakar VR, Andersen MR, Lao KQ, Livak KJ, Guegler KJ:Real-time quantification of microRNAs by stem-loop RT-PCR.Nucleic Acids Res2005,
33(20):e179.
18. Sun Y, Koo S, White N, Peralta E, Esau C, Dean NM, Perera RJ:Development of a micro-array to detect human and mouse microRNAs and characterization of expression in human organs.Nucleic Acids Res2004,
32(22):e188.
19. Miska EA, Alvarez-Saavedra E, Townsend M, Yoshii A, Sestan N, Rakic P, Constantine-Paton M, Horvitz HR:Microarray analysis of microRNA expression in the developing mammalian brain.Genome Biol2004,
20. Nelson PT, Baldwin DA, Scearce LM, Oberholtzer JC, Tobias JW, Mourelatos Z:Microarray-based, high-throughput gene expression profiling of microRNAs.Nat Methods2004,1(2):155–161.
21. Creighton CJ, Reid JG, Gunaratne PH:Expression profiling of microRNAs by deep sequencing.Brief Bioinform2009,10(5):490–497.
22. ‘T Hoen PAC, Ariyurek Y, Thygesen HH, Vreugdenhil E, Vossen RH, De Menezes RX, Boer JM, Van Ommen GJ, Den Dunnen JT:Deep sequencing-based expression analysis shows major advances in robustness, resolution and inter-lab portability over five microarray platforms. Nucleic Acids Res2008,36:e141.
23. Morin RD, O'Connor MD, Griffith M, Kuchenbauer F, Delaney A, Prabhu AL, Zhao Y, McDonald H, Zeng T, Hirst M, Eaves CJ, Marra MA:Application of massively parallel sequencing to microRNA profiling and discovery in human embryonic stem cells.Genome Res2008,18:610–621. 24. Vaz C, Ahmad HM, Sharma P, Gupta R, Kumar L, Kulshreshtha R,
Bhattacharya A:Analysis of microRNA transcriptome by deep sequencing of small RNA libraries of peripheral blood.BMC Genomics2010,11:288. 25. Stark MS, Tyagi S, Nancarrow DJ, Boyle GM, Cook AL, Whiteman DC, Parsons
PG, Schmidt C, Sturm RA, Hayward NK:Characterization of the Melanoma miRNAome by deep sequencing.PLoS One2010,12;5(3):e9685. 26. miRBase: the microRNA database: www.mirbase.org.
27. Kozomara A, Griffiths-Jones S:miRBase: integrating microRNA annotation and deep-sequencing data.Nucleic Acids Res2011,39:D152–D157. 28. Yang JS, Phillips MD, Betel D, Mu P, Ventura A, Siepel AC, Chen KC, Lai EC:
Widespread regulatory activity of vertebrate microRNA* species.RNA
2011,17(2):312–326.
29. Czech B, Hannon GJ:Small RNA sorting: matchmaking for Argonautes. Nat Rev Genet2011,12(1):19–31.
30. The deep sequencing modules (Elimination and Novel miRNA prediction Pipelines): http://www.mirna.jnu.ac.in/deep_sequencing/deep_sequencing.html. 31. Tyagi S, Vaz C, Gupta V, Bhatia R, Maheshwari S, Srinivasan A, Bhattacharya
A:CID-miRNA: a web server for prediction of novel miRNA precursors in human genome.Biochem Biophys Res Commun2008,372:831–834. 32. Agarwal S, Vaz C, Bhattacharya A, Srinivasan A:Prediction of novel
precursor miRNAs using a context-sensitive hidden Markov model (CSHMM).BMC Bioinforma2010,11(Suppl 1):S29.
33. Friedländer MR, Chen W, Adamidi C, Maaskola J, Einspanier R, Knespel S, Rajewsky N:Discovering microRNAs from deep sequencing data using miRDeep.Nat Biotechnol2008,26:407–415.
34. Jiang P, Wu H, Wang W, Ma W, Sun X, Lu Z:MiPred: classification of real and pseudo microRNA precursors using random forest prediction model with combined features.Nucleic Acids Res2007,35:W339–W344. 35. Li SC, Liao YL, Ho MR, Tsai KW, Lai CH, Lin WC:miRNA arm selection and
isomiR distribution in gastric cancer.BMC Genomics2012,13(Suppl 1):S13. 36. Gombar S, Jung HJ, Dong F, Calder B, Atzmon G, Barzilai N, Tian XL, Pothof
J, Hoeijmakers JH, Campisi J, Vijg J, Suh Y:Comprehensive microRNA profiling in B-cells of human centenarians by massively parallel sequencing.BMC Genomics2012,13:353.
37. Russo F, Di Bella S, Nigita G, Macca V, Laganà A, Giugno R, Pulvirenti A, Ferro A:miRandola: extracellular circulating microRNAs database. PLoS One2012,7(10):e47786.
38. Langmead B, Trapnell C, Pop M, Salzberg SL:Ultrafast and memory-efficient alignment of short DNA sequences to the human genome. Genome Biol2009,10:R25.
doi:10.1186/1756-0500-6-390
Cite this article as:Vazet al.:Analysis of the microRNA transcriptome and expression of different isomiRs in human peripheral blood
mononuclear cells.BMC Research Notes20136:390. Submit your next manuscript to BioMed Central
and take full advantage of:
• Convenient online submission
• Thorough peer review
• No space constraints or color figure charges
• Immediate publication on acceptance
• Inclusion in PubMed, CAS, Scopus and Google Scholar
• Research which is freely available for redistribution