This is a repository copy of Scale-specific spatial density-dependence in parasitoids: a multi-factor meta-analysis.
White Rose Research Online URL for this paper: http://eprints.whiterose.ac.uk/93071/
Version: Accepted Version
Article:
Gunton, RM and Poyry, J (2016) Scale-specific spatial density-dependence in parasitoids: a multi-factor meta-analysis. Functional Ecology, 30 (9). pp. 1501-1510. ISSN 0269-8463 https://doi.org/10.1111/1365-2435.12627
[email protected] https://eprints.whiterose.ac.uk/
Reuse
Unless indicated otherwise, fulltext items are protected by copyright with all rights reserved. The copyright exception in section 29 of the Copyright, Designs and Patents Act 1988 allows the making of a single copy solely for the purpose of non-commercial research or private study within the limits of fair dealing. The publisher or other rights-holder may allow further reproduction and re-use of this version - refer to the White Rose Research Online record for this item. Where records identify the publisher as the copyright holder, users can verify any specific terms of use on the publisher’s website.
Takedown
If you consider content in White Rose Research Online to be in breach of UK law, please notify us by
Accepted
Article
This article has been accepted for publication and undergone full peer review but has not been through the copyediting, typesetting, pagination and proofreading process, which may lead to differences between this version and the Version of Record. Please cite this article as doi: 10.1111/1365-2435.12627
Received Date : 03-Jun-2015 Accepted Date : 08-Dec-2015 Article type : Standard Paper Section: Plant-Animal Interactions
Editor: Peter Mayhew
Scale-specific spatial density-dependence in parasitoids: a multi-factor
meta-analysis
Richard M. Gunton*1 and Juha Pöyry 2
1
School of Biology, University of Leeds, Leeds, LS2 9JT, U.K. 2
Finnish Environment Institute (Syke), Natural Environment Centre, P.O. Box 140, FI-00251 Helsinki, Finland.
* Corresponding author: [email protected]
Running headline: Spatial density-dependence in parasitoids Summary
Accepted
Article
traits of the host and parasitoid taxa – e.g. being more positive for more specialised hosts or parasitoids and more negative for mobile hosts or gregarious parasitoids. Building on earlier literature reviews, it is now possible to investigate these hypotheses using meta-analysis.
2. We performed a multi-factor meta-analysis on 151 analyses of parasitism rates with respect to host densities at specified scales, from 61 empirical studies published from 1988 to 2012. We explored how the correlation between host density and parasitism rate may be related to the explanatory variables already mentioned, plus parasitoid body-size and various other characteristics of both hosts and parasitoids.
3. Correlations (Pearson’s r) between host density and parasitism rate ranged from –0.88 to 0.98 (mean 0.16, standard deviation 0.39). The correlation was more often negative where the host was exotic or in the orders Lepidoptera or Diptera, where the parasitoid was larger or exotic, or where the study was conducted at a finer grain-size.
Hymenoptera and Homoptera were the most likely host orders to reveal positive associations, with Coleoptera and Diptera intermediate.
4. The fact that increased observational grain-size had similar effects to decreased parasitoid body length could be taken as evidence that parasitoids’ foraging ranges increase with their body-length. However, the hypothesis about scale-specific foraging was not supported by studies that compared multiple scales.
5. We conclude that parasitism most commonly produces positive (compensatory) spatial density-dependence, but ecological context is all-important. These findings should help improve the design and interpretation of field experiments on parasitism as well as their application to the modelling of population dynamics and the practice of biological control.
Keywords:
Accepted
Article
Introduction
The local densities of herbivores and their natural enemies in a landscape can be highly heterogeneous and unpredictable compared to those of host plants on which they depend (Hanski & Pöyry 2007). Parasitoids are a type of natural enemy maintaining a particularly close relationship with their prey in that they often specialise on one or a few host species, a single individual of which is killed during the maturation of parasitoid offspring (e.g. Godfray 1994). Spatial patterns of parasitism with respect to host densities may therefore reflect a number of ecological factors. For example, the relative ease of detecting larger and denser colonies (Root 1973; Godfray 1994) and the costs of time spent rejecting already-parasitized hosts and searching for new colonies (Cook & Hubbard 1977; Lessells 1985) may cause parasitoids to over-aggregate to their host such that denser host patches suffer more parasitism per capita. At the same time, differences between parasitoids and their hosts in resource requirements, foraging behaviour, dispersal and reproductive rates, as well as environmental perturbations, can lead to under-aggregation such that parasitism is “diluted” in denser patches (Lessells 1985; Otway, Hector & Lawton 2005). These patterns of
aggregation may be described in terms of spatial density-dependence: the correlation between per-capita mortality and local host density.
Correctly resolving the spatial scales of density effects may be crucial for understanding their consequences – for both geometrical and ecological reasons. Here we use the “scale”
Accepted
Article
A line of reasoning which we call the “scale-specific-foraging hypothesis” implies that the nature of observed correlations between local host-densities and parasitism rates is essentially a methodological artefact of the observational scales that are used. (1) It is proposed that a parasitoid discriminates among host patches according to their density at a “foraging grain-size” at which (i) the density varies significantly and (ii) energy may be saved by laying eggs disproportionately in higher-density patches, which normally creates a positive density– parasitism relationship (Heads & Lawton 1983). (2) This can be detected so long as the size of study units within which densities are calculated is comparable to the foraging grain-size (Heads & Lawton 1983). (3) If density is resolved (observed) at finer scales, the relationship with parasitism should become zero at some finer grain-size where it is optimal for
oviposition effort to be distributed uniformly among hosts, and at finer scales still a negative relationship may be found because oviposition effort responds to other factors that are not fully correlated with fine-scale host density (such as microclimate quality). In particular, attack rates in high-density clumps may be diluted because of egg-limitation or increased handling times (Stiling 1987; Walde & Murdoch 1988). (4) Observed at coarser resolutions, patches of differing densities become pooled, providing less variation among study units, so that associations with density are poorly estimated because of reduced statistical power (Heads & Lawton 1983 - but see below). (5) Spatial density effects become weaker as the extent of a study grows because patches of contrasting densities become separated beyond the range of insects’ foraging movements (Walde & Murdoch 1988; Roland & Taylor 1997). While the resolution and extent of studies are presumably (and, in certain limits, necessarily) correlated, previous work does not seem to have accounted for the distinction between them. Thus the first aim of the present investigation is to test the scale-specific-foraging hypothesis (Fig. 1) more rigorously than has previously been done.
In seminal reviews nearly 30 years ago, Stiling (1987) and Walde & Murdoch (1988)
examined host–parasitoid interactions reported at a range of spatial scales. About 25 of the 42 field studies used in the latter study appear among the 102 used in the former, and each review offered support for the scale-specific-foraging hypothesis. Negative associations between host density and parasitism rate were observed most often at the finest spatial scales (e.g. host egg batch, plant leaf), positive associations at “intermediate” scales of, for example, whole plants or small habitat patches, and non-significant, “density-independent”
Accepted
Article
prohibitive to dispersal). However, somewhat differing interpretations were offered. Stiling (1987) cited the reasoning of Heads and Lawton (1983) concerning appropriate scales of observation, while Walde & Murdoch (1988) coupled Type-I or Type-II functional responses at finer scales with other explanations for the positive relationships at intermediate scales. The latter included “semi-autonomous dynamics” creating a shifting mosaic with patches where both species generally maintain higher densities and others where they go extinct (this has been described in metapopulation models as "spatial chaos": Hassell 2000). Intriguingly, Walde and Murdoch (1988) also noted that four studies comparing more than one scale tended to find no change in the type of density-dependence.
A range of biological variables may also show relationships with host–parasitoid associations, leading to various “density-response” hypotheses to complement the scale-specific-foraging hypothesis. For example, Stiling (1987) reported more positive associations in sedentary host species, while Walde & Murdoch (1988) reported a shift from negative associations at finer scales to positive ones at coarser scales for multivoltine but not univoltine parasitoids. The latter also found a tendency for more-positive effects with smaller-bodied parasitoids, which were assumed to be less mobile. An additional prediction should be that the foraging grain-size of parasitoids increases with their body-length, shifting a scale-response curve to the right (Fig. 1). Advances in meta-analysis now make it possible to examine all these kinds of trait effects, which is the second aim of the present
investigation. Predictions for each explanatory variable, with background rationale, are given in Tables 1 and 2.
Finally, we note that some previous work suffers from an inferential problem (Brown 1989). When assessing correlations between density and a fitness component such as parasitism rate, many studies use null-hypothesis tests and take non-significant P-values to indicate “ density-independence”. However, identifying density-independenceon the basis of non-significant effect sizes is problematic, since P-values are related to sample sizes. In general,
sufficiently-large sample sizes always allow the rejection of a null-hypothesis because of
Accepted
Article
problem also afflicts point (4) of the scale-specific-foraging hypothesis, because statistical power is a methodological constraint, not to be conflated with an ecological phenomenon. It is therefore important to investigate the observed strength of density-dependent relationships relative to other fitness factors, asking what conditions may reduce density-dependence to levels at which it is not ecologically significant. The multi-factor meta-analysis reported here therefore asks whether spatial density-dependence can switch sign within realistic ecological conditions, and under what conditions its magnitude approaches zero. This is the third and final aim.
Thus the present work updates the previous reviews by examining more-recent studies, following a period of theoretical development concerning the importance of spatial scale in density-dependence. It also makes use of advances in statistical methods by employing multi-factor meta-analysis. Our three aims may be stated as our central study questions: (1) Does the sign of spatial density effects in parasitism across observational scales (both grain-size and spatial extent) follow theoretical predictions? (2) Which other species characteristics can be linked to these effects? (3) Under what conditions do positive and negative spatial density-dependence occur in insect parasitism?
Materials and methods Selection of papers
Accepted
Article
delayed effects or temporal correlations). Only a third of studies reported parasitism rates per unit host density, so our analyses were restricted to correlation statistics.
Collection of explanatory variables
For each host–parasitoid pair data were sought for a number of explanatory variables. These variables may be considered in three groups: 1) study attributes, 2) host species
characteristics and 3) parasitoid species characteristics. Predictions and rationales for the study attributes are given in Table 1, and for the host and parasitoid characteristics in Table 2.
Five study attributes were recorded: grain-size (average area of a sampling unit), extent (greatest distance between any pair of sampling units, sometimes estimated indirectly), type of study (experimental / observational) and number of parasitoid species pooled (one / more than one), and dominance of the parasitoid/s (0 = responsible for <50% of parasitism, 1 = responsible for >50%, 0.5 = co-responsible with one other species). Eight host characteristics were noted: taxonomic order, origin (native / exotic), specialization (1= monophagous / 2= oligophagous: 1 or 2 genera / 3= polyphagous), stage parasitized (1= egg / 2= pupa / 3 = larva or nymph / 4= adult), exposure of immature stages (concealed / free-living), gregariousness (solitary / gregarious), annual voltinism (1= univoltine / 2= bivoltine (at least sometimes) / 3= multivoltine) and mobility (1= sedentary / 2= mobile but weakly or not flying / 3= long-distance mobile). Most of these could be located on an ordinal scale, as indicated by the numbers given. Thus where a species (or complex) was attributed with a range of characteristics, such as stages that could be parasitized, an average value was attributed. Finally, seven parasitoid characteristics were noted: taxonomic order and group (see below), origin (native / exotic), specialization (1= monophagous / 2= oligophagous / 3=
Accepted
Article
Thus our study draws on a large quantity of explanatory data. Altogether there were four continuous variables (including parasitoid dominance), nine ordinal and seven categorical variables, of which four were binary. Logarithmic transformations of study grain-size and extent and parasitoid body size were used. The grain-size was also classified into five ecologically-informed classes similar to those of Stiling (1987), in case this allowed non-linear effects to be fitted. Finally, as species characteristics were reported rather variably in the original papers, an Internet search was performed to fill in missing data. If no value could be found, the value for a congeneric species was imputed if possible. If no mention of a species origin could be found, a species was assumed to be native in the region of the study (as was the case for 12 host and 25 parasitoid species, constituting 25% and 32% of our data respectively). Eleven species characteristics were fully determined; high proportions of missing data remained in some others (e.g. 23% for parasitoid specialisation, 20% for parasitoid gregariousness, 19% for host mobility and 11% for host gregariousness).
Meta-analysis
For each host–parasitoid pair reported, a correlation coefficient r was obtained, relating host density (sometimes transformed) to parasitism rate (percentage of hosts parasitized,
sometimes transformed). Pearson product-moment coefficients or Spearman’s rank coefficients were used where reported (these have the same sampling error variance: Rosenthal 1991; Hunter & Schmidt 2004). In other cases, statistics such as F, t or 2 were converted to Pearson’s r using standard formulas (see e.g. Rosenthal 1991; Rosenberg, Adams & Gurevitch 2000). With reference to the sample size n on which they were based, the r coefficients could be transformed to Fisher’s z statistic:
which has an asymptotic variance estimated as:
Accepted
Article
Where a paper reported multiple results for a single host–parasitoid pair (e.g. for different locations or years), we used a median. An r value was calculated for each result, and hence z and v from the median r and n values, respectively. Seven host–parasitoid pairs were each covered by two (in one case three) separate studies, but with at least a 5-fold difference in the grain-sizes used, except in one case where the same natural resolution (a single gall) was accompanied by a 10-fold difference in study extent.
A mixed-effects meta-analytic model (Aitkin 1999) was fitted to the z values. This begins with an initial estimation of residual heterogeneity ( 2) in the data according to a restricted maximum-likelihood method, indicating how much heterogeneity remains to be explained by the explanatory variables. The residual heterogeneity of the null model was 0.20, with confidence interval [0.15, 0.27], so effects of the explanatory variables were then examined using weighted least-squares regression, with weight wi calculated for the statistic from the ith study using its sampling variance vi and the residual heterogeneity, as wi = 1/(vi + 2)
(Viechtbauer 2010). Model validity was assessed by inspecting the linearity of a normal quantile plot, in which the standardized effect sizes are plotted in rank order against corresponding quantiles of the standard normal distribution (Wang & Bushman 1994).
Explanatory variables
Accepted
Article
parasitoid taxonomic group of 0.60, while its association with type of parasitism was 0.68 (Fig. S3), with host origin 0.55 and gregariousness 0.53. There was also a notable
association between host origin and parasitoid origin (0.66), and between parasitoid taxonomic group and two study characteristics: number of parasitoid species pooled (0.58) and spatial extent of the study (0.52). Patterns of all these associations may be seen in Table S2. In view of these associations it is important not to look at variables in isolation.
Study characteristics (Table 1) were first examined using the whole data set of 151 data points. A null model was first fitted, to give a baseline for heterogeneity in the data. A range of structures was then explored for the effects of spatial scale: quadratic functions of grain-size and extent, with and without interactions between the various terms, and the 5-level classification of grain-size, in case a more complex pattern could be fitted. The best-fitting of these scale models was selected using Akaike’s information criterion corrected for small sample sizes (AICc). Then in a second step, study characteristics were removed stepwise, according to the AICc, to obtain a basic “study characteristics” model. While stepwise selection is not expected to find the optimal maximum-likelihood model, it does reduce the inferential “data-dredging” problems that can arise from assessing large numbers of models (Burnham & Anderson 2002) in an exploratory study like this where statistical power is limiting.
Next, the relationships of species characteristics to density response were explored for those cases with complete data apart from four poorly-attributed variables: host gregariousness and mobility, and parasitoid gregariousness and specificity. This gave 128 cases for the
remaining 11 species characteristics, to which a model was fitted to test the predictions in Table 2. This model included either host order or parasitoid taxonomic group, then an interaction between host origin and parasitoid origin, a quadratic term for parasitoid body-length and interactions between body-body-length and each of the scale terms, together with the other study characteristics selected in the previous step. Stepwise simplification then removed any of the interactions not supported by the AICc in the presence of species characteristics, so that coefficients from the resulting “general” model could be used to test the hypotheses concerning most of the explanatory variables. This model was then further
Accepted
Article
Four complementary models were then fitted, analogous to the general model but using subsets of the data that allowed each of the four poorly-attributed predictor variables to be used.. A similar stepwise simplification process was followed for each of these models. Details of these and all other models are laid out in Table S3. We then used coefficients from the final model to estimate sets of values of each of the continuous predictor variables at which the predicted correlation would switch between positive and negative. We did this by dividing the baseline z-values for the main combinations of the selected categorical predictors by the slope coefficients of the continuous predictors.
Studies with multiple scales
In studies that used multiple scales for a single host–parasitoid system, it was possible to look for within-study trends in host–parasitism associations with changing grain-size and extent. Plots of r against grain-size and extent allowed a visual inspection. Random-effects linear models of z against grain-size and extent, respectively, were then used to obtain estimates of trends in z with scale for each study (taken as a grouping factor). In random-effects models, estimates are effectively weighted with respect to each group’s size and variance (Gelman & Hill 2007, p258), as with meta-analysis. The distributions of these estimates were inspected, and the estimates were also modelled with ordinary linear regression as functions of the means and ranges of the grain-sizes and extents of the studies, respectively, to see whether any linear trends could be described this way. Covariates retained in the best-fitting meta-analytic models were also added in, to see if this enabled the mean or range of the scales to be retained in any model after stepwise simplification using AICc.
Finally, evidence for publication bias was checked using a funnel plot, in which the standard error is plotted against residual effect sizes. This plot typically reveals the publication of progressively smaller effect sizes as standard errors decrease, but with symmetry for positive and negative effects; if part of the funnel shape is lacking, this suggests a bias in the reporting of certain types of effects (Rosenberg, Adams & Gurevitch 2000).
Accepted
Article
Results
Overall there was a positive association between host density and parasitism rate. The mean effect size (z) in the null model was 0.16, with standard error of 0.04, which corresponds to an r value of 0.16 (±0.04). The relationship between the correlation statistic r and the effect size z is approximately linear over the region of fitted values (e.g. z = 0.5 r = 0.46), so z values quoted below (followed by standard errors) may be taken as approximate correlation statistics. Positive coefficients indicate a positive association between density and parasitism rate, and negative coefficients a negative association. The set of all cases with their effect sizes and standard errors is shown in Fig. S5, which shows that 71% of studies had an association > 0. In the manner of vote-counting reviews, the association would be deemed
“density-independent” (z > 0, P < 0.05) for 59% of studies, “density-dependent” (z < 0, P < 0.05) for 28% and “inversely density-dependent” (P > 0.05) for 13%.
The exploration of scale variables achieved best fits for linear effects of log(grain-size) and log(extent) together with the interaction between these; the AICc did not support quadratic terms, nor the categorical version of grain-size. The fit was further improved by dropping the number of parasitoid species and their dominance, giving a baseline “study characteristics” model with residual heterogeneity 6% less than that of the null model.
Table 3 shows coefficients for all species characteristics, allowing assessments of the hypotheses in Table 2. These coefficients are derived from the general model and from the complementary models for host gregariousness and mobility and for parasitoid
gregariousness and specificity. However, many of the terms were not supported by the AICc during the simplification processes (Table S3), including the terms for , host specificity, exposure, voltinism, stage parasitizedand for parasitism type and parasitoid dominance. The effect of grain-size was estimated at 0.052 (±0.02) per 10-fold increase in grain-size (Fig. 2a). The overall positive association between density and parasitism rate was strongest for
Accepted
Article
term to be dropped, improving the AICc by 0.3 units. Coefficients for the three species characteristics retained in this model all showed the type of effect predicted by our
hypotheses (Tables 2, 3). Density responses were more negative for larger parasitoids (Fig. 2b), with a decrease in z of 0.30 (±0.15) per 10-fold increase in body-length. This makes a doubling of body-length roughly equivalent to a 50-fold decrease in observational grain-size (≈2 0.30/0.052), which, under the scale-specific-foraging hypothesis, could naïvely be interpreted as evidence for a corresponding increase in foraging grain-size. Density responses also tended to be more negative for exotic hosts (z = -0.73 ±0.31) and parasitoids (z = -0.15 ±0.21), and there was an interaction (z = 0.56 ±0.38) such that density responses would be intermediate (z = -0.32) where both host and parasitoid were exotic. Table 4 shows threshold values for each of the continuous predictors for which the relationship would become
negative, for various common scenarios. The funnel plot (Fig. S6) showed negligible evidence of publication bias.
20 of the studies used more than one grain-size or extent, providing 29 host–parasitoid pairs (systems) and 83 scale-specific data points. Plotting these raw values (Fig. S7) revealed strong effects of scale in many cases, but no consistent trends across the set of studies (see Supplemental Material). The trends in z as estimated using multilevel models had broadly-symmetrical histograms (Fig. S8), with mean values close to zero: -0.0001 per m2 (±0.002) for varying grain-size and -0.0003 per km (±0.0006) for varying extent.
Discussion
Our analyses lend support to several old and new hypotheses by examining the scale-specific foraging hypothesis in the context of a range of functional species characteristics. The overall prevalence of positive associations between host density and parasitism rate was in line with findings of the two previous reviews (Stiling 1987; Walde & Murdoch 1988). The coefficients of the final model suggest that, within our sampling space, the host order and host origin are similarly important, each accounting for variation of up to 0.7 in calculations of Pearson’s correlation coefficient. Either of these ecological factors could easily produce a switch from positive (“direct”) to negative (“inverse”) in the observed correlations. By analogy with the recommendations of Herrando-Perez et al. (2012) for temporal
Accepted
Article
Our first question concerned spatial scale. We found that increasing study grain-size could apparently raise Pearson’s by 0.4 around zero (e.g. from 0 to 0.4: Fig. 2), reflecting the switch from negative to positive correlations reported by Stiling (1987) and Walde and Murdoch (1988). This reflects the rising part of the curve in Fig. 1 and only partially supports the scale-specific foraging hypothesis (see Fig. S9 for residual plots); we also note that a simple positive coefficient was fitted for study extent before the term was dropped with model simplification. The predicted decline in correlation strength towards very broad scales may be lacking because most studies were based on sufficient understanding of their host– parasitoid system to avoid using areas that were too large, and even studies with very large extents retained enough sufficiently-low inter-patch distances for parasitoids to forage selectively, revealing compensatory density-dependence. It remains puzzling, however, that studies comparing multiple scales showed no consistent trends at all with grain-size, even while observed effects could vary greatly within those studies. An alternative explanation, therefore, is that scale-dependence only appears because of biases in study design. Systems studied at coarser grains may tend to have more aggregation of parasitoids to their hosts (at any scale) than those studied at finer grains, perhaps because of how grain-sizes are often chosen according to ecologically-relevant features of the host’s environment, such as the sizes of galls, leaves or host plants. It could also be that multiple scales were often used in systems where either scale or density effects had already proven elusive, for unknown reasons. Thus, considering our question (1), we find limited support for the scale-specific-foraging hypothesis. While the hypothesis has logical force, its importance has already been questioned (Sulkhanov 1995), and one of its original tenets (point 4 in the formulation above) and its earlier testing were compromised by conflating statistical significance with ecological phenomena. In any case, the complexity of interpretations in the multi-scale studies we reviewed suggests that the scale-dependence of density-dependence is not simple.
Our second and third questions concerned species characteristics. None of our predictions were refuted by our results, although correlations within the data (Table S1) limit the power for estimating many effects. Three predictions were clearly supported. First, exotic hosts tended to obtain more negative (depensatory) parasitism responses to their density, as
Accepted
Article
and parasitoid were exotic was not supported, despite a positive interaction term mediating the predicted effect. Third, larger-bodied parasitoids tended to have more negative density responses. This follows the hypothesis that such parasitoids are more limited by other factors than density – but if the scale-specific-foraging hypothesis is accepted, it could also be interpreted in terms of the parasitoid’s foraging grain-size (Walde & Murdoch 1988). Hypothetically increasing the body-length of a parasitoid would have the same effect as observing it at a smaller grain-size relative to its foraging grain-size, suggesting that the latter increases with body-length. Even if true, however, this does not seem to be a sufficient explanation, since our naïve estimate of a 50-fold increase in foraging grain-size for a doubling of parasitoid body-length seems excessive (although caution is needed in equating correlation statistics like this). Thus, considering our question (2), three factors (only one of them a species trait) were associated with density-dependence being less compensatory: hosts being exotic, and parasitoids both being larger-bodied and being exotic. With sufficient data, it would be interesting to look at other interactions between host and parasitoid traits, such as gregariousness, specificity and body-size. Phylogenetic control appeared to be necessary for hosts but not for parasitoids, since neither the composite parasitoid taxonomy factor nor parasitoid order alone was supported in the models. Depensatory density effects could not be ruled out for any host order; Hymenoptera never showednegative correlations in our data set, but in all 8 cases the hosts were native, so we would predict an exotic Hymenopteran host to experience depensatory attack rates. Thus our question (3) is answered by acknowledging that while compensatory (positive) spatial
density-dependence is most often observed, the depensatory kind is more common for exotic hosts, especially Diptera, Lepidoptera and Coleoptera, and for larger and exotic parasitoids. This reinforces the need for an analysis of the slopes of density response curves, together with theoretical work to determine what levels of depensatory density-dependence may be ecologically significant in host–parasitoid systems, and whether the concept of “density
-independence” needs defining (ecologically rather than statistically).
Accepted
Article
compensatory spatial density-dependence should promote spatial homogeneity in host densities, subject to other factors such as the possibility of over-compensation (cf. Begon, Sait & Thompson 1995; Roland & Taylor 1997). Heterogeneity, meanwhile, could result from depensatory spatial density-dependence, most likely of all for exotic Lepidopteran hosts attacked by larger exotic parasitoid species (such as the case of the codling moth Cydia pomonella being attacked by Mastrus ridibundus (Gravenhorst) in the Americas: Bezemer & Mills 2001). Moreover, the positive association of density correlations with observational grain-size may be taken to suggest that any real depensatory effects tend to occur in fine-grained systems. More painstaking empirical work will be needed to develop and test these ideas (Ives & Hochberg 2000). By contrast, we make no inferences about the temporal stability of host–parasitoid associations. Appropriate analyses for this, such as testing
density-response slopes (Andersson, Löfstedt & Hambäck 2013) or spatial variances (Hassell & Pacala 1990), would have required a more stringent selection of studies, reducing our ability to test effects of species attributes and scales.
Our study took heed of a set of criticisms levelled at one of the previous reviews (Brown 1989). Besides avoiding the problem of classifying density-independence, we excluded laboratory studies, accounted for confounding factors including the pooling of multiple species, and attempted to separate the question of actual foraging grain-size from
observational resolution. We also excluded longitudinal temporal studies. More positive associations between host and parasitoid densities might be seen if a range of time lags were considered (e.g. Turchin 1990; Holyoak 1993), but very few of our studies reported such data; it must be assumed that host densities were recorded at appropriate points in time with respect to the parasitism rates observed. Indeed, all meta-analyses rely on appropriate
methodologies having been chosen in the original studies. However, our analysis was limited where studies failed to distinguish clearly among scale concepts (Dungan et al. 2002),
Accepted
Article
Spatial scale is a central ecological concept, yet ecologists often fail to distinguish clearly among scale concepts (Dungan et al. 2002). There appeared to be more consciousness of grain-size than extent in the studies we reviewed, and this may explain why our analysis offers such ambivalent support for the scale-specific-foraging hypothesis. There is now a clear call for multi-scale studies – perhaps using very wide ranges of grain-size and extent – with sufficient statistical power to demonstrate effect sizes that change with some measure of scale. Nevertheless, the contrasting types of spatial density-dependence associated with exotic vs native species reinforce the suggestion that species traits are less important than ecological context in host–parasitoid studies.
Acknowledgements
This work was funded by the European Commission through SCALES, a large-scale
integrating project within FP7, grant 226852 .We thank Tuula Hurskainen from the library of the Finnish Environment Institute, Helsinki, for help in obtaining articles. Bill Kunin, Saskya van Nouhuys, Gergely Várkonyi, Peter Hambäck and two anonymous reviewers gave helpful comments on the manuscript.
Data accessibility
Details of the studies used in the meta-analysis are provided as online supporting information.
References
Aitkin, M. (1999) Meta-analysis by random effect modelling in generalized linear models. Statistics in Medicine, 18, 2343-2351.
Andersson, P., Löfstedt, C. & Hambäck, P.A. (2013) Insect density-plant density relationships: a modified view of insect responses to resource concentrations. Oecologia, 173, 1333-1344.
Bates, D.M., Maechler, M. & Bolker, B. (2014) lme4: Linear mixed-effects models using Eigen and S4.
Begon, M., Sait, S.M. & Thompson, D.J. (1995) Persistence of a parasitoid-host system: refuges and generation cycles? Proceedings of the Royal Society B-Biological Sciences, 260, 131-137.
Accepted
Article
codling moth, Cydia pomonella. Biological Control, 22, 169-175.
Brown, M.W. (1989) Density dependence in insect host-parasitoid systems - a comment. Ecology, 70, 776-779.
Burnham, K.P. & Anderson, D.R. (2002) Model Selection and Multimodel Inference: A Practical Information-Theoretic Approach, 2nd edn. Springer-Verlag, New York.
Cook, R.M. & Hubbard, S.F. (1977) Adaptive searching strategies in insect parasites. Journal of Animal Ecology, 46, 115-125.
Cramér, H. (1946) Mathematical Methods of Statistics. Princeton University Press.
Dungan, J.L., Perry, J.N., Dale, M.R.T., Legendre, P., Citron-Pousty, S., Fortin, M.J., Jakomulska, A., Miriti, M. & Rosenberg, M.S. (2002) A balanced view of scale in spatial statistical analysis. Ecography, 25, 626-640.
Gelman, A. & Hill, J. (2007) Data Analysis using Regression and Multilevel / Hierarchical modelling. Cambridge University Press, Cambridge.
Godfray, H.C.J. (1994) Parasitoids - Behavioral and evolutionary ecology. Princeton University Press, Princeton, New Jersey, USA.
Gunton, R.M. & Kunin, W.E. (2007) Density-dependence at multiple scales in experimental and natural plant populations. Journal of Ecology, 97, 567-585.
Hanski, I. & Pöyry, J. (2007) Insect populations in fragmented habitats. Proceedings of the Royal Entomological Society's 23rd Symposium. Insect Conservation Biology (eds A.J.A. Stewart, T.R. New & O.T. Lewis), pp. 175-202. CABI.
Hassell, M.P. (2000) Host-parasitoid population dynamics. Journal of Animal Ecology, 69, 543-566.
Hassell, M.P., Latto, J. & May, R.M. (1989) Seeing the wood for the trees - detecting density dependence from existing life-table studies. Journal of Animal Ecology, 58, 883-892.
Hassell, M.P. & Pacala, S.W. (1990) Heterogeneity and the dynamics of host-parasitoid interactions. Philosophical Transactions of the Royal Society of London Series B-Biological Sciences, 330, 203-220.
Heads, P.A. & Lawton, J.H. (1983) Studies on the natural enemy complex of the holly leaf-miner: the effects of scale on the detection of aggregative responses and the implications for biologoical control. Oikos, 40, 267-276.
Herrando-Perez, S., Delean, S., Brook, B.W. & Bradshaw, C.J.A. (2012) Density dependence: an ecological Tower of Babel. Oecologia, 170, 585-603.
Holyoak, M. (1993) The frequency of detection of density-dependence in insect orders. Ecological Entomology, 18, 339-347.
Hunter, J.E. & Schmidt, F.L. (2004) Methods of meta-analysis: Correcting error and bias in research findings, 2nd ed. edn. Sage Publications, Thousand Oaks, CA.
Accepted
Article
next twenty years. Parasitoid Population Biology (eds M.E. Hochberg & A.R. Ives), pp. 278-303. Princeton University Press.
Jeffs, C.T. & Lewis, O.T. (2013) Effects of climate warming on host–parasitoid interactions. Ecological Entomology, 38, 209-218.
Kummel, M., Brown, D. & Bruder, A. (2013) How the aphids got their spots: predation drives self-organization of aphid colonies in a patchy habitat. Oikos, 122, 896-906.
Lessells, C.M. (1985) Parasitoid foraging: should parasitism be density dependent? Journal of Animal Ecology, 54, 27-41.
Murdoch, W.W., Chesson, J. & Chesson, P.L. (1985) Biological Control in Theory and Practice. American Naturalist, 125, 344-366.
Otway, S.J., Hector, A. & Lawton, J.H. (2005) Resource dilution effects on specialist insect
herbivores in a grassland biodiversity experiment. Journal of Animal Ecology, 74, 234-240.
Quinn, G.P. & Keough, M.J. (2002) Experimental Design and Data Analysis for Biologists. Cambridge University Press, Cambridge.
R Development Core Team (2014) R: A language and environment for statistical computing. R Foundation for Statistical Computing, Vienna, Austria.
Ray, C. & Hastings, A. (1996) Density dependence: Are we searching at the wrong spatial scale? Journal of Animal Ecology, 65, 556-566.
Roland, J. & Taylor, P.D. (1997) Insect parasitoid species respond to forest structure at different spatial scales. Nature, 386, 710-713.
Root, R.B. (1973) Organisation of a plant-arthropod association in simple and diverse habitats: The fauna of collards (Brassica oleracea). Ecological Monographs, 43: 95-124.
Rosenberg, M.S., Adams, D.C. & Gurevitch, J. (2000) MetaWin: Statistical software for meta-analysis, version 2.0. Sinauer Associates, Sunderland, MA, USA.
Rosenheim, J.A. (1990) Density-dependent parasitism and the evolution of aggregated nesting in the solitary Hymenoptera. Annals of the Entomological Society of America, 83, 277-286.
Rosenthal, R. (1991) Meta-analytic procedures for social sciences. Sage Publications, Newbury Park, CA.
Stewart-Oaten, A. & Murdoch, W.W. (1990) Temporal consequences of spatial density dependence. Journal of Animal Ecology, 59, 1027-1045.
Stiling, P.D. (1987) The frequency of density dependence in insect host parasitoid systems. Ecology, 68, 844-856.
Sulkhanov, A.V. (1995) On the correlation between the level of parasitism and the density of mines of Lithocolletis populifoliella (Lepidoptera, Gracillariidae). Zoologichesky Zhurnal, 74, 93-101.
Accepted
Article
Viechtbauer, W. (2010) Conducting Meta-Analyses in R with the metafor Package. Journal of Statistical Software, 36, 1-48.
Walde, S.J. & Murdoch, W.W. (1988) Spatial density dependence in parasitoids. Annual Review of Entomology, 33, 441-466.
Wang, M.C. & Bushman, B.J. (1994) Using the normile quantile plot to explore meta-analytic data sets. Psychological Methods, 3, 46-54.
Supplementary Material
Table S1: Specification of parasitoid taxonomic groups.
Table S2: Statistical associations among explanatory variables. Table S3: Details of models fitted.
Fig. S1: Numerical characteristics of parasitism for different parasitoid taxonomic groups: (a) body-lengths; (b) host voltinism; (c) host stage parasitised.
Fig. S2: Nominal characteristics of parasitism for different parasitoid taxonomic groups: (a) types of parasitism; (b) types of host exposure.
Fig. S3: Types of parasitism for each host taxonomic group.
Fig. S4: Proportions of native vs. exotic parasitoids for each category of host origin. Fig. S5: Forest plot describing the variation in effect sizes among all 151 host-density– parasitism associations.
Fig. S6: Diagnostic plots: (a) a Q-Q plot to check normality of residuals; (b) a funnel plot of sample size against residual effect size (z) to check for publication bias in the study sample. Fig. S7: Reported host–parasitism associations at varying (a) grain sizes and (b) extents, for studies looking at more than one scale.
Fig. S8: Histograms of estimated trends in Fisher’s z per unit (a) ln(grain-size) and (b) ln(extent), for studies that examined a host–parasitoid system at more than one grain-size or extent.
Note S1: Description of further exploratory multi-scale modelling performed.
Accepted
Article
Tables
Table 1. Study attributes considered, with predictions for their effect on the association between density and parasitism rate, and rationale for these predictions. Note that optimal foraging behaviour is generally expected to lead to a positive association because parasitoids may save energy and reduce risk by ignoring isolated individual hosts and aggregating towards higher-density patches (Cook & Hubbard 1977). For a detailed description of
variables see the section ‘Collection of explanatory variables’.
Variable (range
or number of
levels in brackets) Prediction: effect on association Rationale Study grain-size
(10mm2–36 ha)
+ for coarser
grain-size
Parasitoids focus on denser host patches at intermediate grain-sizes
where foraging costs and risks are significant. In finer-scale foraging
they primarily respond to non-density factors (e.g. host quality), with
high densities diluting attack rates via egg-limitation (Stiling 1987;
Walde & Murdoch 1988).
Study extent
(1.5m–700km)
– for small extents
+ for intermediate
extents; e.g. 1km
0 for very large
extents
Separation of host patches by greater distance increases the relative
value of dense patches to parasitoids, but only within their foraging
range. Beyond this, broad-scale density-independent factors take over
(Walde & Murdoch 1988; Roland & Taylor 1997).
Study type (2) – for experimental Manipulated host densities may span a greater range than those to
which parasitoids are adapted, reducing the relevance of
optimal-foraging predictions.
Multiple
para-sitoid species
pooled? (2)
+ for multiple
species
Taken in aggregate, competing parasitoid species are more likely to
exploit a host population as predicted by optimal foraging behaviour
than is a single species (Stiling 1987).
Parasitoid
dominance (0–
1)
+ for dominant Dominant parasitoids are more likely to exploit a host population as
predicted by optimal foraging behaviour (Stiling 1987); subordinates
Accepted
[image:23.595.18.512.147.756.2]Article
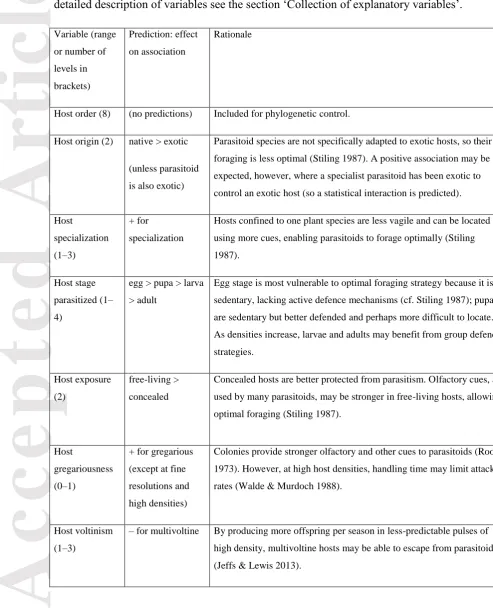
Table 2. Species characteristics included in the study, with predictions for their effect on the association between density and parasitism rate, and rationale for these predictions. For a
detailed description of variables see the section ‘Collection of explanatory variables’.
Variable (range
or number of
levels in
brackets)
Prediction: effect
on association
Rationale
Host order (8) (no predictions) Included for phylogenetic control.
Host origin (2) native > exotic
(unless parasitoid
is also exotic)
Parasitoid species are not specifically adapted to exotic hosts, so their
foraging is less optimal (Stiling 1987). A positive association may be
expected, however, where a specialist parasitoid has been exotic to
control an exotic host (so a statistical interaction is predicted).
Host
specialization
(1–3)
+ for
specialization
Hosts confined to one plant species are less vagile and can be located
using more cues, enabling parasitoids to forage optimally (Stiling
1987).
Host stage
parasitized (1–
4)
egg > pupa > larva
> adult
Egg stage is most vulnerable to optimal foraging strategy because it is
sedentary, lacking active defence mechanisms (cf. Stiling 1987); pupae
are sedentary but better defended and perhaps more difficult to locate.
As densities increase, larvae and adults may benefit from group defence
strategies.
Host exposure
(2)
free-living >
concealed
Concealed hosts are better protected from parasitism. Olfactory cues, as
used by many parasitoids, may be stronger in free-living hosts, allowing
optimal foraging (Stiling 1987).
Host
gregariousness
(0–1)
+ for gregarious
(except at fine
resolutions and
high densities)
Colonies provide stronger olfactory and other cues to parasitoids (Root
1973). However, at high host densities, handling time may limit attack
rates (Walde & Murdoch 1988).
Host voltinism
(1–3)
– for multivoltine By producing more offspring per season in less-predictable pulses of high density, multivoltine hosts may be able to escape from parasitoids
Accepted
Article
Host mobility
(1–3)
– for mobile Sedentary hosts are less able to escape parasitoid attacks (Stiling 1987).
Parasitoid
taxonomic
group (16)
(no predictions) Included for phylogenetic control
Parasitoid origin
(2)
exotic > native
(especially for
exotic hosts)
Exotic parasitoids may have strong functional responses to their hosts
either by design (intentional introductions of biological control agents)
or because of close association with an exotic host (casual
introductions) (Murdoch, Chesson & Chesson 1985).
Parasitoid
specialization
(1–3)
+ for specialized Specialist parasitoids are more effective at locating their hosts so more
likely to produce a strong functional response (Stiling 1987).
Parasitoid
gregariousness
(0–1)
– for gregarious Gregarious parasitoids can obtain multiple offspring per host, and are more likely to exploit this where hosts are scarce (Stiling 1987).
Type of
parasitism (3)
endoparasitic >
ectoparasitic
(No prediction for
kleptoparasites)
Endoparasitic species generally have higher fecundities than
ectoparasitic species and therefore can produce stronger functional
responses to increasing host densities (Godfray 1994). In general, nest
parasites are expected to show similar associations to true parasitoids
(Rosenheim 1990).
Parasitoid size
(0.3–25 mm)
– for larger (especially for
generalists)
or n-shaped;
offsetting effect of
grain-size
Larger parasitoids are typically stronger dispersers, foraging widely and
reducing their aggregation to hosts (Walde & Murdoch 1988); they may
also be more limited by non-host resources (especially if generalists).
However, very small parasitoids may have limited ability to direct their
foraging towards optimal patches. Larger parasitoids have larger
foraging grain-sizes, so observed effects at a given grain-size are
Accepted
[image:25.595.47.526.225.757.2]Article
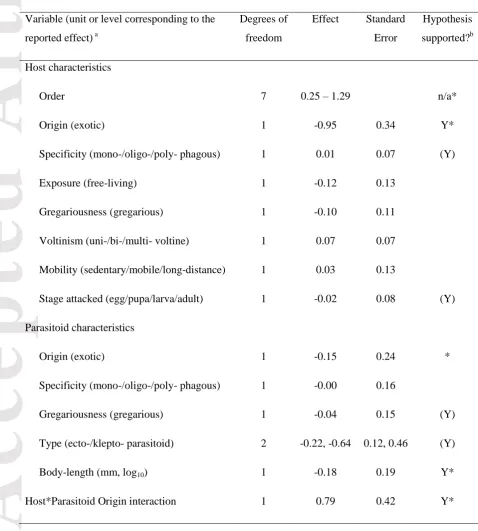
Table 3. Estimated effects of species characteristics and selected study characteristics on parasitism rates. The “Effect” column shows the increase in z associated with each 1-unit increase or transition from one of the stated levels to the next as given in brackets in the first column. These coefficients come from the “general” model allowing the signs and
magnitudes of all effects to be compared against the hypotheses in Table 2 (the values do not
match those given in the text, which come from the simplified “final” model).
Variable (unit or level corresponding to the
reported effect) a
Degrees of
freedom
Effect Standard
Error
Hypothesis
supported?b
Host characteristics
Order 7 0.25 – 1.29 n/a*
Origin (exotic) 1 -0.95 0.34 Y*
Specificity (mono-/oligo-/poly- phagous) 1 0.01 0.07 (Y)
Exposure (free-living) 1 -0.12 0.13
Gregariousness (gregarious) 1 -0.10 0.11
Voltinism (uni-/bi-/multi- voltine) 1 0.07 0.07
Mobility (sedentary/mobile/long-distance) 1 0.03 0.13
Stage attacked (egg/pupa/larva/adult) 1 -0.02 0.08 (Y)
Parasitoid characteristics
Origin (exotic) 1 -0.15 0.24 *
Specificity (mono-/oligo-/poly- phagous) 1 -0.00 0.16
Gregariousness (gregarious) 1 -0.04 0.15 (Y)
Type (ecto-/klepto- parasitoid) 2 -0.22, -0.64 0.12, 0.46 (Y)
Body-length (mm, log10) 1 -0.18 0.19 Y*
Accepted
Article
Selected study attributes
Study type (experiment) 1 -0.15 0.11 (Y)
Grain-size (log10) 1 0.05 0.02 (Y)
Extent (log10) 1 0.05 0.04 (Y)
a
The model has no intercept, so the value for a given host order should be taken as the baseline,
assuming the case of a native, monophagous, solitary endoparasitoid species with a body length of 1
mm, attacking the egg stage of a native, monophagous, concealed, solitary, univoltine, sedentary host,
observed at a grain of 1 m2 and extent of 1 km.
b
Y = yes; * = retained in final model; (Y) =partial support: i.e. with a t-statistic < 2, or support for
part of a predicted non-linear trend. See the text for coefficients of a simplified model with better
Accepted
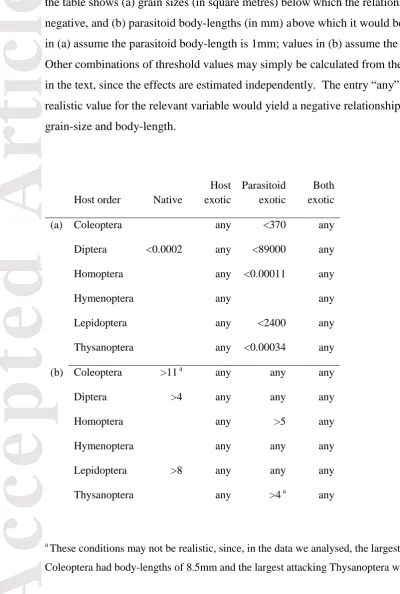
[image:27.595.27.428.139.734.2]Article
Table 4. 39 examples of realistic conditions under which parasitism is predicted to show a negative relationship with host density (depensatory density-dependence), showing how most host orders only show such effects for exotic hosts and/or parasitoids. For each host order, the table shows (a) grain sizes (in square metres) below which the relationship would be negative, and (b) parasitoid body-lengths (in mm) above which it would be negative. Values in (a) assume the parasitoid body-length is 1mm; values in (b) assume the grain-size 1m2. Other combinations of threshold values may simply be calculated from the coefficients given in the text, since the effects are estimated independently. The entry “any” means that any realistic value for the relevant variable would yield a negative relationship for the above grain-size and body-length.
Host order Native
Host exotic
Parasitoid exotic
Both exotic
(a) Coleoptera any <370 any
Diptera <0.0002 any <89000 any
Homoptera any <0.00011 any
Hymenoptera any any
Lepidoptera any <2400 any
Thysanoptera any <0.00034 any
(b) Coleoptera >11 a any any any
Diptera >4 any any any
Homoptera any >5 any
Hymenoptera any any any
Lepidoptera >8 any any any
Thysanoptera any >4 a any
a
These conditions may not be realistic, since, in the data we analysed, the largest parasitoids attacking
Accepted
Article
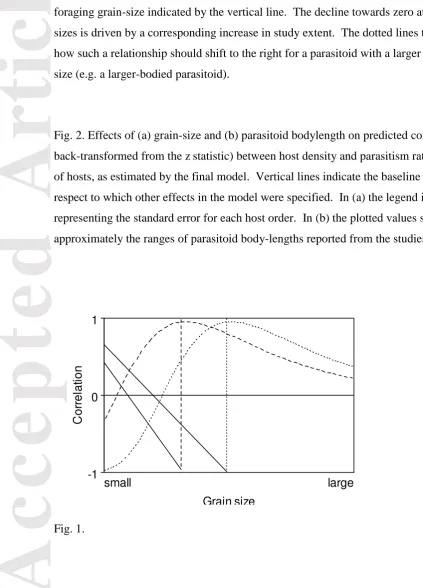
[image:28.595.18.442.160.749.2]Figure captions
Fig. 1. Predicted effects of study grain-size (area over which each datum for host density is measured) on the correlation between host density and per-capita parasitism rate. (a) The dashed curve illustrates the scale-specific-foraging hypothesis, with the characteristic foraging size indicated by the vertical line. The decline towards zero at large grain-sizes is driven by a corresponding increase in study extent. The dotted lines then illustrate how such a relationship should shift to the right for a parasitoid with a larger foraging grain-size (e.g. a larger-bodied parasitoid).
Fig. 2. Effects of (a) grain-size and (b) parasitoid bodylength on predicted correlations (r, back-transformed from the z statistic) between host density and parasitism rate for six orders of hosts, as estimated by the final model. Vertical lines indicate the baseline values with respect to which other effects in the model were specified. In (a) the legend incorporates bars representing the standard error for each host order. In (b) the plotted values span
approximately the ranges of parasitoid body-lengths reported from the studies analysed.
-1 0 1
Grain size
C
o
rr
e
la
ti
o
n
small large
Accepted
Article
-0.2 0.0 0.2 0.4 0.6 0.8
Grain-size (m2)
r
1e-04 0.01 1 100 10000
(a)
Hymenoptera Homoptera Thysanoptera
Coleoptera
Lepidoptera
Diptera
0.5 1.0 2.0 5.0 10.0 20.0
-0.2 0.0 0.2 0.4 0.6 0.8
Parasitoid body size (mm)
r
(b)