Connecting low- and high-mass star formation: the intermediate-mass
protostar IRAS 05373
+
2349 VLA 2
G. M. Brown,
†
K. G. Johnston,
†
M. G. Hoare
†
and S. L. Lumsden
School of Physics and Astronomy, University of Leeds, West Yorkshire, Leeds LS2 9JT, UK
Accepted 2016 August 23. Received 2016 August 22; in original form 2016 March 29
A B S T R A C T
Until recently, there have been few studies of the protostellar evolution of intermediate-mass (IM) stars, which may bridge the low- and high-mass regimes. This paper aims to investigate whether the properties of an IM protostar within the IRAS 05373+2349 embedded cluster are similar to that of low- and/or high-mass protostars. We carried out Very Large Array as well as Combined Array for Research in Millimeter Astronomy continuum and12CO(J=1–0) observations, which uncover seven radio continuum sources (VLA 1–7). The spectral index of VLA 2, associated with the IM protostar is consistent with an ionized stellar wind or jet. The source VLA 3 is coincident with previously observed H2emission line objects aligned in the
north–south direction (P.A.−20 to−12◦), which may be either an ionized jet emanating from VLA 2 or (shock-)ionized cavity walls in the large-scale outflow from VLA 2. The position angle between VLA 2 and 3 is slightly misaligned with the large-scale outflow we map at ∼5-arcsec resolution in12CO (P.A.∼30◦), which in the case of a jet suggests precession. The
emission from the mm core associated with VLA 2 is also detected; we estimate its mass to be 12–23 M, depending on the contribution from ionized gas. Furthermore, the large-scale outflow has properties intermediate between outflows from low- and high-mass young stars. Therefore, we conclude that the IM protostar within IRAS 05373+2349 is phenomenologically as well as quantitatively intermediate between the low- and high-mass domains.
Key words: techniques: interferometric – stars: formation – stars: protostars – ISM: jets and outflows – radio continuum: stars.
1 I N T R O D U C T I O N
As much research has focused on either distinguishing or unifying the formation of high-mass stars and their low-mass counterparts, intermediate-mass (IM) stars are of interest as they provide a bridge between the two mass regimes. IM protostars – the precursors of Herbig Ae/Be stars – are defined as young stellar objects (YSOs) that will reach final masses of 2–8 Mand have luminosities be-tween∼50 and 2000 L(Beltr´an2015). The lower limit of 2 M originates from the fact that above this limit stars should not have the outer convective zones required to produce the magnetic fields needed for magnetically-mediated accretion (see Simon et al.2002, for an observational confirmation of this temperature and thus mass limit); the upper limit of 8 M originates from the stellar mass required to produce a type II supernova, which is used to define the lower mass limit for high-mass stars (Zinnecker & Yorke2007). The upper mass limit also corresponds to the mass above which
Please see http://doi.org/10.5518/105
†E-mail:[email protected](GMB);[email protected](KGJ);
[email protected](MGH)
photoionization by UV photons becomes easily observable in cm continuum and the mass above which a pre-main-sequence phase is not observable (Beltr´an & de Wit2016).
Unlike high-mass stars, whose descent on to the main sequence occurs while still deeply embedded and actively accreting within their parent cores, IM stars have a longer pre-main-sequence time-scale, so that their discs are revealed for part of their formation, similar to their low-mass counterparts. This is a result of their accretion time-scales being shorter than their Kelvin–Helmholtz time-scales, so that these stars are finished accreting before they reach the main sequence (Beuther et al.2007). On the other hand, IM stars form in more densely clustered environments, similar to high-mass stars (e.g. Gutermuth et al.2005; Fuente et al.2007), with a smooth transition to the regime of rich clusters at a mass of 6 M(Testi, Palla & Natta1999). Thus, IM protostars should also share some of the characteristics of those at higher masses.
To date, there have been only a handful of high-resolution stud-ies of IM protostars. One of the first, Fuente et al. (2001) presented a study including two IM protostars: NGC 7129 FIR1 and FIR2, uncovering multiplicity and/or associated clusters, protostellar en-velope masses of 2–3.5 Mand energetic bipolar outflows which appear to be driven by several sources. Beltr´an, Girart & Estalella
(2006) studied the morphology of the outflow from the IM protostar IRAS 22272+6358A, finding that the 14.2 Mcore OVRO 2, one of the four detected continuum sources in the region, was powering the asymmetric and collimated molecular outflow. The properties of the outflow were consistent with those of the outflows driven by low-mass YSOs. In a companion paper to Beltr´an et al. (2002,
2006) that studied IRAS 21391+5802 and IRAS 22272+6358A mentioned above, Beltr´an et al. (2008) studied the 280 L proto-star IRAS 20050+2720. They detected three dust cores in the region at 2.7 mm (OVRO 1-3), and two bipolar flows in12CO J=1 – 0, one
of which is powered by OVRO 1. Combining their study of the out-flows from these three IM protostars with a small number of objects from the literature, they concluded that although outflows from IM protostars are more energetic than those from low-mass protostars, they were not necessarily more complex, being collimated even at low velocities. In addition, they suggest that the increased outflow momentum rates compared to outflows from low-mass protostars are likely due to higher accretion rates for these objects. A further finding was that the IM protostars studied all formed in protoclusters containing several IM and low-mass millimetre sources.
More recently, van Kempen et al. (2016) used APEX to study a sample of six IM protostars, mapping the bipolar outflows and quiescent gas in12CO and13CO J=6 – 5 and finding that their line
luminosities and outflow forces also follow trends with bolometric luminosity and outflow mass, connecting low- and high-mass pro-tostars, however they could not confirm the result of Beltr´an et al. (2008) that fragmentation enhances outflow forces for IM proto-stars in clusters. Studying one of the largest samples thus far, Crim-ier et al. (2010) determined the physical structure of the envelopes of a sample of five IM protostars via radiative-transfer modelling, finding that the physical parameters describing the envelopes vary smoothly between low- and high-mass protostars, and that the den-sity structure was consistent with predictions from the predictions of ‘inside–out’ collapse.
Other IM protostars studied to date include IRAS 22198+6336 (S´anchez-Monge et al.2010; Palau et al.2011), AFGL 5142 (Palau et al.2011), IC 1396 N (Neri et al.2007; Fuente et al.2009), 13 S in R CrA (Saul2015), MMS 6/OMC-3 (Takahashi & Ho2012; Takahashi et al.2012), IRAS 05345+3157 (Fontani et al.2009) and G173.58+2.45 (Shepherd & Watson2002). In this work, our aim is to increase this relatively small number by investigating the physical properties of the IM protostar associated with IRAS 05373+2349, which has a luminosity of 290–600 L(Molinari et al.2000; Zhang et al.2005; Khanzadyan et al.2011), to uncover the differences and similarities to low- and high-mass star formation. To do this, we have carried out the first mm-interferometric observations of IRAS 05373+2349, which lies at a distance of∼1.2 kpc (Molinari et al.
2000). The associated embedded cluster and the nearby GGD 4 object have been the focus of several studies due to the active star formation occurring within the region. Zhang et al. (2005) has mapped the large-scale outflow from IRAS 05373+2349 in
12CO (J=1–0) with 29-arcsec resolution, determining that it has
an NE–SW orientation. A more recent study by Khanzadyan et al. (2011, hereafterK11) identified numerous possible outflows in the immediate area of IRAS 05373+2349 based on near-infrared H2
line emission and investigated the candidate driving sources. In this paper, we present continuum observations of IRAS 05373+2349 at 6, 3.6, 1.3-cm and 2.7-mm wavelengths as well as12CO (J=1–0) line emission. In Section 2 we describe the
obser-vations. In Section 3 we present our results, including the derived outflow properties. We present our discussion in Section 4 and in Section 5 we outline our conclusions.
2 I N T E R F E R O M E T R I C O B S E RVAT I O N S
2.1 VLA 6, 3.6 and 1.3-cm continuum
Multi-wavelength radio continuum observations were taken of IRAS 05373+2349 over two days during 2008 March, with the Very Large Array (VLA) of the National Radio Astronomy Observatory.1
The program number for these observations was AJ337. The point-ing centre was 05h40m24
.
s40+23◦5054.00 (J2000).
The first set of observations in the X(λ=3.6-cm) and K(λ= 1.3-cm) bands were taken on 2008 March 10 and the observation of the C(λ = 6-cm) band was taken on 2008 March 12. For each observation two 50-MHz spectral windows were placed at: 4.89 and 4.84 GHz, 8.44 and 8.49 GHz, and 22.5 and 22.4 GHz for the 6, 3.6 and 1.3-cm bands, respectively. The observations were performed in the VLA’s C configuration which had baseline lengths between 35 m and 3.2 km, which produced information on angular scales from 3.88, 2.31 and 1.4 arcsec to 4.9, 3.0 and 1.4 arcmin for 6, 3.6 and 1.3 cm, respectively.
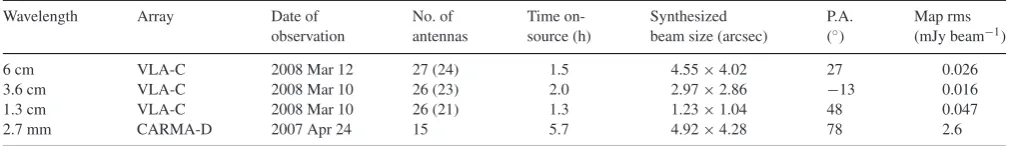
Table1presents a summary of the observations which lists the observed wavelength, configuration, observation date, number of antennas (with the number of antennas with useful data given in parentheses), time on-source, synthesized beam size, position angle (P.A.) and the map rms noise.
Table2presents the calibrators used in the observations; the ‘Cal type’ column showing their application. Table2also presents the fluxes derived from the available models for the flux calibrators 3C48 (0137+331) and 3C286 (1331+305), and the bootstrapped fluxes derived from the gain calibrators.
Data reduction and imaging was carried out using the Common Astronomy Software Applications (CASA) package version 4.2.2 (McMullin et al.2007). Briggs weighting with a robust parame-ter of 1.5 was used to clean the images, to retain optimal sensitivity in the observations. Data from baselines shorter than 50 m were removed from the 6-cm image to eliminate flux that was partially resolved-out.
2.2 CARMA12CO (J=1–0) and 2.7-mm continuum
Combined Array for Research in Millimeter Astronomy (CARMA2)
observations atλ=2.7 mm were taken on 2007 April 24. The an-tenna array during the observation consisted of 15 anan-tennas, six 10 m and nine 6 m in diameter with primary beams sizes of 64 arcsec and 115 arcsec, respectively. A mosaic was created from nine pointing centres in a square grid pattern. The pointings were separated by 30 arcsec.
The CARMA correlator was set up with two sidebands, placed either side of the chosen local oscillator frequency of 113.280 GHz, with the upper bands situated to measure12CO (J=1–0) line
emis-sion. Both the upper and lower sidebands contained one wide and two narrow spectral windows, giving a total of six windows. The
1The National Radio Astronomy Observatory is a facility of the National
Science Foundation operated under cooperative agreement by Associated Universities, Inc.
2Support for CARMA construction was derived from the states of
Table 1. Summary of continuum observations.
Wavelength Array Date of No. of Time on- Synthesized P.A. Map rms
observation antennas source (h) beam size (arcsec) (◦) (mJy beam−1)
6 cm VLA-C 2008 Mar 12 27 (24) 1.5 4.55×4.02 27 0.026
3.6 cm VLA-C 2008 Mar 10 26 (23) 2.0 2.97×2.86 −13 0.016
1.3 cm VLA-C 2008 Mar 10 26 (21) 1.3 1.23×1.04 48 0.047
2.7 mm CARMA-D 2007 Apr 24 15 5.7 4.92×4.28 78 2.6
Table 2. Assumed and determined flux and phase calibrator properties.
Source Flux density (Jy) Cal
6 cm 3.6 cm 1.3 cm 2.7 mm type
0137+331 5.52 – – – A
1331+305 – 5.22 2.58 – A
0530+135 – – – 6.70 A+G
0559+238 0.41 0.37 – – G
0539+145 – – 0.35 – G
Note.Absolute flux calibrators are denoted by ‘A’ and the gain calibrators are denoted by ‘G’ in the ‘cal type’ column.
wide spectral windows each had bandwidths of 468.750 MHz, a total of 15 channels with a spectral resolution of 31.250 MHz and were centred on 111.558 and 115.000 GHz, respectively. The two narrow windows in each sideband had bandwidths of 30.76 and 7.69 MHz, 63 channels and spectral resolutions of 488.281 and 122.070 kHz. The narrow windows were centred on 111.288 GHz in the lower sideband and 115.271 GHz in the upper sideband.
Hanning smoothing and line length corrections were applied to the data in MIRIAD, which gave spectral resolutions of 1.27
and 0.32 km s−1for the two narrow windows covering the 12CO
(J=1–0) line emission. The data were then exported from their original format intoCASAwhere data reduction and imaging were
carried out. The source 0530+135 was used to calibrate both am-plitude and gain of the observation; the assumed flux is listed in Table2.
The images created from the millimetre continuum and 12CO
(J=1–0) line emission are presented in Section 3.2. The two con-tinuum spectral windows were cleaned together to produce a sin-gle image with a central frequency of 113.279 GHz, using Briggs weighting with a robust parameter of 0.5. The synthesized beam size and noise, along with the number of antennas and time spent on-source for the observation, can be found in Table1.
For the 12CO (J=1–0) line image, the two narrow spectral
windows were combined at 115.271 GHz using natural weight-ing and a channel width of 1.3 km s−1; uv–distances smaller than
3 kλ were excluded. The beam size of the 12CO (J=1–0)
im-age was 4.92 × 4.28 arcsec P.A. 78◦ and the noise ranged from∼0.07 Jy beam−1in an empty channel, up to∼0.5 Jy beam−1
in the inner channels.
3 R E S U LT S
3.1 VLA 6, 3. and 1.3-cm continuum
In this section, we present the VLA images at each wavelength and calculate spectral indices.
The radio continuum maps are presented in Fig.1, which shows the 6 and 3.6-cm continuum emission with a wide view of the surrounding region (panels a and b), and towards VLA 2 and 3
(panels c and d), and in Fig.2, which shows the 1.3-cm continuum towards VLA 2.
Table3presents the peak position, integrated and peak flux den-sities, the deconvolved source size and position angle and the con-volved size measured as the largest extent of the 3σ contours. The properties presented in Table3were derived from fitting a 2D Gaus-sian to each radio source, with the exception of two non-GausGaus-sian sources which are indicated by an * in theλcolumn.
For Gaussian sources unresolved by the fit, an upper size limit is given in the deconvolved source size column of Table 3. The upper size limit is determined by calculating the maximum possible source size when unresolved, which depends on the signal-to-noise of the source and the synthesized beam size of the observation.
For non-Gaussian sources, the peak flux density and position were measured at the brightest pixel and the integrated flux density was measured by summing up the emission within a region defined by the 1σ contour of the source.
The fitted source positions had an average error of∼0.1 arcsec. The errors in the integrated flux of the non-Gaussian sources were determined by measuring the noise in nearby empty regions of sky using the same aperture shape used for the flux measurements.
The spectral index,α, defined as
Sν ∝να. (1)
was determined for all sources where there were fluxes at more than one wavelength. In the case of VLA 2, which had three fluxes, the spectral index was derived from a least squares fit in log space, including errors in the fit. The spectral indices are given in Sec-tions 3.1.1 and 3.1.2 below. The angular size–frequency index,ξ, given by
θν∝νξ. (2)
The two indices (αandξ) provide further classification of the emission coming from a thermal or non-thermal source. For ther-mal sources with anα =0.6, which is related to the power-law relationship between electron density and emitting object radius, it can be shown thatξ = −0.7 (Panagia & Felli1975). Whereas, non-thermal synchrotron emission, detected using interferometric techniques, can produceξ≤ −2 (Thompson, Moran & Swenson
1986). We determinedξ for VLA 1, which was resolved at more than one wavelength, using a similar fitting method as described above.
3.1.1 VLA 2 and VLA 3
VLA 2 is associated with one of the most prominent members of the embedded cluster towards IRAS 05373+2349 and was detected at all wavelengths. Figs1(c) and (d) shows the 6 and 3.6-cm emission, respectively. VLA 2 was the only source detected at 1.3 cm, which is shown in Fig.2.
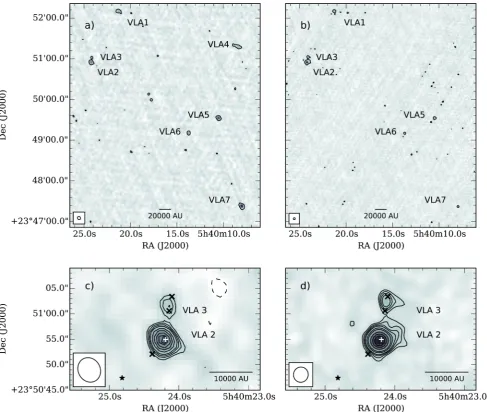
[image:3.595.46.286.177.260.2]Figure 1. Continuum emission at 6 cm (left column,σ=26µJy beam−1) and 3.6 cm (right column,σ=16µJy beam−1). Panels a and b show the region
surrounding theIRASsource. Panels c and d show VLA 2 and 3. The position of the millimetre core seen at 2.7 mm (see Fig.3) associated with VLA 2 is marked by a plus. A Class I object reported by Gutermuth et al. (2009) is marked by a black star. The black xs indicate the positions of MHO 745 A, B and C detected byK11. Contour levels show for (a and b):−3, 3×σ, (c):−3, 3, 4, 5, 6, 8, 10, 12, 15×σ, (d):−3, 3, 4, 5, 6, 8, 10, 12, 15, 20, 25×σ. The beam and scale bar are shown at the bottom of the images.
(see Section 3.2), marked as a plus sign; a Class I protostar (to the south–east of VLA 2, Gutermuth et al.2009), marked as a black star, and the positions of three molecular hydrogen emission line objects (MHO 745A, B and C,K11), marked as crosses.
The spectral index of VLA 2 wasα=0.38±0.14, measured from fitting a line to the three fluxes3 given in Table 3. As the
1.3-cm image, shown in Fig.2, is sensitive to more compact emis-sion than 6 and 3.6-cm maps, while being less sensitive to the extended emission, it may be that we do not detect a significant portion of the flux of VLA 2 at this wavelength. Therefore, it is possible that the spectrum including the 1.3-cm flux measurement
3The integrated and peak flux densities of VLA 2 at 6 cm, measured in a
1σ region, was 0.43±0.06 mJy and 0.41±0.03 mJy beam−1, respectively. These are very similar to the fluxes derived from the Gaussian fit given in Table3, thus the determined spectral index is not affected by different methods of flux measurement.
is artificially flattened. Ignoring the 1.3-cm flux yields a much larger spectral index ofα=1.20±0.24. Both of these spectral indices are consistent with free–free emission of varying degrees of optical thickness.
VLA 2 was detected previously at 3.6 cm with a flux density of 0.70 (±0.04) mJy and an estimated spectral index of 0.9 (Molinari et al.2002). Our measured flux and spectral index for VLA 2 is consistent with this finding.
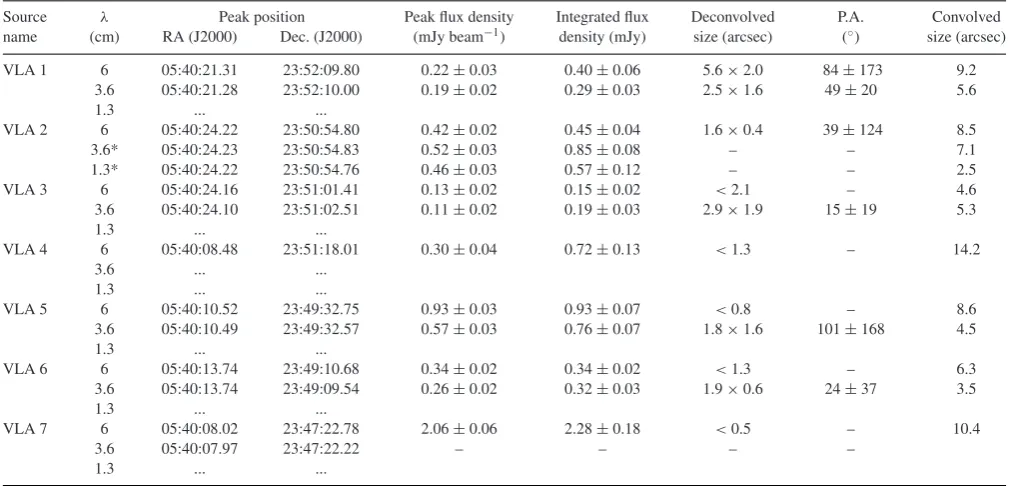
Figure 2. A close-up map of the 1.3-cm continuum emission towards VLA 2 with the position of the millimetre core seen at 2.7 mm (see Fig.3) associated with VLA 2 marked by a plus. Contour levels are−3, 4, 5, 6, 7, 8 and 9×47µJy beam−1. The beam is shown in the bottom left and a scale
bar in the bottom right.
Figs1(c) and (d) show the inner contours of VLA 3 coincide closely with the positions of MHO 745 A and B.K11suggested the MHOs (745 A, B and C) are powered by a bipolar jet originating from VLA 2 aligned in the north–south direction. We measured the position angle of this jet to be between−20◦and−12◦, where the former value was found by drawing a line between MHO 745 A and VLA 2 and the second was found between MHO 745 A and C (to the south-east of VLA 2).
The suggested jet is aligned within roughly 40◦–0◦of the large-scale outflow, which was found to have a position angle of∼30◦(see Section 3.2.2). This is consistent with the classification criterion for
an ionized jet used by (Purser et al.2016), that the difference in deconvolved position angle between the jet and the outflow should be less than 45◦. Therefore the radio continuum emission from VLA 2 and VLA 3 can be explained as a single compact source plus a jet elongated to the north in both 6 and 3.6-cm maps. However, due to its misalignment with the large-scale outflow, another explanation could be that VLA 3 is tracing the (shock-)ionized cavity walls of the large-scale outflow (see Section 4.1).
3.1.2 Other sources
The remaining detected sources are not known to be associated with IRAS 05373+2349. Following equation A2 of Anglada et al. (1998), which gives the number of background sources as a function of integrated flux based on data from Condon (1984), we expect approximately two background sources within the field of 4.5 by 5.5 arcmin at 6 cm, shown in Fig.1(a).
VLA 1 is the first of two radio sources detected by Molinari et al. (2002). There is no infrared source found to be immediately associated with VLA 1 in anySpitzerIRAC (Fazio et al.2004) or UKIDSS band. The source has a spectral index ofα= −0.61±0.38 which indicates synchrotron emission.
An angular size–frequency index,ξ= −0.96±0.92, was also derived for VLA 1. This index can be used to determine charac-teristics of the source. Yang et al. (2008) found that extragalactic jets show angular size–frequency indices ofξ= −0.95±0.37. The uncertainty in the measured angular size–frequency index is too large to draw such a conclusion. However, as there is no evidence of a YSO at this position, we find the source is likely extragalactic in origin.
The detailed analysis of the H2line emission byK11did not
[image:5.595.45.550.449.692.2]focus as far afield as to where VLA 4–7 are located. Thus, it is difficult to associate any MHOs with these sources.
Table 3. Measured properties of the observed 6-cm (5 GHz), 3.6-cm (8.5 GHz) and 1.3-cm (22.5 GHz) continuum sources.
Source λ Peak position Peak flux density Integrated flux Deconvolved P.A. Convolved
name (cm) RA (J2000) Dec. (J2000) (mJy beam−1) density (mJy) size (arcsec) (◦) size (arcsec)
VLA 1 6 05:40:21.31 23:52:09.80 0.22±0.03 0.40±0.06 5.6×2.0 84±173 9.2
3.6 05:40:21.28 23:52:10.00 0.19±0.02 0.29±0.03 2.5×1.6 49±20 5.6
1.3 ... ...
VLA 2 6 05:40:24.22 23:50:54.80 0.42±0.02 0.45±0.04 1.6×0.4 39±124 8.5
3.6* 05:40:24.23 23:50:54.83 0.52±0.03 0.85±0.08 – – 7.1
1.3* 05:40:24.22 23:50:54.76 0.46±0.03 0.57±0.12 – – 2.5
VLA 3 6 05:40:24.16 23:51:01.41 0.13±0.02 0.15±0.02 <2.1 – 4.6
3.6 05:40:24.10 23:51:02.51 0.11±0.02 0.19±0.03 2.9×1.9 15±19 5.3
1.3 ... ...
VLA 4 6 05:40:08.48 23:51:18.01 0.30±0.04 0.72±0.13 <1.3 – 14.2
3.6 ... ...
1.3 ... ...
VLA 5 6 05:40:10.52 23:49:32.75 0.93±0.03 0.93±0.07 <0.8 – 8.6
3.6 05:40:10.49 23:49:32.57 0.57±0.03 0.76±0.07 1.8×1.6 101±168 4.5
1.3 ... ...
VLA 6 6 05:40:13.74 23:49:10.68 0.34±0.02 0.34±0.02 <1.3 – 6.3
3.6 05:40:13.74 23:49:09.54 0.26±0.02 0.32±0.03 1.9×0.6 24±37 3.5
1.3 ... ...
VLA 7 6 05:40:08.02 23:47:22.78 2.06±0.06 2.28±0.18 <0.5 – 10.4
3.6 05:40:07.97 23:47:22.22 – – – –
1.3 ... ...
Notes.∗indicates sources that were measured in an aperture defined by the 1σcontour, as they were not well-fitted by a Gaussian. An ellipsis (...) in the peak position columns indicate non-detections at that wavelength.
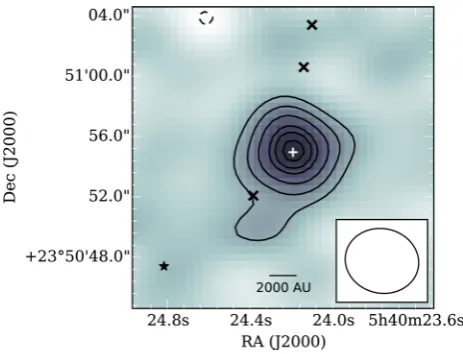
Figure 3. Continuum emission towards VLA 2 at 111.1GHz (∼2.7 mm) shown in grey-scale and contours. The rms noise in the image isσ =2.6 mJy beam−1. The grey-scale extends from−3×σto 27 mJy beam−1.
Con-tours are at−3, 3, 4, 5, 7 and 9×σ. The synthesized beam is 4.9×4.28 arc-sec PA=78◦. Markers are the same as Fig.1c.
VLA 4 was found to be clearly associated with IRAC emission at 3.6, 4.5, 5.8 and 7.9µm and theK-band of the UKIDSS survey. A spectral index could not be determined as it was only detected at 6 cm in our observations. However, a non-detection at 3.6 cm of VLA 4 indicates this source likely has a negative spectral index.
VLA 5 was found to be associated with faint IRAC emission at 3.6 and 4.5µm. A spectral index ofα= −0.38±0.24 was found, consistent with a non-thermal source or narrowly consistent with optically-thin free–free emission.
There is faint IRAC emission associated with VLA 6 at 3.6 and 4.5µm, which has a spectral index ofα= −0.15±0.28. It could equally be associated with a non-thermal or optically thin thermal source due to the uncertainty in the spectral index.
VLA 7 was found to be associated with faint IRAC emission at 3.6, 4.5 and 5.8 µm. The 3.6-cm flux of VLA 7 could not be accurately determined. This was due to the primary beam response not being accurately known so far from the pointing centre of the observation. However, it can be seen from our observations that the 3.6-cm detection of VLA 7 is much weaker than that at 6 cm, and therefore it likely has a negative spectral index.
Further observations of these sources will be required to de-termine their association with the IRAS 05373+2349 cluster or whether they are unrelated or extragalactic objects.
3.2 CARMA12CO (J=1–0) and 2.7-mm continuum
In this section the12CO (J=1–0) line and millimetre continuum
observations taken towards VLA 2 are used to infer the properties of the dense molecular gas surrounding the region.
3.2.1 2.7-mm continuum
Continuum emission at 2.7 mm was only detected towards VLA 2. Fig.3shows the continuum emission from the region around VLA 2 at 111.1 GHz (∼2.7 mm) with MHOs 745 A, B and C (K11) indi-cated as crosses. The morphology of the emission shows a compact core with an extension from the south of the source in the south–east direction. The integrated and peak flux densities, measured in a 1σ
contour, were 53.7±2.6 mJy and 30.1±1.6 mJy, respectively. The
peak position, measured at the brightest pixel, was 05h40m24
.
s18
+23◦5055.01 (J2000).
A 2D-Gaussian was also fitted to the source. However, we found that only the inner compact core could produce a satisfactory fit; we derived an integrated flux density of 53.7± 5.9 mJy, a peak flux density of 29.9±3.3 mJy and a deconvolved source size of 4.1± 0.4 by 2.9 ± 0.6 arcsec and a P.A. of 162◦ ± 18◦. The deconvolved size corresponds to 4900×3500 au at 1.2 kpc. The peak position was 05h40m24
.
s194+23◦5055.346 (J2000), with a
positional uncertainty on the order of 0.5 arcsec (Ikarashi et al.
2011). Therefore the 2.7-mm source is associated with VLA 2. To investigate how much millimetre emission might arise from the ionized material, we extrapolated the combined 6-cm flux of VLA 2 and VLA 3 to 2.7 mm, assuming a spectral index of
α=0.38±0.14 and that the spectrum did not turn over. We found an expected flux density of∼1.95±0.73 mJy, which is∼4 per cent of the measured millimetre continuum (∼54 mJy). Therefore, the contribution of ionized gas emission in this case is negligible. How-ever, if we useα=1.20±0.24, determined by excluding the 1.3 cm fluxes, the estimated contribution to the combined integrated flux of VLA 2 and 3 at 2.7 mm becomes∼25 mJy, roughly half of the measured millimetre continuum. Scaling the 6 cm fluxes of VLA 2 and 3 byα= 1.2 andα=0.45, respectively, where the latter is the measured spectral index for VLA 3, gives a total 2.7 mm flux of∼20 mJy. We calculated the core mass for both cases below.
The mass of the material surrounding VLA 2, traced by the millimetre continuum emission was calculated using
Mdust=
d2
Sν Bν(TD)κν
(3)
whered=1.2 kpc andTD=27 K are the distance and dust tempera-ture (Molinari et al.2000).Sνis the integrated flux density measured in the 1σcontour atλ=2.7 mm.Bν(TD) is the value of the Planck function atTD. Finally the dust opacity,κν=0.1807 cm−2g−1, was found by extrapolating model opacity data (Ossenkopf & Henning
1994) to 2.7 mm, assuming a gas density of 1×10⁵g cm−3and
thin ice mantles, whereβ, the dust opacity index with frequency, was fitted to be−1.82. A gas-to-dust ratio of 100 was assumed to infer the total core mass. In the case of all of the 2.7 mm emission originating from the dust, the total core mass is 23 M. This is in close agreement with the value of∼26 Mfound by Molinari et al. (2008) from fitting the SED of the source. In the case of 25 mJy of the 2.7 mm emission originating from the ionized gas, and 29 mJy from the dust, we determined the core mass to be 12 M.
3.2.2 12CO (J=1–0) line emission
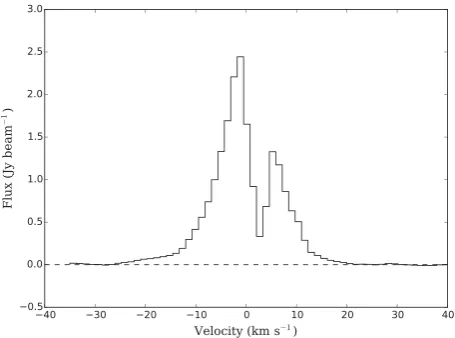
Fig. 4presents the 12CO (J=1–0) line profile of the large-scale
outflow from VLA 2. High-velocity line wings are present in the spectrum. The inner, low velocity channels show evidence for self-absorption and/or missing flux.
Fig. 5shows blueshifted and redshifted 12CO (J=1–0)
Figure 4. 12CO (J=1–0) spectral profile measured at the position of VLA 2:
05h40m24.s22+23◦5054.79 (J2000).
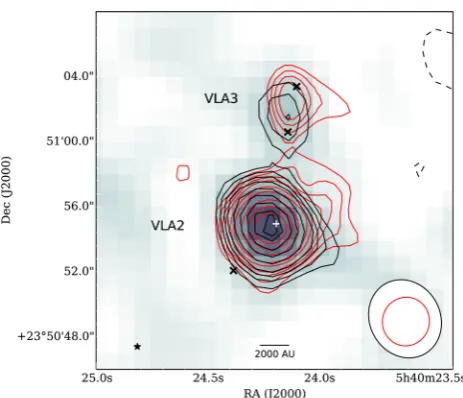
Figure 5. Centred on VLA 2 (marked by a white plus) the contours show12CO (J=1–0) line emission integrated over−25.9 to−1.2 km s−1 (blue) and 5.3 to 20.9 km s−1 (red) and 2.7-mm continuum emission (black). The contours are overplotted on a first moment map of the12CO
(J=1–0) emission between−25.9 to 20.9 km s−1 velocity channels with
pixels masked below 1 Jy. Blueshifted contours are−3, 3, 4, 5, 7, 10, 12, 14×3.0 Jy beam−1km s−1, redshifted contours are−3, 3, 4, 5, 7, 10, 15,
20×2.0 Jy beam−1km s−1 and the black contours are as in Fig.3. The
synthesized beam is shown in the bottom left corner and the scale bar in the bottom middle. MHOs are shown as crosses. A Class I (see Fig.1c and d) and a Class II object reported by Gutermuth et al. (2009) are shown as a black and white star, respectively.
The12CO (J=1–0) emission appears to show a bipolar outflow
centred on VLA 2, appearing in the same orientation as previously seen by Zhang et al. (2005). There is also blueshifted and redshifted emission∼35 arcsec to the north-east of VLA 2 that appears to resemble another resolved bipolar outflow. However, the only ap-parent candidate driving source of this outflow is a Class II source reported by Gutermuth et al. (2009), which does not lie directly between the red and blue lobes of the candidate outflow. Therefore, it is unlikely that this source is driving the outflow and we conclude that the12CO (J=1–0) emission in fact belongs to the single
[image:7.595.309.550.82.236.2]out-flow centred on VLA 2. This could be due to inclination effects. For instance, if the outflow is almost in the plane of the sky, part of the blueshifted cavity will appear redshifted.
Table 4. Derived properties of the blueshifted and redshifted lobes of the outflow centred on VLA 2 traced by12CO (J=1–0) emission.
Parameter Outflow
Blue lobe Red lobe Velocity range (km s−1) −25.9 to−1.2 5.3 to 20.9
Mass,M(M) 0.53 0.26
Momentum,P(Mkm s−1) 4.06 (4.82) 1.57 (1.87)
Energy,E(Mkm2s−2) 20.70 (29.24) 5.80 (8.19)
Energy,E(1044erg) 4.14 (5.85) 1.16 (1.64)
voutflow(km s−1) 7.61 (9.04) 5.92 (7.03)
Length,L(au) 35 000 (41 000) 43 000 (51 000)
tdyn(104yr) 2.15 (2.15) 3.41 (3.41)
˙
M(10−5M
yr−1) 2.48 (2.48) 0.78 (0.78)
F (10−4M
km s−1yr−1) 1.88 (2.24) 0.46 (0.55)
˙
E(10−4M
km2s−2yr−1) 9.61 (13.56) 1.70 (2.40)
L (L) 0.16 (0.22) 0.03 (0.04)
The properties given within parentheses have been corrected at an inclination i=57.3◦, otherwise no correction was applied (i=0◦).
The groups of MHOs to the north-east and south-west are likely associated with the outflow from VLA 2, as they lie at opposite ends of the outflow seen in12CO (J=1–0) emission.
We also detected redshifted emission extending to the south– east of VLA 2 which ends in a patch of emission at 05h40m26
.
s7+
23◦5026 (J2000). However, there are no other signposts of star formation at that position.
3.2.3 Outflow properties
Table 4 presents the derived properties for the redshifted and blueshifted lobes of the outflow centred on VLA 2. The rows from top-to-bottom show: velocity range, mass, momentum, kinetic en-ergy, mean velocity, length, dynamical time-scale, mass transfer rate, mechanical force and mechanical luminosity for the blue and red lobes of the outflow.
The velocity range shows the range of velocity channels that were integrated over to produce the outflow properties. The in-ner, low velocity channels were excluded due to self-absorption or missing flux; channels with insignificant emission (< 3σ) in the high-velocity wings were also excluded.
The outflow mass,Moutflow, was derived for each lobe following Scoville et al. (1986):
M(M)=2.29×10⁻⁵(T +0.926)
e−5.53/T τ τ−e−τ d
2 kpc
Svdv (4)
whereτ is the optical depth, which we set to zero, assuming the source to be optically thin, and therefore the third term of equation (4) was set to unity. The distance,dkpc, was assumed to be 1.2 kpc.
Sv is the integrated flux density in velocity channel,v, that was found by summing up the emission within a region defined by the 1σ =0.5 Jy beam−1contours (the maximal noise level within the
spectra).Tis the excitation temperature of the outflow gas, which we assumed to be equal to the full Planck function derived brightness temperature, given as:
TB(K)=0.048 [ν(GHz)]
×ln
1+3.92×10
−8[
ν(GHz)]3
θ()2
Fν(Jy beam−1)
−1
(5)
[image:7.595.48.287.266.451.2]the largest peak flux from either blueshifted or redshifted lobe was used to define the brightness temperature for that outflow, which we found to be 6.47 Jy beam−1at 5.3 km s−1from the redshifted lobe.
We determined the brightness temperature to be 27.3 K and found the total mass contained within the flows to be∼0.8 M.
To calculate the outflow momentum, P, and kinetic energy,
E, the Sv dv term in equation (4) was replaced by Sv
(v − vLSR) / cosi dv for the momentum, and
Sv [(v − vLSR) / cosi]2 dvfor the kinetic energy, where vis the
veloc-ity of each channel,vLSR=2.3 km s−1is the systematic velocity of
the cloud taken from Zhang et al. (2005) andiis the inclination of the outflow.
The columns in Table 4show the properties uncorrected for inclination (i=0◦) and the values in parentheses show the properties corrected using a mean inclination angle ofi=57◦.3 (Bontemps et al.1996). The uncorrected results are more closely relatable to the results of Zhang et al. (2005), who also assumed an inclination of 0◦. Although we have not applied this, a further correction of 3.5 may be applied to correct for optical depth effects (Bontemps et al.1996).
The mass weighted velocity,voutflow, of the outflow is given as
theP/Moutflowof the flow. The length of flow,L, was measured from the position of VLA 2 to the furthest 3σ contour (see Fig.5) and was corrected for inclination.
From this we define the dynamical time-scale,tdyn=L/voutflow,
and compute: the mass transfer rate, ˙M=Moutflow/tdyn; the mechan-ical force,F=P/tdyn; and the mechanical energy transport rate, ˙E, or mechanical luminosity, L, defined asE/tdyn.
4 D I S C U S S I O N
In addition to spectral analysis, a comparison of the radio-to-bolometric luminosity of a source can be used as a means of source classification. For low luminosity objects to have a strong radio flux, the emission can only arise from shock-ionized gas, as there is negligible emission via photoionization of circumstellar material. At higher luminosities, the expected Lyman continuum flux would dominate the observed radio flux, if the emission were produced via photoionization i.e. by an HIIregion.
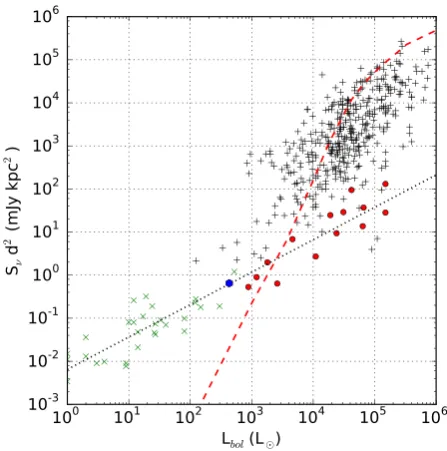
Fig.6presents the 6-cm radio flux of VLA 2 (Sν =0.45 mJy) at a bolometric luminosity of 430 L, shown as a (blue) hexagon. The bolometric luminosity was found by taking an average of the luminosities found in the literature: 1100 Lat a distance of 2.0 kpc (found by the RMS survey, Lumsden et al.2013), which scales to a luminosity of 396 Latd=1.2 kpc; 470 L(Molinari et al.2000), 400 L(Molinari et al.2008), 600 L(Zhang et al.2005) and 290 L(K11); all at a distance of 1.2 kpc.
Also plotted on Fig.6are examples of jet-like objects taken from Anglada (1995) shown as green crosses, YSOs and HII-regions
detected in the Red MSX Source (RMS) survey (Lumsden et al.
2013) shown as red circles and black plus signs, respectively. At the average bolometric luminosity of 430 L, VLA 2 appears to be associated with the jet-like objects.
[image:8.595.313.537.56.282.2]The luminosity of 290 L, that was used in our average, was found via SED modelling of VLA 2 (K11). The authors used a large aperture (∼22 000 au) and incorporated fluxes from lower resolution mid-infrared to radio wavelengths in the fitting, which suggested a Class 0/I actively accreting protostar with a mass of about 4.5 M. A separate SED fitting yielded a luminosity of 6030 L(d=1.12 kpc). However, this is likely incorrect as the authors modelled the system as edge on, which greatly increased the fitted luminosity. Thus, this value was not included in our average.
Figure 6. Radio luminosity,Sν d2, atν = 5 GHz against the average
bolometric luminosity,Lbol, for VLA 2 taken from the literature (indicated
as a blue hexagon), HIIregions (indicated by black plus signs) and YSOs
(shown as red circles) detected in the RMS survey (Lumsden et al.2013). The green crosses indicate low-mass jet-like sources taken from Anglada (1995). The dashed line shows the results for a single star using stellar models from Lanz & Hubeny (2007). The dotted line shows the extrapolated jet luminosity fitted to the low-mass stars from Anglada (1995) as well as to known emission from high-mass stars (whether jet or wind) as given in Hoare & Franco (2007).
4.1 Small-scale jet
Multiple shock-features were detected in the region around VLA 2 in H2line emission (K11, also see Varricatt et al.2010), extending
to the north and south, as well as in the north-east south-west direc-tions, roughly aligning with the large-scale outflow we observe in
12CO (J=1–0).
Fig.7presents the positions of MHOs 745 A, B and C, suggested to be powered by a jet centred on VLA 2 (K11), marked by crosses, along with the contours of the 6 and 3.6-cm emission detected in this work (see Fig.1c and d).
Fig.7also shows an offset of∼1 arcsec in the detected peaks of VLA 3 at 6 and 3.6 cm, which equates to∼1200 au at this distance. This suggests a source with varying spectral index or, alternatively, two discrete objects with one being detected only at 6 cm and the other detected only at 3.6 cm. The MHOs also coincide with the blue- and redshifted12CO (J=1–0) emission (see Fig.5). This
suggests that VLA 2 and the MHOs could also arise from shocks created by jet material impinging upon the cavity walls created by the large-scale outflow.
4.2 Large-scale outflow
Our 12CO (J=1–0) observations further resolved the previously
observed large-scale outflow (Zhang et al.2005) centred on VLA 2. The derived properties for the outflow (listed in Table4) are lower than those found by the single dish observations of Zhang et al. (2005), which wereMoutflow=3.4 M,P=27.1 Mkm s−1and E=34×1044erg. However, this is expected due to the fraction
Figure 7. Closeup of VLA 2 and VLA 3 with 6-cm emission shown by grey-scale and black contours at−3, 3, 4, 5×26µJy beam−1. The red
contours show 3.6 cm emission at 3, 4, 5, 7×16µJy beam−1. The black xs
indicate the positions of MHO 745 A, B and C detected byK11. The beams are shown in the bottom left with the larger (black) and smaller (red) ellipse showing the 6 and 3.6-cm beams, respectively. The scale bar is also shown in the bottom.
observations, which we estimate to be around 10 per cent for the line centre (e.g. Qiu et al.2009; Kwon et al.2015).
Interferometric observations of low-mass outflows can expect to find outflow masses on the order of 10−3–10−2M
(e.g. Tamura et al.1996). Single dish observations of massive outflows find out-flow masses in the range∼5–1000 M(Maud et al.2015). As-suming that 10 per cent of the flux in the single dish observations is recovered by the interferometer, we therefore expect massive YSOs to have interferometric outflow masses of 0.5–100 M.
Therefore, the outflow detected in12CO (J=1–0), found to have
a total mass of∼0.8 M, is higher than that observed for low-mass YSOs and is consistent with the lower end of the expected outflow masses found by Maud et al. (2015).
5 C O N C L U S I O N S
We present observations of the embedded cluster associated with IRAS 05373+2349 made with the VLA in its C configuration at wavelengths of 6, 3.6 and 1.3-cm and CARMA observations of
12CO(J=1–0) line emission and 2.7-mm continuum. The spectral
index of VLA 2 derived from the centimetre observations was found to be consistent with an ionized wind. In addition, the integrated radio flux of VLA 2 compared to the average bolometric luminosity of the associatedIRASsource indicated a jet-like object.
We also detected a new radio source, VLA 3, that is coincident with MHOs previously observed in H2line emission around VLA 2.
This supports the claim byK11that the MHOs trace a bipolar jet centred on VLA 2, which is roughly aligned with the large-scale outflow presented here in12CO(J=1–0). However, we did not find
evidence of any of the other outflows in the region, as proposed byK11. Therefore, we suggest that the large-scale outflow likely arises from a single jet centred on VLA 2 and traced by VLA 3. Furthermore, the difference in position angle of∼40◦–50◦between the jet and the large-scale outflow could be explained by precession of the jet. However, an alternative explanation of VLA 3 could
be (shock-)ionization of the outflow cavity walls of the large-scale outflow.
Finally, our observations of the millimetre continuum and12CO
(J=1–0) emission towards VLA 2 found a core mass of between 12 and 23 Mand an outflow mass of 0.8 M, intermediate between outflows from low- and high-mass YSOs.
The goal of this study was to investigate whether the properties of the IM protostar IRAS 05373+2349 VLA 2 are similar to that of low- and/or high-mass protostars. Our observations of the ra-dio continuum emission from IRAS 05373+2349 VLA 2 indicate that it arises in a jet, similar to those observed towards low- and high-mass young stars (e.g. Anglada1995; Purser et al.2016). In addition, we detect radio continuum emission (VLA 3) associated with previously observed H2line emission which would indicate
shock-ionized knots in the jet from this source, seen commonly in the sample of jets from high-mass YSOs observed by Purser et al. (2016). The core mass lies between those observed for low- and high-mass YSOs, with the youngest low-mass sources having core masses on the order of a solar mass (Stutz et al.2013), and the mass reservoirs of high-mass stars reaching thousands of stellar masses (Beuther et al.2002). The jet itself is accompanied by an outflow from VLA 2, seen in12CO (J=1–0) emission, which has
proper-ties intermediate between those seen towards low- and high-mass YSOs.
AC K N OW L E D G E M E N T S
We thank David Smith for help with the initial interpretation of the CARMA data. This work was supported in part by the Science and Technology Facilities Council (STFC) grant at the University of Leeds. This work is based in part on observations made with the
Spitzer Space Telescope, which is operated by the Jet Propulsion Laboratory, California Institute of Technology under a contract with NASA. This work is based in part on data obtained as part of the UKIRT Infrared Deep Sky Survey.
R E F E R E N C E S
Anglada G., 1995, Rev. Mex. Astron. Astrofis. Ser. Conf., 1, 67
Anglada G., Villuendas E., Estalella R., Beltr´an M. T., Rodr´ıguez L. F., Torrelles J. M., Curiel S., 1998, AJ, 116, 2953
Beltr´an M. T., 2015, Ap&S, 355, 283
Beltr´an M. T., de Wit W. J., 2016, A&AR, 24, 6
Beltr´an M. T., Girart J. M., Estalella R., Ho P. T. P., Palau A., 2002, ApJ, 573, 246
Beltr´an M. T., Girart J. M., Estalella R., 2006, A&A, 457, 865
Beltr´an M. T., Estalella R., Girart J. M., Ho P. T. P., Anglada G., 2008, A&A, 481, 93
Beuther H., Schilke P., Menten K. M., Motte F., Sridharan T. K., Wyrowski F., 2002, ApJ, 566, 945
Beuther H., Churchwell E. B., McKee C. F., Tan J. C., 2007, in Reipurth B., Jewitt D., Keil K., eds, Protostars and Planets V. Univ. Arizona Press, Tucson, p. 165
Bontemps S., Andre P., Terebey S., Cabrit S., 1996, A&A, 311, 858 Condon J. J., 1984, ApJ, 287, 461
Crimier N. et al., 2010, A&A, 516, A102 Fazio G. G. et al., 2004, ApJS, 154, 10
Fontani F., Zhang Q., Caselli P., Bourke T. L., 2009, A&A, 499, 233 Fuente A., Neri R., Mart´ın-Pintado J., Bachiller R., Rodr´ıguez-Franco A.,
Palla F., 2001, A&A, 366, 873
Fuente A., Ceccarelli C., Neri R., Alonso-Albi T., Caselli P., Johnstone D., van Dishoeck E. F., Wyrowski F., 2007, A&A, 468, L37
Gutermuth R. A., Megeath S. T., Pipher J. L., Williams J. P., Allen L. E., Myers P. C., Raines S. N., 2005, ApJ, 632, 397
Gutermuth R. A., Megeath S. T., Myers P. C., Allen L. E., Pipher J. L., Fazio G. G., 2009, ApJS, 184, 18
Hoare M. G., Franco J., 2007, in Hartquist T.W., Pittard J. M., Falle S. A. E. G., eds, Astrophysics and Space Science Ser., Diffuse Matter from Star Forming Regions to Active Galaxies. Springer, Dordrecht, p. 61 Ikarashi S. et al., 2011, MNRAS, 415, 3081
Khanzadyan T., Movsessian T. A., Davis C. J., Magakian T. Y., Gredel R., Nikogossian E. H., 2011, MNRAS, 418, 1994 (K11)
Kwon W., Fern´andez-L´opez M., Stephens I. W., Looney L. W., 2015, ApJ, 814, 43
Lanz T., Hubeny I., 2007, ApJS, 169, 83 Lawrence A. et al., 2007, MNRAS, 379, 1599
Lumsden S. L., Hoare M. G., Urquhart J. S., Oudmaijer R. D., Davies B., Mottram J. C., Cooper H. D. B., Moore T. J. T., 2013, ApJS, 208, 11 McMullin J. P., Waters B., Schiebel D., Young W., Golap K., 2007, in Shaw
R. A., Hill F., Bell D. J., eds, ASP Conf. Ser. Vol. 376, Astronomical Data Analysis Software and Systems XVI. Astron. Soc. Pac., San Francisco, p. 127
Maud L. T., Moore T. J. T., Lumsden S. L., Mottram J. C., Urquhart J. S., Hoare M. G., 2015, MNRAS, 453, 645
Molinari S., Brand J., Cesaroni R., Palla F., 2000, A&A, 355, 617 Molinari S., Testi L., Rodr´ıguez L. F., Zhang Q., 2002, ApJ, 570, 758 Molinari S., Pezzuto S., Cesaroni R., Brand J., Faustini F., Testi L., 2008,
A&A, 481, 345
Neri R. et al., 2007, A&A, 468, L33
Ossenkopf V., Henning T., 1994, A&A, 291, 943 Palau A. et al., 2011, ApJ, 743, L32
Panagia N., Felli M., 1975, A&A, 39, 1
Purser S. J. D. et al., 2016, MNRAS, 460, 1039 Qiu K., Zhang Q., Wu J., Chen H.-R., 2009, ApJ, 696, 66
S´anchez-Monge ´A., Palau A., Estalella R., Kurtz S., Zhang Q., Di Francesco J., Shepherd D., 2010, ApJ, 721, L107
Saul M., 2015, ApJ, 809, 86
Scoville N. Z., Sargent A. I., Sanders D. B., Claussen M. J., Masson C. R., Lo K. Y., Phillips T. G., 1986, ApJ, 303, 416
Shepherd D. S., Watson A. M., 2002, ApJ, 566, 966
Simon T., Ayres T. R., Redfield S., Linsky J. L., 2002, ApJ, 579, 800 Stutz A. M. et al., 2013, ApJ, 767, 36
Takahashi S., Ho P. T. P., 2012, ApJ, 745, L10
Takahashi S., Saigo K., Ho P. T. P., Tomida K., 2012, ApJ, 752, 10 Tamura M., Ohashi N., Hirano N., Itoh Y., Moriarty-Schieven G. H., 1996,
AJ, 112, 2076
Testi L., Palla F., Natta A., 1999, A&A, 342, 515
Thompson A. R., Moran J. M., Swenson G. W., 1986, Interferometry and Synthesis in Radio Astronomy. Wiley-Intersci., New York
van Kempen T. A. et al., 2016, A&A, 587, A17
Varricatt W. P., Davis C. J., Ramsay S., Todd S. P., 2010, MNRAS, 404, 661 Yang J., Gurvits L. I., Frey S., Lobanov A. P., 2008, preprint
(arXiv:0811.2926)
Zhang Q., Hunter T. R., Brand J., Sridharan T. K., Cesaroni R., Molinari S., Wang J., Kramer M., 2005, ApJ, 625, 864
Zinnecker H., Yorke H. W., 2007, ARA&A, 45, 481