© 2016 The Author(s). This is an Open Access article distributed under the terms of the Creative Commons Attribution License
(http://creativecommons.org/licenses/by/3.0/). Published by The Geological Society of London. Publishing disclaimer: www.geolsoc.org.uk/pub_ethics
Journal of the Geological Society
Published online October 6, 2015 doi:10.1144/jgs2015-024 | Vol. 173 | 2016 | pp. 12–45Bedform and stratification: an overview
Primary current stratification is used extensively for the reconstruc-tion of deposireconstruc-tional processes and environments in the geological record (e.g. Stow 2005). Since the first recognition of the relation-ship between the type of sedimentary bedform and structure of lam-ination and bedding in sediments and sedimentary rocks (Sorby 1880; Darwin 1884; Ayrton 1910), the knowledge and conceived importance of primary current stratification has increased, such that there are now few sedimentary geologists who do not work with this class of sedimentary structures on a regular basis. Primary current stratification includes plane-parallel lamination, current ripple cross-lamination, dune cross-bedding, hummocky cross-stratification, wave ripple cross-lamination and many other types that are essential for the reconstruction of the type, direction and strength of palaeo-flow and sediment flux, and the type and spatio-temporal develop-ment of sedidevelop-mentary environdevelop-ments. In particular, the 1960s to early 1980s saw seminal publications concerning sedimentary structures, often through largely descriptive studies, by scientists such as John Allen and Mike Leeder in the UK; Arnold Bouma, Philip Kuenen, Joost Terwindt and Lambertus van Straaten in the Netherlands; Stanislav Dzulynski in Poland; Hans-Erich Reineck in Germany; and John Bridge, Donald Lowe, Gerry Middleton, Francis Pettijohn,
John Southard and Roger Walker in the USA and Canada. These publications are still widely used by many researchers today. This era of process sedimentology culminated in several popular refer-ence books (e.g. Leeder 1982; Allen 1984; Middleton & Southard 1984; Walker 1984; Reading 1986; Reineck & Singh 1986), and set the stage for developments that were more focused on investigations of the flow process rather than the morphology of bedforms. Indeed, two seminal contributions were influential in prompting this new era of investigation: the paper by Jackson (1976) that began to examine the links between the structure of turbulent boundary layers and bed-form bed-formation, and the paper by Leeder (1983) that outlined the importance of the trinity of flow, sediment transport and bedforms, and the series of links and feedbacks between them. Quantitative process sedimentology thus continued afresh and began to investi-gate the complex links between flow and morphology, taking advan-tage of new measurement technologies that allowed quantitative study of the turbulent flow field associated with bedforms. Starting from the 1970s, but primarily in the late 1980s and 1990s, significant advances were made in, for example, the fluid dynamics of a range of bedforms (McLean & Smith 1979; Bridge & Best 1988; Nelson & Smith 1989; Best 1992, 1993; Nelson et al. 1993; McLean et al. 1994; Bennett & Best 1995, 1996; Best 1996), the quantification of relationships between bedform dimensions and flow forcing (Baas
Predicting bedforms and primary current stratification in
cohesive mixtures of mud and sand
Jaco H. Baas
1*, James L. Best
2& Jeff Peakall
31 School of Ocean Sciences, Bangor University, Menai Bridge LL59 5AB, UK
2 Departments of Geology, Geography and GIS, Mechanical Science and Engineering and Ven Te Chow Hydrosystems
Laboratory, University of Illinois at Urbana–Champaign, 605 East Springfield Avenue, Champaign, IL 61820, USA
3 School of Earth and Environment, University of Leeds, Leeds LS2 9JT, UK
* Correspondence: [email protected]
Abstract: The use of sedimentary structures as indicators of flow and sediment morphodynamics in ancient sediments lies at the very heart of sedimentology, and allows reconstruction of formative flow conditions generated in a wide range of grain sizes and sedimentary environments. However, the vast majority of past research has documented and detailed the range of bedforms generated in essentially cohesionless sediments that lack the presence of mud within the flow and within the sediment bed itself. Yet most sedimentary environments possess fine-grained sediments and recent work has shown how the presence of this fine sediment may substantially modify the fluid dynamics of such flows. It is increasingly evident that understanding the influence of mud, and the presence of cohesive forces, is essential to permit a fuller interpretation of many modern and ancient sedimentary successions.
In this paper, the present state of knowledge on the stability of current- and wave-generated bedforms and their primary current stratification is reviewed, and a new extended bedform phase diagram is presented that summarizes the bedforms generated in mixtures of sand and mud under rapidly decelerated flows. This diagram provides a phase space using the vari-ables of yield strength and grain mobility as the abscissa and ordinate axes, respectively, and defines the stability fields of a range of bedforms generated under flows that have modified fluid dynamics owing to the presence of suspended sediment within the flow. Our results also present unique data on a range of bedforms generated in such flows, whose recognition is essential to help interpret such deposits in the ancient sedimentary record, including the following: (1) heterolithic stratifi-cation, comprising alternating laminae or layers of sand and mud; (2) the preservation of low-amplitude bed-waves, large current ripples and bed scours with intrascour composite bedforms; (3) low-angle cross-lamination and long lenses and streaks of sand and mud formed by bed-waves; (4) complex stacking of reverse bedforms, mud layers and low-angle cross-lamination on the upstream face of bed scours; (5) planar bedding comprising stacked mud–sand couplets. Furthermore, the results shown herein demonstrate that flow variability is not required to produce deposits consisting of interbedded sand and muds, and that the nature of flaser, wavy and lenticular bedding (sensu Reineck & Wunderlich 1968) may also need recon-sideration in the deposits of such sediment-laden flows.
1993, 1994, 1999; van Rijn 1993), the integration of bedform properties into more complete stability diagrams (Southard & Boguchwal 1990; van den Berg & van Gelder 1993), realization of the potential influence of fine sediment on flow and sediment trans-port (Gust 1976; Gust & Walger 1976; Lowe 1988; Best & Leeder 1993), exploration of the relationships between cross-strata thick-ness and bedform size (Paola & Borgman 1991; Best & Bridge 1992; Bridge & Best 1997; Leclair et al. 1997; Storms et al. 1999; Leclair 2002), and research on bedforms generated by combined flows; for example, hummocky cross-stratification (Harms et al. 1975; Dott & Bourgeois 1982; Leckie 1988; Cheel 1991). This new work on bedforms and sedimentary structures progressively led to the realization in the sedimentological community that existing pro-cess models for a range of sedimentary environments were too restricted to allow accurate interpretation of field observations (e.g. the Bouma sequence for sediment gravity flow deposits in deep-marine environments; Bouma 1962; Edwards et al. 1994; Kneller 1995; Haughton et al. 2003; Talling et al. 2004), and that detailed knowledge of small-scale processes is essential to interpret large-scale features (e.g. linking information from cores to information from seismic profiles). The expansion of hydrocarbon exploration into deeper water, and the development of unconventional resources, such as shale gas, undoubtedly added to the growing importance of process-based research.
Rationale and objectives
For all the advances in bedform dynamics made in the 20th century, the work largely focused on cohesionless sediments, with a conse-quent under-representation of the effect of fine, and potentially cohesive, sediment on the erosion, transport and deposition of sedi-ment in subaqueous environsedi-ments, and its implications for the tex-tural and structex-tural properties of sedimentary rocks in core and outcrop. This under-representation of cohesive sediments is all the more surprising as cohesive mud and clay are ubiquitous in most aquatic environments and sedimentary facies (Fig. 1; Healy et al.
2002; Schindler et al. 2015). Of particular importance, cohesive clay causes flows to change their turbulence properties in a non-linear, yet predictable, manner (Baas & Best 2002), suspended sediment to change its dynamic behaviour (Winterwerp & van Kesteren 2004; Schieber et al. 2007; Mehta 2013), and deposits to become more difficult to erode than pure sand (Mitchener & Torfs 1996).
The present paper summarizes past work on the development and stability of sedimentary bedforms in clay-free sediment, before addressing recent literature on the influence of cohesive fine-grained sediment on these bedforms. This influence has been shown to be highly significant; adding even a small volume of clay particles to a flow or to a sand bed leads to the development of bedform types with shapes and dimensions that are vastly different from those in pure sand (e.g. Lowe 1988; Baas et al. 2009, 2011, 2013; Schindler et al. 2015). To further demonstrate this influence, we also present a new comprehensive dataset on bedform dynam-ics below rapidly decelerated cohesive (mud–sand) sediment flows that extends the parameter space proposed by Baas et al. (2011) that focused on current ripples, to incorporate two further flow conditions: upper-stage plane beds and washed-out ripples. Based on the available and new data, an extension of existing bedform phase diagrams to mixed-sediment bedforms in rapidly deceler-ated flows is proposed.
Bedforms and primary current stratification
Bedforms in non-cohesive sediment
The frictional force between moving water and a substrate consisting of loose sediment causes the substrate to be reshaped into bedforms, if the critical shear stress for sediment motion is
exceeded (Shields 1936). At first order, the type of bedform thus formed is related to the type of flow, the size of the sediment par-ticles on the bed, and the strength of the flow (Guy et al. 1966). In sedimentary geology, as well as in hydraulic engineering, the char-acterization of these relationships for non-cohesive silt, sand and gravel is based on descriptive and empirical methods, because the physical processes responsible for the initiation, growth and stabil-ity of bedforms are still not fully known. Yet numerous scientific papers have investigated bed defects and wavelets that constitute the first expression of bedform development on a flat sediment bed, and their relation to coherent structures in the near-bed flow (Kennedy 1964, 1969; Allen 1968, 1979; Southard & Dingler 1971; Williams & Kemp 1971; Kaneko & Honji 1979; Richards 1980; Kobayashi & Madsen 1985; Best 1992, 1993, 1996; Rubin 1992; Baas 1994; Nelson et al. 1995; Coleman & Melville 1996; Coleman et al. 2003; Colombini 2004; Carling et al. 2005; Venditti
et al. 2005, 2006; Wierschem et al. 2008; Chou & Fringer 2010; Fourrière et al. 2010; Coleman & Nikora 2011; Bose & Dey 2012; Charru et al. 2013; Perillo et al. 2014a).
These incipient bedforms grow into larger bedforms whose geometric properties are closely related to flow type. The three principal types of flow defined in the geological literature to dis-tinguish between different types of bedform are: (1) unidirec-tional currents or long-period bidirecunidirec-tional currents, such as river flows, turbidity currents and tidal flows; (2) short-period oscilla-tory currents generated by water surface waves; (3) combined flows, in which unidirectional and oscillatory currents work together to reshape the sediment bed. For each of these flow types, models that define the relationship between the size of silt, sand or gravel particles on the bed and the strength of the flow have been proposed. These models comprise bedform phase dia-grams and mathematical equations (so-called bedform predic-tors), both based on data collected in laboratory flumes and under field conditions. Bedform phase diagrams are widely used in sedimentary geology, because observations in core and outcrop usually do not permit more than a qualitative reconstruction of flow properties from sediment size and bedform dimensions. Conversely, flow measurements in modern environments are used routinely by hydraulic engineers to predict the type, orienta-tion, height and wavelength of bedforms. Typical engineering workflows therefore comprise the use of bedform phase diagrams for the determination of bedform type and the subsequent use of bedform predictors for the calculation of bedform dimensions. The most comprehensive predictor for current-generated, wave-generated and combined-flow bedforms was proposed by Soulsby et al. (2012). Other widely used bedform predictors were proposed by Haque & Mahmood (1985), Baas (1993), van Rijn (1993), Julien & Klaassen (1995), Raudkivi (1997) and Karim (1999) for unidirectional currents, and by Nielsen (1981), van Rijn (1993), Wiberg & Harris (1994), Malarkey & Davies (2003), Grasmeijer & Kleinhans (2004), Williams et al. (2004, 2005), Camenen & Larson (2006), Yan et al. (2008), Camenen (2009), Pedocchi & Garcia (2009) and Nelson et al. (2013) for oscillatory currents.
Fig. 1.
W
orld map of surficial seabed sediment sizes, showing the dominance of muds and mixtures of sand and mud. Source: http://instaar
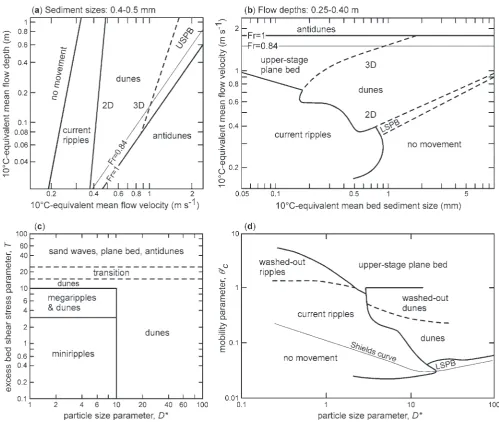
shown to reduce the overlap between bedform phases (e.g. Southard & Boguchwal 1990; van den Berg & van Gelder 1993). Southard & Boguchwal (1990) proposed a method that maintains flow velocity, flow depth and sediment size, but standardizes these variables to a water temperature of 10°C. Although the bedform phase diagram of Southard & Boguchwal (1990) for unidirectional flow is 3D (Fig. 2a and b), it uses parameters that many geological users are familiar with. van Rijn (1990, 1993) proposed a 2D bed-form phase diagram for unidirectional flow that uses the non-dimensional particle size parameter, D*, and the excess bed shear stress parameter, T (Fig. 2c):
D* g D
/
= −
ρ
ρs 1 ν 2
1 3
50 (1)
T=τ −τ τ
b b,cr
b,cr
′ (2)
where g is the acceleration due to gravity, ρs is the sediment den-sity, ρ is the water denden-sity, D50 is the median grain size of the bed sediment, ν is the kinematic viscosity of water, τb′ is the bed shear stress based on skin friction instead of form drag, and τb,cr is the critical bed shear stress for sediment movement. Another widely used 2D bedform phase diagram was proposed by van den Berg & van Gelder (1993), which uses D* (equation (1)) to describe the sediment properties, but uses the mobility parameter for cur-rents, θ′c, based on skin friction, to quantify the flow strength
(Fig. 2d):
θ τ
ρ ρ ρ
ρ
′ ′
′
c b
s s
=
− = −
g D
U D C
( ) 50
2
50 2
1 (3)
where U is the depth-averaged velocity and C′ is the Chézy drag coefficient based on skin friction. θ′c thus utilizing the initial flat
[image:4.595.52.552.57.479.2]bed conditions from which bedforms develop at different flow conditions as a reference.
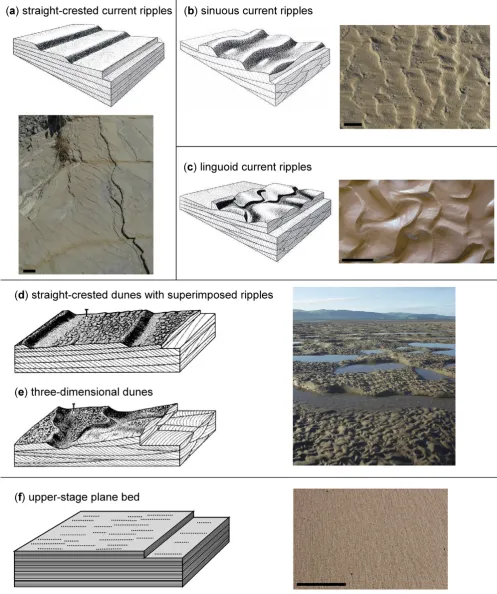
Principal bedform types in phase diagrams for unidirectional flows are current ripples (Fig. 3a–c), dunes (Fig. 3d and e), lower-stage plane bed and upper-lower-stage plane bed (Fig. 3f). Current rip-ples are the stable bedform phase at D* < 14.5, which is equivalent
to D50 = 700 μm for quartz-rich sediment, freshwater and a water temperature of 20°C, across a decreasing range of θ′c values, as D*
[image:5.595.42.540.64.659.2]respectively (Ashley 1990), but most current ripples are less than 0.03 m high and 0.3 m long. In the hydraulic engineering literature, a distinction is made between miniripples, megaripples and dunes (e.g. Fig. 2c), where the size of miniripples is independent of flow depth and the size of megaripples and dunes increases with increas-ing flow depth (e.g. van Rijn, 1989, 1993). The widely accepted depth independence of current ripples has recently been challenged by Bartholdy et al. (2015), who viewed ripple height as scaling to the thickness of a virtual boundary largely dictated by the bedform roughness. A distinction based merely on bedform size is more useful for the reconstruction of depositional processes from sedi-mentary facies in core and outcrop. Therefore, current-generated bedforms that are higher than 0.06 m and longer than 0.6 m have been defined as dunes for geological applications (Ashley 1990), and this definition is adopted herein. Dunes are the stable bedform phase at D* > 2.5, which is equivalent to D50 = 120 μm for quartz-rich sediment, freshwater and a water temperature of 20°C, across an increasing range of θ′c values, as D* is increased (Fig. 2d).
Hence, dunes progressively replace current ripples from D* = 2.5 to D* = 14.5, and current ripples are stable at lower θ′c values than dunes within this D* range. Current ripples and dunes are replaced by upper-stage plane bed conditions at high mobility parameters via a transitional phase of washed-out ripples (Chakraborty & Bose 1992; Baas & de Koning 1995) and washed-out dunes (Bridge 1981; Saunderson & Lockett 1983; Bridge & Best 1988; Chakraborty & Bose 1992; van Rijn 1993). These washed-out bed-forms tend to have the same wavelength as, but smaller heights than, the corresponding bedforms at lower θ′c values (Baas & de
Koning 1995). Washed-out bedforms often possess a more sym-metrical profile than classic current ripples and dunes in vertical cross-sections parallel to the main flow direction (Bridge 1981). Washed-out dunes may also possess a ‘humpback’-shaped longitu-dinal profile (Saunderson & Lockett 1983; Bridge & Best 1988). Strictly speaking, upper-stage plane beds are not flat; Bridge & Best (1988) and Best & Bridge (1992) discovered rapidly migrat-ing, low-amplitude, bed-waves upon upper-stage plane beds that were up to 10 mm high and 1 m long. Dunes are separated from the threshold curve for initiation of sediment movement in sediment coarser than c. 0.6 mm in diameter by lower-stage plane bed condi-tions, where very coarse sand and gravel are transported across a flat substrate without forming significant relief (e.g. Leeder 1980; Best 1996; Carling et al. 2005). Modern bedform stability dia-grams largely focus on bedforms in subcritical flow, but bedforms in supercritical flow, such as antidunes, chute-and-pools and cyclic steps, have been described in detail by Alexander et al. (2001) and Cartigny et al. (2014).
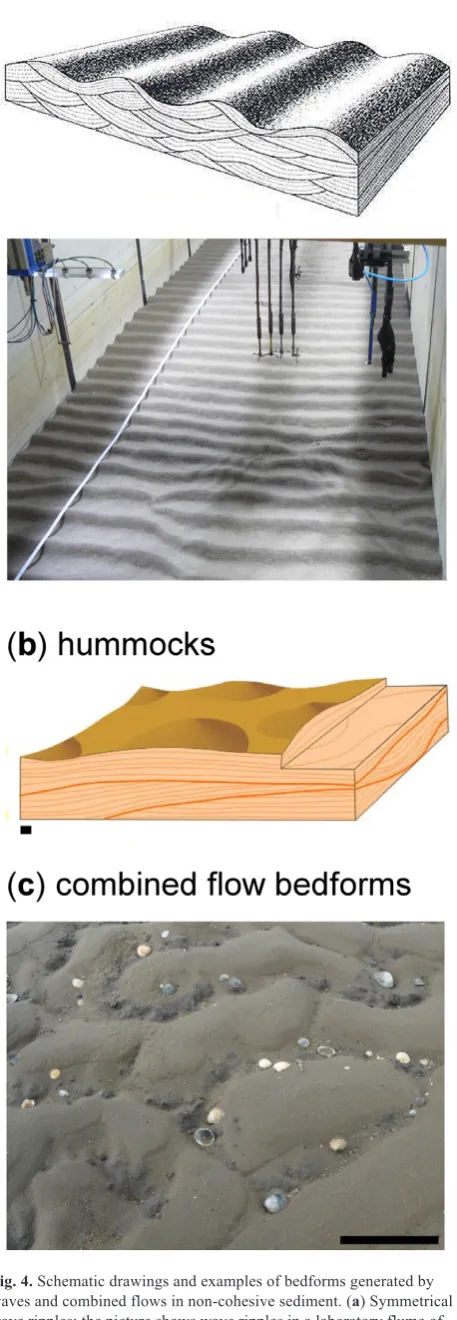
The main bedform types in phase diagrams for wave-generated bedforms are wave ripples (Fig. 4a), hummocks (Fig. 4b) and upper-stage plane beds. Allen (1984) proposed a comprehensive bedform phase diagram using maximum near-bed orbital velocity on the ordinate and mean sediment size on the abscissa (Fig. 5a). Kleinhans (2005) published a non-dimensional bedform phase diagram, based on a modified grain size parameter,
E* = 0.04789D* ≈ D50, with D* as in equation (1), and the wave-related mobility parameter, θ′w, which has the same form as θ′c in equation (3), but in which wave-related bed shear stress and maxi-mum near-bed orbital velocity replace current-related bed shear stress and depth-averaged velocity (Fig. 5b). In the bedform phase diagram of Kleinhans (2005), wave ripples are most prominent, covering the full range of D* values and the entire phase space between the threshold curve for the initiation of sediment move-ment and θ′w ≈ 1. Upper-stage plane bed conditions prevail at
θ′w > 1. Hummocks (sensu Southard et al. 1990) separate wave
[image:6.595.59.288.80.741.2]rip-ples from upper-stage plane beds across the full range of D* val-ues, but their precise range in terms of θ′w is unclear (Fig. 5b). Fig. 4. Schematic drawings and examples of bedforms generated by
Combined-flow bedforms (Fig. 4c) are controlled by a larger number of variables than current- and wave-generated bedforms, which hampers their classification in 2D phase space. The bedform phase diagrams for combined flows proposed by Arnott & Southard (1990), Dumas et al. (2005) and Perillo et al. (2014b) use maximum near-bed orbital velocity on the abscissa and mean flow velocity on the ordinate, whereas the bedform phase diagram of Kleinhans (2005) uses the non-dimensional equivalents θ′w and θ′c
(Fig. 6a). These diagrams do not account for the effect of grain size on bedform type, thus at present limiting the phase space to sand sizes between 90 and 250 μm. Yet distinct bedform types for com-bined flow have begun to emerge. Perillo et al. (2014b) subdivided bedforms according to degree of asymmetry, planform shape and size (Fig. 6b): (1) 2D symmetrical ripples, 3D symmetrical ripples and 3D symmetric dunes characterize wave-dominated combined flows; (2) 3D current ripples and current dunes are found in
rent-dominated combined flows; (3) combined flows in which cur-rents and waves have comparable strength form 3D asymmetric ripples, quasi-asymmetric ripples and asymmetric dunes; (4) all symmetrical and asymmetrical dunes change to an upper-stage plane bed at high current velocities and high maximum orbital velocities. The 3D asymmetric dunes of Perillo et al. (2014b) occupy the same phase space as the oriented hummocks of Kleinhans (2005). Lacy et al. (2007) investigated bedforms in combined flow, where the angle between the oscillating and unidi-rectional currents was 90°, 60° and 45°.
One of the main limitations of bedform stability diagrams and bedform predictors is that the bedforms are assumed to be in equi-Fig. 5. Phase diagrams for wave-generated bedforms. (a) Dimensional
[image:7.595.304.541.60.559.2]bedform phase diagram of Allen (1984); the contour lines denote the ratios of wave-ripple wavelength to height (i.e. vertical form index). (b) Non-dimensional bedform phase diagram of Kleinhans (2005); E* = 0.04789D*, which renders E* similar to D50 for a water temperature of 10°C. Modified after Allen (1984) and Kleinhans (2005).
[image:7.595.44.279.67.525.2]librium with the flow conditions. In reality, however, changes in bedform size and shape often lag behind changes in flow strength. This so-called bedform hysteresis effect has been studied in detail by, for example, Muller (1941), Raudkivi (1963), Alexander (1980), Tsujimoto & Nakagawa (1982), Lam Lau (1988), Raudkivi & Witte (1990), Baas (1994, 1999), Oost & Baas (1994), Betat
et al. (2002), Coleman et al. (2003), Rauen et al. (2009), Soulsby
et al. (2012), Nabi et al. (2013) and Perillo et al. (2014c) for cur-rent ripples, by Gee (1975), Allen (1976a–d, 1978); Allen & Friend (1976a,b), Fredsoe (1979), Wijbenga (1990), Gabel (1993), Coleman et al. (2003), Venditti et al. (2005), Martin & Jerolmack (2013) and Nabi et al. (2013) for current-generated dunes, and by Faraci & Foti (2002), Austin et al. (2007), Lacy et al. (2007), Chou & Fringer (2010), Soulsby et al. (2012), Calantoni et al.
(2013) and Perillo et al. (2014c) for wave-generated bedforms and combined flow bedforms. The adaptation time of bedforms to a change in flow forcing increases with increasing equilibrium size of the bedforms, increasing sediment size and decreasing flow strength (e.g. van Rijn 1993; Baas 1994, 1999; Soulsby et al. 2012; Perillo et al. 2014c). Because flow velocities in nature are prone to rapid temporal variations, many natural bedforms continuously try to adapt to changes in flow velocity without reaching a state of equilibrium, or at best maintain equilibrium for a short period of time. Likewise, bedforms in the sedimentary record are most likely to have been preserved in a non-equilibrium state. Dunes, in par-ticular, are affected by bedform hysteresis, because of their large size and the close relationship of their size to water depth and flow velocity (e.g. van Rijn 1993). Several studies have found that changes in dune height and wavelength lag behind changes in flow discharge during the rising and falling stages of river floods (e.g. Wijbenga & Klaassen 1983; Iseya 1984). This time lag is usually greater during the falling stage of the flood, and dune wavelength lags further behind changes in flow discharge than dune height. Consequently, Iseya (1984) found that dune wavelength increased during both the rising and falling limbs of the flood, suggesting that equilibrium was never achieved, whereas dune height started to decrease shortly after peak discharge, implying that equilibrium dune height had been reached.
Current-ripple hysteresis is less complicated than dune hysteresis, because the volume of sand within current ripples is considerably less than within dunes and the equilibrium dimensions of current ripples are independent of flow strength (Baas 1994, 1999). Current ripples thus grow in height and wavelength as long as the bed shear stress is above the Shields threshold for sediment motion and below the phase boundary with washed-out ripples. The growth rate of cur-rent ripples increases with increasing bed shear stress, and the equi-librium size of current ripples is merely a function of bed sediment size (Baas 1993; Raudkivi 1997; Soulsby et al. 2012; Bartholdy
et al. 2015). Baas (1994, 1999) recognized that all current ripples develop from a flat bed to their equilibrium size via a predictable sequence of plan forms: incipient ripples, straight-crested ripples (Fig. 3a), sinuous ripples (Fig. 3b) and linguoid ripples (Fig. 3c). This progressive increase in three-dimensionality has been used to determine the development stage of current ripples in modern and ancient environments (e.g. Baas 1993; Oost & Baas 1994).
The development of current-generated bedforms on a flat bed can be described by an asymptotic curve (e.g. Perillo et al. 2014c):
Xt=Xe(1−eαt) (4)
where X is the bedform height or wavelength, t is time, α is the bedform adaptation constant, which varies with flow strength, and subscripts t and e denote actual and equilibrium values, respec-tively. Equation (4) is also applicable to wave ripples and com-bined flow bedforms (Perillo et al. 2014c); yet Baas et al. (2014)
inferred from flume experiments that wave ripples develop at a faster rate than current ripples.
Primary current stratification in non-cohesive
sediment
Common types of primary current stratification generated by bed-forms in non-cohesive silt, sand and gravel have been described in detail in many sedimentological textbooks (e.g. Blatt et al. 1980; Leeder 1982; Allen 1984; Reineck & Singh 1986; Stow 2005), Here, we provide a short summary of these sedimentary structures for the benefit of subsequent comparison with stratification types for cohesive bedforms in mixtures of sand and mud.
Current ripples and dunes move in a downflow direction by ero-sion of sediment from the gently dipping upstream face of the bed-forms and deposition by avalanching of bedload and settling of suspended load onto the steep, downstream face of the bedforms. This migration process may lead to the preservation of high-angle lamination for current ripples (Fig. 7a) and high-angle cross-bedding for dunes (Fig. 7b), especially if bed aggradation has taken place. However, Best & Kostaschuk (2002) showed that dunes and their cross-bedding may also adopt an angle less than the angle-of-repose. In vertical cross-section, current ripple and dune cross-stratification may be tabular, sigmoidal or tangential, depending on the shape of the leeside profile, and bounding sur-faces between sets of cross-stratification may be planar tabular, planar wedge-shaped or trough-shaped, depending on the 3D form of the associated bedforms and the orientation of the cross-section relative to the flow direction. Lower- and upper-stage plane beds form plane-parallel lamination on beds that experience net deposi-tion (Fig. 7a), although the laminadeposi-tion is often faint on lower-stage plane beds. Bedforms in unidirectional supercritical flows, such as antidunes and cyclic steps, display a complex internal stratifica-tion, described in detail by Alexander et al. (2001) and Cartigny
et al. (2014).
Primary current lamination within symmetrical wave ripples is characterized by chevron-like cross-lamination (Fig. 7c), associ-ated with alternating periods of avalanching bedload and settling suspended load on either side of the bedform during passage of water surface waves. Often, however, this wave-ripple cross-lam-ination displays a slight asymmetry, associated with weakly asymmetrical wave ripples, because wave ripples tend to migrate slowly in the direction of shallower water. Hummocks are circular to elliptical in plan form with heights of up to several tens of dec-imetres and wavelengths of up to c. 5 m (Harms et al. 1975; Dott & Bourgeois 1982). Hummocky cross-stratification is domi-nated by low-angle, curved lamination. The laminae drape the hummocks and the troughs, or so-called swales, between the hummocks (Fig. 7d). Slow migration of the hummocks under bedload traction and simultaneous suspension settling produces inclined truncation surfaces that separate sets of hummocky cross-stratification.
The primary stratification formed by bedforms in combined flow may be difficult to distinguish from the stratification formed by pure current- and wave-generated bedforms (Dumas et al.
2005). This interpretative process is further complicated by the fact that the angles of approach of the current and the waves may be different (Lacy et al. 2007). Hence, the primary stratification within combined-flow bedforms can be dominated by wave rip-ple cross-lamination or high-angle cross-stratification, depend-ing on whether waves or currents are the dominant process in the formation of the bedforms. Bedforms in combined flow usually have a more 3D plan form than wave ripples (Perillo
Fig. 7. Field examples of primary current stratification. (a) Plane-parallel lamination generated by aggrading upper-stage plane beds (below white line) and climbing cross-lamination generated by current ripples (above white line) in a turbidite (Aberystwyth Grits Formation, west Wales, UK). (b) Large-scale cross-bedding formed by dunes in a shallow-marine environment (Millstone Grit, Brimham Rocks, northern England, UK). (c) Cross-lamination generated by wave ripples in heterolithic sedimentary rock (Carboniferous Tullig Cyclothem, County Clare, Ireland). (d) Hummocky cross-stratification from the Bencliff Grit, Dorset, UK; photograph kindly provided by Peter Burgess.
[image:9.595.40.388.542.788.2]Bedforms and primary current stratification in
cohesive sediment
Despite the dominance of cohesive fine-grained sediment in mod-ern and ancient aquatic environments (e.g. Flemming 2002), bed-form development in cohesive sediments has not received nearly as much attention as in non-cohesive sediments. Below, we pro-vide an overview of the existing knowledge of bedform properties within cohesive mud and, in particular, within mixtures of mud and non-cohesive sediment, before presenting the results of new laboratory experiments on bedform development below rapidly decelerated flows laden with mixtures of sand, silt and clay.
Bedforms do not form in pure non-flocculated mud, because these small particles travel in suspension rather than as bedload, and bed-load transport is a key requirement for bedform development (Allen 1984; Chang & Flemming 2013). Moreover, pure non-flocculated mud is too cohesive for the generation of ripples, dunes and their pri-mary current stratification; instead, erosional structures such as groove casts, cut-and-fills and flute casts prevail (Allen 1984). However, ground-breaking work by Schieber et al. (2007) has revealed that silt- and sand-sized mud aggregates can be strong enough to participate in the formation of small-scale bedforms that consist entirely of mud floccules. This ‘floccule ripple’ concept has since been used as evi-dence that mudstones do not necessarily represent suspension settling of mud in standing water. For example, Schieber & Yawar (2009) and Schieber (2011) attributed fine lamination in mudstones to floccule ripples formed in flows with velocities of up to 0.3 m s−1.
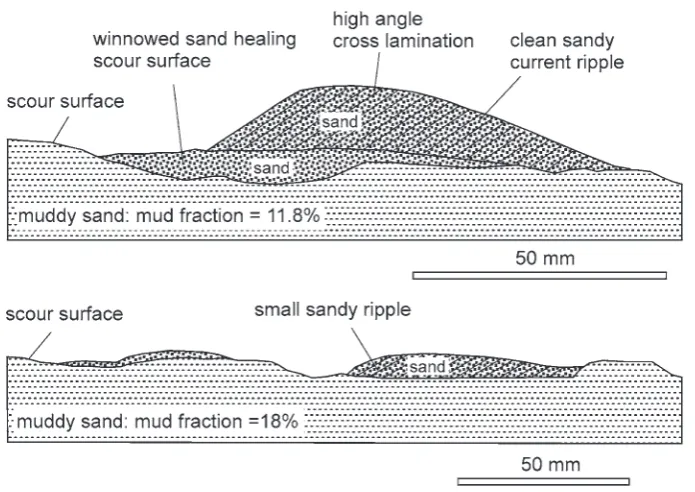
Rather than pure mud, mixtures of cohesive clay and non-cohesive sand are more suitable for bedform development if the bed clay frac-tion, and therefore the cohesive strength of the bed, is sufficiently low to allow the flow to shape the bed into bedforms. In physical terms, this means that the bed yield strength needs to be lower than the bed shear stress imposed by the flow for bedform development to take place (Mitchener & Torfs 1996). This process is accompanied by grad-ual entrainment, or winnowing, of the clay particles into suspension,
whereas the sand grains remain in the bedload layer (e.g. Wang et al.
1988; Liang et al. 2007). The available data suggest that these mixed-sediment bedforms are smaller than in pure sand, even at clay bed fractions below 3% (Basaniak & Verhoeven 2008; Baas et al. 2013; Schindler et al. 2015; Fig. 8). However, Baas et al. (2013) also found that current ripples develop at a significantly slower rate in mixed cohesive sediment than in pure sand, and so it cannot yet be dis-counted that current ripples in mixed cohesive sediment eventually reach the same equilibrium dimensions as current ripples in pure sand. This contention would support the observation that current rip-ples in sediment affected by biological cohesion appear to attain similar equilibrium dimensions, if sufficient time is allowed for their formation (Malarkey et al. 2015). Moreover, a preliminary study by Baas et al. (2014) showed that clay winnowing is a highly effective process during wave ripple development, and the equilibrium size of wave ripples is independent of the initial bed clay fraction.
Bedform development on cohesive mixed sand–mud beds (Baas
[image:10.595.56.402.60.384.2]et al. 2013) is significantly different from bedform development below clay-laden flows that are affected by turbulence modulation (Baas et al. 2009, 2011; Fig. 9). Turbulent flows without sus-pended fine sediment and moving over a flat surface develop a boundary layer profile that is logarithmic in shape and in which turbulence generation is greatest in the zone of near-bed shear. As fine sediment is added to a flow, the fluid begins to display a range of transitional behaviours, as turbulence becomes modulated by the presence of the particles, which encompass four stages (Fig. 10): (1) drag reduction or turbulence-enhanced transitional flow; (2) lower transitional plug flow; (3) upper transitional plug flow; (4) quasi-laminar plug flow (Baas et al. 2009). The first evi-dence of boundary layer modulation is witnessed as a drag-reduc-ing behaviour (Gust 1976; Gust & Walger 1976; Best & Leeder 1993; Chanson 1994; Li & Gust 2000; Dyer et al. 2002), in which a thickened viscous sublayer (Caldwell & Chriss 1979) is gener-ated at the bed. These studies have shown that the slope of the downstream velocity gradient and root mean square values of this Fig. 9. Examples of bedforms generated below rapidly decelerated mixed sand–silt–clay flows at a depth-average flow velocity of 0.4 m s−1. Modified after
component, RMS(u′), near the bed are increased towards a point of maximum drag reduction, but after this point these values begin to decline (Ptasinski et al. 2001). RMS(u′) is a measure of turbulence production. The peak value of RMS(u′) also moves away from the wall as sediment concentration increases, linked to shear at the top of the thickened sublayer. It has been suggested that such thicken-ing of the viscous sublayer and change in velocity gradient are a product of decreasing mixing in this near-bed flow that is caused by a stabilization of the boundary layer streaks and a reduction in the rate of bursting of low-momentum fluid upwards into the flow (de Angelis et al. 2002; Li et al. 2006). This in turn reduces inter-actions between the inner and outer regions of the flow (Kim & Sirviente 2005). Measurements in clay-laden flows (Wang & Plate 1996; Baas & Best 2002, 2009; Baas et al. 2009) have shown a dis-tinct ‘sawtooth’ pattern in the at-a-point time series from near the top
of the viscous sublayer. This phase of turbulence enhancement at low fine-sediment concentrations is linked to shear occurring at the edge of the growing viscous sublayer, on which Kelvin– Helmholtz instabilities are generated. This situation thus provides a thickened region of low velocity near the bed that is capped by a shear layer with the flow above, this creating a ‘shear sheltering’ effect (Hunt & Durbin 1999; Zaki & Saha 2009) and a perturbed vortical shear layer. Several studies have shown that there is a point of maximum drag reduction (Ptasinski et al. 2003; Dubief
et al. 2010), beyond which there is a decrease in RMS(u′). As the volumetric concentration of clay is increased, shear at the top of the thickened sublayer may still generate enhanced turbulence, in relation to the clearwater state, whereas shear in the outer flow is insufficient to break up the clay flocs. In this zone, a plug flow begins to develop in which downstream velocity is invariant with depth. Baas et al. (2009) termed this second stage of turbulence modulation a ‘lower transitional plug flow’ (Fig. 10c). This flow type is characterized by turbulence enhancement near the bed, but turbulence attenuation in the outer flow. The third stage of turbu-lence modulation occurs when turbuturbu-lence near the bed is unable to break the increasingly strong clay chains, and near-bed turbulence becomes dampened. At this stage, the plug flow zone also further extends down from the water surface; such flows with attenuated turbulence both near the bed and in the outer flow have been termed upper transitional plug flows (Fig. 10d; Baas et al. 2009). Lastly, as clay concentration yields longer chains and perhaps gels of stronger clay bonds develop, the fluid eventually adopts a veloc-ity profile in which the downstream velocveloc-ity gradient is invariant through the flow depth, except for a thin basal shear zone. In this quasi-laminar plug flow regime (Fig. 10e; Baas et al. 2009), turbu-lence levels are further lowered and only minimal turbuturbu-lence is generated in the thin basal shear layer.
Higher turbulence production over current ripples than over flat beds causes a rise in the threshold clay concentrations for the development of transitional and quasi-laminar plug flow (Baas & Best 2008; Baas et al. 2009), because the breakage of cohesive bonds between clay particles is favoured in flow over bedforms. Likewise, turbulence modulation varies spatially along a bedform profile in accordance with spatial variations in turbulence produc-tion (Baas & Best 2008). Hence, regions of high turbulence pro-duction (e.g. on the crest and flow-facing slope of the bedform) exhibit gelling at higher suspended clay concentrations than regions of low turbulence production (e.g. in the lee of the bedform crest). In addition to the formation of floccule ripples and associ-ated laminassoci-ated sequences that contain evidence for deposition by currents rather than suspension settling in standing water (Schieber
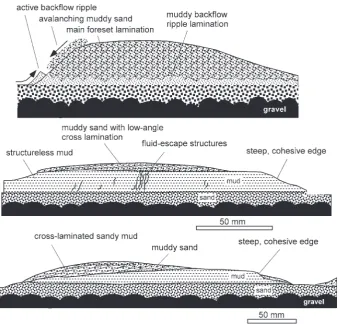
[image:12.595.54.292.61.404.2]et al. 2007; Schieber 2011; Chang & Flemming 2013), cohesive suspended sediment may take part in bedform development in sev-eral other ways: (1) it has been proposed that, during low flow stages and slack water in mixed sand–mud tidal environments, the mud may form thin drapes across ripples and dunes that develop at high flow stages, accreting into inclined heterolithic stratification (IHS; Thomas et al. 1987; Choi 2010; Sato et al. 2011; Fig. 11a); Fig. 11. (a) Lenticular bedding in the Silurian Gray Sandstone
(Pembrokeshire, UK), interpreted as tide-dominated distal delta front facies by Hillier & Morrissey (2010). (b) Sediment gravity flow deposit with ‘streaky’ bedding in the deep-marine Silurian Aberystwyth Grits Formation, west Wales, UK.
[image:12.595.61.550.672.766.2](2) at high suspended clay concentrations and high sedimentation rates, cohesive sediment may become trapped as fluid mud in the troughs of bedforms, where the fluid mud is protected from ero-sion by the upstream bedform crest (Baas et al. 2011; Becker et al.
2013); (3) at high suspended clay concentrations in depositional transitional plug flows subjected to flow turbulence modulation, Baas et al. (2011) found unique bedform types that comprise alter-nating laminae of non-cohesive and cohesive sediment, as well as
fully mixed cohesive and non-cohesive sediment. The precise tex-ture and structex-ture of these bedforms are dependent on the rate of flow deceleration, initial suspended fine sediment concentration, settling velocity of the cohesive and non-cohesive particle frac-tions, and duration of bedform migration. The size of these bed-forms showed a strong positive correlation with near-bed flow turbulence, with the largest bedforms found below turbulence-enhanced lower transitional plug flow (Baas et al. 2011). MacKay
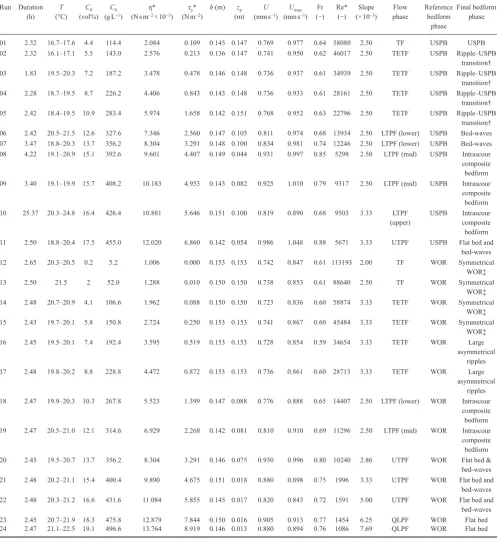
Run Duration (h) T (°C) C0 (vol%) C0
(g L−1)
η* (N s m−2 × 10⁻³)
τy*
(N m−2)
h (m) zp
(m)
U
(mm s−1) Umax
(mm s−1)
Fr (−)
Re* (−)
Slope (× 10−3)
Flow phase Reference bedform phase Final bedform phase
01 2.32 16.7–17.6 4.4 114.4 2.084 0.109 0.145 0.147 0.769 0.977 0.64 58080 2.50 TF USPB USPB
02 2.32 16.1–17.1 5.5 143.0 2.576 0.213 0.136 0.147 0.741 0.950 0.62 46017 2.50 TETF USPB Ripple–USPB
transition†
03 1.83 19.5–20.3 7.2 187.2 3.478 0.478 0.146 0.148 0.736 0.937 0.61 34939 2.50 TETF USPB Ripple–USPB
transition†
04 2.28 18.7–19.5 8.7 226.2 4.406 0.843 0.143 0.148 0.736 0.933 0.61 28161 2.50 TETF USPB Ripple–USPB
transition†
05 2.42 18.4–19.5 10.9 283.4 5.974 1.658 0.142 0.151 0.768 0.952 0.63 22796 2.50 TETF USPB Ripple–USPB
transition†
06 2.42 20.5–21.5 12.6 327.6 7.346 2.560 0.147 0.105 0.811 0.974 0.68 13934 2.50 LTPF (lower) USPB Bed-waves
07 3.47 18.8–20.3 13.7 356.2 8.304 3.291 0.148 0.100 0.834 0.981 0.74 12246 2.50 LTPF (lower) USPB Bed-waves
08 4.22 19.1–20.9 15.1 392.6 9.601 4.407 0.149 0.044 0.931 0.997 0.85 5298 2.50 LTPF (mid) USPB Intrascour
composite bedform
09 3.40 19.1–19.9 15.7 408.2 10.183 4.953 0.143 0.082 0.925 1.010 0.79 9317 2.50 LTPF (mid) USPB Intrascour
composite bedform
10 25.37 20.3–24.8 16.4 426.4 10.881 5.646 0.151 0.100 0.819 0.890 0.68 9503 3.33 LTPF
(upper)
USPB Intrascour composite bedform
11 2.50 18.8–20.4 17.5 455.0 12.020 6.860 0.142 0.054 0.986 1.048 0.88 5671 3.33 UTPF USPB Flat bed and
bed-waves
12 2.65 20.3–20.5 0.2 5.2 1.006 0.000 0.153 0.153 0.742 0.847 0.61 113193 2.00 TF WOR Symmetrical
WOR‡
13 2.50 21.5 2 52.0 1.288 0.010 0.150 0.150 0.738 0.853 0.61 88640 2.50 TF WOR Symmetrical
WOR‡
14 2.48 20.7–20.9 4.1 106.6 1.962 0.088 0.150 0.150 0.723 0.836 0.60 58874 3.33 TETF WOR Symmetrical
WOR‡
15 2.43 19.7–20.1 5.8 150.8 2.724 0.250 0.153 0.153 0.741 0.867 0.60 45484 3.33 TETF WOR Symmetrical
WOR‡
16 2.45 19.5–20.1 7.4 192.4 3.595 0.519 0.153 0.153 0.728 0.854 0.59 34654 3.33 TETF WOR Large
asymmetrical ripples
17 2.48 19.8–20.2 8.8 228.8 4.472 0.872 0.153 0.153 0.736 0.861 0.60 28713 3.33 TETF WOR Large
asymmetrical ripples
18 2.47 19.9–20.3 10.3 267.8 5.523 1.399 0.147 0.088 0.776 0.888 0.65 14407 2.50 LTPF (lower) WOR Intrascour
composite bedform
19 2.47 20.5–21.0 12.1 314.6 6.929 2.268 0.142 0.081 0.810 0.910 0.69 11296 2.50 LTPF (mid) WOR Intrascour
composite bedform
20 2.45 19.5–20.7 13.7 356.2 8.304 3.291 0.146 0.075 0.930 0.996 0.80 10240 2.86 UTPF WOR Flat bed &
bed-waves
21 2.48 20.2–21.1 15.4 400.4 9.890 4.675 0.151 0.018 0.880 0.898 0.75 1996 3.33 UTPF WOR Flat bed and
bed-waves
22 2.48 20.3–21.2 16.6 431.6 11.084 5.855 0.145 0.017 0.820 0.843 0.72 1591 5.00 UTPF WOR Flat bed and
bed-waves
23 2.45 20.7–21.9 18.3 475.8 12.879 7.844 0.150 0.016 0.905 0.913 0.77 1454 6.25 QLPF WOR Flat bed
24 2.47 21.1–22.5 19.1 496.6 13.764 8.919 0.146 0.013 0.880 0.894 0.76 1086 7.69 QLPF WOR Flat bed
T, mean fluid temperature; C0, initial suspended sediment concentration (t c. 1 min); η, dynamic viscosity of flow; τy, yield strength of flow; h, flow depth; zp, height of base of
plug flow region; U, depth-averaged velocity; Umax, maximum velocity in vertical profile; Fr, Froude number; Re, flow Reynolds number after Liu & Mei (1990); TF, turbulent
flow; TETF, turbulence-enhanced transitional flow; LTPF, lower transitional plug flow; UTPF, upper transitional plug flow; QLPF, quasi-laminar plug flow; USPB, upper stage plane bed; WOR, washed-out ripples.
*This parameter is calculated using C0.
[image:13.595.43.541.76.619.2]& Dalrymple (2011) published the first examples of these mixed cohesive sediment bedforms in sediment cores, but a wider range of experimental conditions is needed to obtain a full appreciation of the variety of bedform types and nature of primary current strat-ification formed by flows, and on beds, that contain mixtures of cohesive mud and non-cohesive sediment of different grain sizes. In particular, the interpretation of deep-marine sedimentary facies with enigmatic ‘streaky’ and banded facies (e.g. Fig. 11b) would benefit from such experiments. Below, a new series of laboratory experiments on bedform development in mixed sand–mud below rapidly decelerated flows is presented. These experimental data exemplify the potentially great importance of cohesive forces in shaping bedforms and their sedimentary structures.
Extending the phase space of bedform
development in rapidly decelerated flows
Experimental setup and method
Twenty-four laboratory experiments were conducted using the 8.75 m long and 0.3 m wide slurry flume in the Sorby Environmental Fluid Dynamics Laboratory, University of Leeds (Fig. 12; Table 1). The principal aim of these experiments was to extend the parame-ter space of the laboratory experiments conducted by Baas et al.
(2011) that examined the changes in size, shape and internal organization of current ripples below rapidly decelerated mud– sand flows to washed-out ripples (sensu Baas & de Koning 1995) and upper-stage plane beds. This new series of experiments used the same experimental setup and method as Baas et al. (2011). Mixtures of freshwater, cohesive kaolin clay and non-cohesive silt and sand were circulated through the flume by means of a variable-discharge, open-structure, slurry pump with minimal flow distur-bance. The kaolin clay used in the experiments had a median diameter, D50, of 0.0073 mm, and the grain size of the mixed silt and sand was bimodally distributed, with D50 = 0.085 mm and modal sizes of 0.048 and 0.300 mm (see fig. 5 of Baas et al. 2011). The flows moved over a fixed bed of medium-sized pebbles with a roughness height of c. 8 mm along the entire length of the flume, to keep all sediment suspended at high initial flow discharge (c. 50 L−1, equivalent to a mean flow velocity of 1.2 m s−1), and thus
establish a steady-state suspension flow before the start of each experiment. After the flows had recirculated at 50 L s−1 for several
minutes, the discharge was reduced instantaneously to c. 35 L s−1 in
Runs 01–11 and c. 33 L s−1 in Runs 12–24. This caused the gravel
bed to be rapidly covered by sediment settling from suspension, producing an initial flat bed on which bedform development could take place. Runs 01 and 12 were control runs with low clay content (Table 1) that generated an upper-stage plane bed and washed-out ripples, respectively. These bedform types were thus used as a ref-erence for the runs with higher clay content. The present experi-ments were then integrated with those forming current ripples, where flows were instantaneously reduced from c. 50 to c. 19 L s−1
(Baas et al. 2011).
The development of the bed and bed–flow interactions were monitored through the sidewall of the flume using digital photo-graphs, line drawings and detailed sedimentological descriptions. The changing size and shape of the bedforms were tracked and then compared with depth-averaged flow velocity, U, derived from the downstream component of temporal mean velocity, U, at eight or more heights, z, above the sediment bed as measured using ultrasonic Doppler velocimetry profiling (UDVP; Takeda 1991; Best et al. 2001; Baas & Best 2002, 2008; Baas et al. 2009). As in the study by Baas et al. (2011), depth-averaged flow velocity was calculated using a curve-fitting procedure based on the logarithmic law for wall-bounded shear flows (e.g. van Rijn 1990) for turbu-lent and low-concentration transitional flows. The Coles wake
function (Coles 1956; Wang & Plate 1996; Wang et al. 2001) was used for high-concentration transitional and quasi-laminar plug flows (sensu Baas et al. 2009). The horizontal component of turbu-lence intensity at each height above the bed was approximated by the root mean square of the temporal mean flow velocity, RMS(u′), which is equal to the standard deviation of U, at each height above the bed (see Baas et al. 2011). Table 1 lists the depth-averaged and maximum flow velocities, Froude numbers and Reynolds numbers derived from U (following procedures described by Baas et al.
2009). In the present study, the depth-averaged velocity was 0.84 ± 0.1 m s−1 for the upper-stage plane bed Runs 01–11, and
0.81 ± 0.1 m s−1 for the washed-out ripple Runs 12–24. Flow depths
were generally between 0.140 and 0.155 m (Table 1).
Siphon tubes connected to peristaltic pumps were used to col-lect suspension samples to determine the volumetric sediment con-centration through standard weighing and drying. The suspended sediment concentration, C0, was measured near the bed within 1 min after initial flow deceleration. Mean suspended sediment concentration, Ce, was calculated from siphon data near the end of each run. The pre-deceleration concentration of non-cohesive sed-iment within the flows was constant at c. 3%. Volumetric kaolin concentrations were between 0.2 and 19.1% (i.e. between 5 and 500 g L−1), encompassing the flow phases where turbulence
modu-lation and full turbulence suppression are expected (Baas et al.
2009). As in the study by Baas et al. (2011), the dynamic viscosity, η, and yield strength, τy, of the kaolin suspensions were approxi-mated from the measured suspended-sediment concentrations using the empirical power-law equations of Wan (1982).
General observations
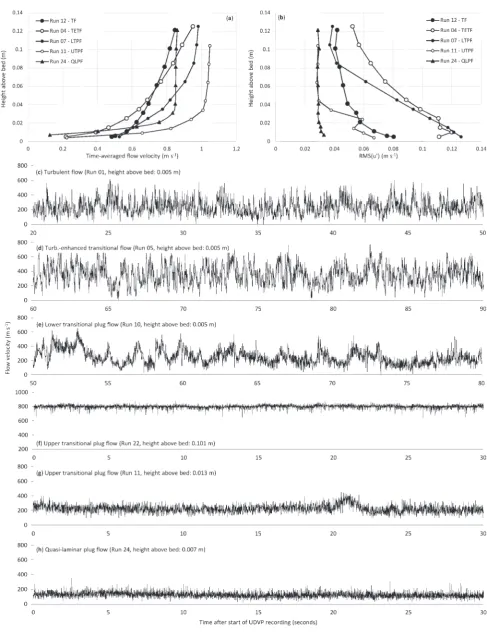
The laboratory experiments covered the full range of turbulent, transitional and quasi-laminar flow of Baas et al. (2009) (Table 1). The flow types at various stages of bedform development and sus-pended clay concentration (see Baas et al. 2009) were delimited based on the following: (1) the shape of vertical profiles of U, RMS(u′) and the ratio of these parameters, RMS(u′)0:
RMS( )u RMS( )u U
′0= ′ 100 (5)
to identify plug flows, turbulence enhancement and turbulence atten-uation; (2) the near-bed values of RMS(u′) and RMS(u′)0, which are high for turbulence-enhanced transitional flow and lower transitional plug flow, low for upper transitional plug flow and quasi-laminar plug flow, and intermediate for turbulent flow; (3) flow Reynolds numbers, which decrease in a predictable manner from high in turbu-lent flow to low in quasi-laminar plug flow; (4) the time-series of instantaneous streamwise velocity at various heights above the bed to identify near-bed, ‘sawtooth’-shaped, velocity fluctuations, mid-flow negative velocity spikes and plug flow signatures (Baas & Best 2002; Baas et al. 2009). Figure 13 shows representative examples of each flow type, which compare well with previous experiments (e.g. Baas & Best 2002; Baas et al. 2009, 2011).
washed-out ripples and upper-stage plane beds change as a func-tion of initial suspended clay concentrafunc-tion. Below, this will be achieved by describing and interpreting the characteristic bedform
[image:15.595.48.536.54.691.2]properties for the five main types of clay flow (Baas et al. 2011): turbulent flow, turbulence-enhanced transitional flow, lower and upper transitional plug flow and quasi-laminar plug flow.
Fig. 14. Reference bedforms in turbulent flow. (a) Upper-stage plane bed in Run 01. (b) Washed-out ripples in Run 13. t, time since the start of the experiment.
Reference bedforms in turbulent flow
Run 01 (C0 = 4.5%) produced an upper-stage plane bed (USPB) that persisted until the end of the experiment (Fig. 14a). The veloc-ity profiles of Run 01 were almost perfectly logarithmic (R2 > 99.4%), and there was no indication of turbulence
enhance-ment at this low suspended clay concentration (Fig. 13c). Near-bed RMS(u′) was lower than in Run 02 (C0 = 5.5%), which further sug-gests that this run can be classified as a ‘classic’ turbulent flow.
Immediately after initial flow deceleration in Run 12 (C0 = 0.2%) and Run 13 (C0 = 2.0%), washed-out ripples (WOR) appeared on the sand-rich sediment bed. These bedforms were c. 0.115 m long and c.
0.005 m high (Fig. 14b). Their migration rate was so high that after c.
0.5 h most sediment had moved beyond the downstream end of the measurement window without being recirculated fast enough to reap-pear in the upstream end of the measurement window. Although this left part of the underlying gravel bed exposed to the flow, the flow dynamics were similar to those in Run 01. High Reynolds numbers, lack of turbulence enhancement and statistically significant logarith-mic best fits for horizontal flow velocity (Fig. 13a) all indicate that these flows behaved in a similar way to clay-free turbulent flows.
The turbulent flow described by Baas et al. (2011) had a depth-averaged flow velocity of 0.46 m s−1, which is lower than in Runs
01, 12 and 13 of the present study. Consequently, the turbulent flow of Baas et al. (2011) produced current ripples with an equilib-rium height and wavelength of 13 mm and 109.8 mm, respectively. These data also conform to the previous experimental data of Baas & de Koning (1995), who found ripples with a wavelength similar to the washed-out ripples in Runs 12 and 13, but the current ripples had a significantly greater height than the washed-out ripples.
Bedforms in turbulence-enhanced transitional flow
The USPB-analogous Runs 02 (C0 = 5.5%), 03 (C0 = 7.2%), 04 (C0 = 8.7%) and 05 (C0 = 10.9%) were all conducted withturbulence-enhanced transitional flows, based on the following hydrodynamic data (Fig. 13a and d): (1) lower U and higher RMS(u′) and RMS(u′)0 values than at the lower initial suspended clay concentrations in the reference run (Run 01); (2) a slight con-vex-upward excursion from a linear best-fit between U and ln(z) (compare fig. 8 of Baas et al. 2009); (3) flow Reynolds numbers within, or close to, the expected range for turbulence-enhanced tran-sitional flow; (4) strong, multi-frequency, fluctuations in the veloc-ity time-series (Fig. 13d). The bedforms changed with increasing initial clay concentration from a mixture of USPB and large asym-metrical ripples (5.5% < C0 < 8.7%) to a bed covered with irregular bedforms that ranged from large symmetrical ripples to large ripples with normal and reversed asymmetry (C0 = 10.9%; Fig. 15). The height and wavelength of these bedforms was 0.020–0.025 m and 0.25–0.4 m, respectively. Their internal stratification was poorly defined in Runs 02–04, because of relatively low bed clay content, but in Run 05 clay captured within the bed generated high-angle cross-laminae that alternated with sandy cross-laminae (Fig. 15).
Fig. 15. USPB-equivalent bedforms in turbulence-enhanced transitional flow of Run 05. The variable shape of these bedforms is notable.
rather than a decrease in depth-averaged flow velocity. We infer that the USPB of Run 01 became unstable in Runs 02–05, because the high-concentration bedload layer (i.e. traction carpet) that pre-vents the development of ripples or dunes (Allen & Leeder 1980; Bridge & Best 1992) was poorly developed in Runs 02–05. This weakening of the traction carpet might have been caused by the enhanced turbulence forces in the flows of Runs 02–05, which gen-erated a more uniform vertical distribution of suspended sediment near the bed, combined with increased bed cohesion caused by clay particles settling between the non- cohesive sediment particles. The cohesive nature of the bed would thus render the upward flux of silt and sand insufficient to suppress near-bed turbulence and create a traction carpet. Instead, strong turbulent eddies eroded into the bed and formed the large ripples. Local variations in clay content may have further promoted the formation of the irregular bed topogra-phy, if these variations were around the threshold between a stable and an erodible bed.
Using the same criteria as for Runs 02–05, the turbulence-enhanced transitional flows in the washed-out ripple equivalent experiments comprised Runs 14 (C0 = 4.1%), 15 (C0 = 5.8%), 16 (C0 = 7.4%) and 17 (C0 = 8.8%). These runs covered the full range
of flow conditions within the turbulence-enhanced transitional flow regime; that is, Runs 14 and 17 were conducted close to the boundaries with turbulent flow and lower transitional plug flow, respectively. The corresponding bedforms changed from slightly modified washed-out ripples to large asymmetrical ripples, as C0
values were increased from 4.1% to 8.8%. The bedforms in Runs 14 and 15 with 4.1% < C0 < 5.8% resembled the washed-out ripples formed in turbulent flow (Fig. 16), with heights of 0.004–0.006 m and wavelengths of 0.095–0.120 m. However, a better diagnostic criterion than the bedform geometry was their internal stratifica-tion. The washed-out ripples in Runs 14 and 15 showed long, thin streaks of muddy sand that connected the bedform troughs or extended from the bedform troughs at low angles into the bed (Fig. 16). It appears that, while the washed-out ripples were migrating along the aggrading bed, some mud was captured in the bedform troughs and then preserved as elongate lenses of muddy sand.
The bedforms in Runs 16 and 17 with 7.4% < C0 < 8.8% were particularly interesting, not only because they were distinct from the washed-out ripples formed at lower suspended clay concentra-tions, but also because these bedforms went through different development phases. Shortly after initial flow deceleration and rapid deposition of suspended sediment, long and low-amplitude sediment waves started to appear on the flat sediment bed (Fig. 17a). These bed-waves were composed of muddy sand and their geometry resembled the low-amplitude bed-waves that pro-duce plane-parallel laminae on aggrading upper-stage plane beds (Bridge & Best 1988, 1997; Best & Bridge 1992). However, these bed-waves were unstable, and quickly evolved into symmetrical bedforms that resembled the washed-out ripples formed at C0 < 5.8% in their basic shape and the presence of elongate lenses of muddy sand and sandy mud, but their size was significantly larger. The mean height and wavelength of these bedforms were 0.009 m and 0.24 m, respectively (Fig. 18a). After 0.13 h in Run 16 and 0.17 h in Run 17, another change in bedform shape from symmetrical to asymmetrical ripples was observed (Figs 17b and 18b). These asymmetric bedforms were 0.011–0.017 m high and c. 0.24 m long, and thus steeper than the symmetrical bedforms, but less steep than current ripples formed in pure sand (Baas 1994, 1999). The asym-metrical bedforms exhibited heterolithic high-angle cross-lamina-tion, consisting of alternations of foreset laminae of clean sand and muddy sand (e.g. Fig. 17b). The heterolithic cross-laminae were formed by a combination of periodic avalanching of coarse-grained sediment down the slipface of the bedforms and more continuous suspension settling of fine-grained sediment. Importantly, no varia-tions in flow velocity were required to explain the alternation of sandy and muddy laminae.
Fig. 17. WOR-equivalent bedforms in turbulence-enhanced transitional flow. (a) 0.13 h and (b) 0.33 h after the start of Run 16.
Fig. 16. WOR-equivalent bedforms in turbulence-enhanced transitional flow of Run 14.
and 17 is inferred to denote a further breakdown of bedform sup-pression owing to the lack of a traction carpet. Additionally, their more regular shape compared with otherwise similar bedforms in Runs 02–05 suggests that, despite the turbulence enhancement, the flow velocities stayed well below the boundary of an upper-stage plane bed.
Bedforms in lower transitional plug flows
Lower transitional plug flows are characterized by high near-bed turbulence intensities and the development of a rigid plug in the upper part of the flow (Fig. 13). The USPB-analogous Runs 06 (C0 = 12.6%), 07 (C0 = 13.7%), 08 (C0 = 15.1%), 09 (C0 = 15.7%)
and 10 (C0 = 16.4%) exhibited these properties in vertical profiles of U, RMS(u′) and RMS(u′)0 and time-series of horizontal veloc-ity (Fig. 13e). Baas et al. (2009) showed that, as initial suspended clay concentration is increased, the rigid plug expands downward, the coherency of sawtooth-shaped fluctuations in near-bed horizontal velocity increases, and the near-bed RMS(u′) increases in a predictable manner. This information was used to subdivide the new experimental data into Runs 06 and 07, Runs 08 and 09, and Run 10 to represent the lower, middle and upper stability region of the lower transitional plug flow stability field,
respectively. The rigid plug had the greatest thickness in the upper stability region of the lower transitional plug flow stability field.
Fig. 18. WOR-equivalent bedforms in turbulence-enhanced transitional flow. (a) 0.12 h and (b) 0.22 h after the start of Run 17.
[image:19.595.49.535.495.770.2]Fig. 20. USPB-equivalent bedforms in the lower stability region of lower transitional plug flow. (a) 1.1 h and (b) 1.8 h after the start of Run 07.
were confined to the basal sand (Figs 19 and 20). Most fluid escape structures were inclined in the downstream direction, implying that they were active during flow. It is inferred that the deposits that originated from the decelerated flows with C0 = 12.6% and
C0 = 13.7% contained enough cohesive mud to resist erosion, despite having been subjected to high near-bed turbulence intensity, because (1) the deposits were much thicker than those generated below turbulence-enhanced turbulent flows, (2) single bed-waves did not scour significantly into the aggrading bed, espe-cially in Run 07, and hence produced excellent preservation of the heterolithic stratification, and (3) the top of the basal sand, when exposed to the flow at an early stage, was subjected to plastic deformation by coherent flow structures rather than erosion.
USPB-analogous Runs 08 and 09 were conducted in the middle stability region of lower transitional plug flow, where bedform development was observed to undergo three distinct phases (Figs 21 and 22). In the first phase of bedform development, deposition from suspension formed a flat sand bed overlain by a layer of soft
mud (Run 09: C0 = 15.7%) or sandy mud (Run 08: C0 = 15.1%). As in Runs 06 and 07, the sand contained fluid escape structures that were inclined in the downstream direction. The active release of sand from the top of fluid escape pipes into the overlying soft cohesive sediment was observed during the experiments; this elu-triation process preserved clouds of sand in the mud after compac-tion. Moreover, the top of the basal sand experienced plastic deformation in the form of interfacial waves and oscillating sand grains.
Fig. 21. USPB-equivalent bedforms in the middle stability region of lower transitional plug flow. (a) 0.9 h, (b) 1.8 h, and (c) 3.8 h after the start of Run 08. The scour with complex primary current lamination is notable.
Fig. 21b and c). The height and wavelength of the bed-waves were up to c. 0.007 m and c. 1 m, respectively.
The third phase of bedform development was closely linked to the emergence of the bed-waves. Approximately 0.75–0.9 h after flow deceleration in Runs 08 and 09, the sediment deposited dur-ing phase 1 became unstable. First, the muddy top of the deposit was diluted with ambient water, and sand particles that were previ-ously almost stationary began to oscillate vigorprevi-ously, and eventu-ally the flow began to erode the bed. This ‘cannibalization’ process was localized and occurred below the trough of stationary waves on the water surface, where the flow velocity might have increased. The fine fraction of the eroded sediment was taken into suspen-sion, whereas the coarse fraction formed further bed-waves. The bed scours began to slowly migrate in a downstream direction. The feedback relationship between depositing mud and sand on
Fig. 22. USPB-equivalent bedforms in the middle stability region of lower transitional plug flow. (a) 0.3 h, (b) 2.4 h, and (c) 3.2 h after the start of Run 09.
transported non-cohesive sand and silt onto the lower part of the scour face, where these grains adhered to the mud of the phase-1 deposit and mud settled from suspension, causing downstream advance and aggradation of the lower part of the scour face (Fig. 21c). The resulting bedform resembled a reverse ripple, with a long downstream slope and a short upstream slope. Between the lower and upper cross-sets, mud was exposed in the middle part of the upstream scour face (Fig. 21c).
The along-scour arrangement, from bottom to top, of reverse-flow induced low-angle cross-lamination, slightly sandy mud and bed-wave induced, low-angle, cross-lamination was also found at
C0 = 15.7% in Run 09, but the upper division of low-angle cross-lamination was thinner than at C0 = 15.1% in Run 08 (Fig. 22c). The presence of faint sandy cross-sets in the muddy middle part of
the upstream scour face confirms that this entire face slowly migrated in the downstream direction.
Fig. 23. USPB-equivalent bedforms in the upper stability region of lower transitional plug flow. (a) 0.6 h, (b) 1.5 h, and (c) 21.0 h after the start of Run 10.
mixed sand–mud was deformed plastically as a direct result of the scouring process. Run 10 was continued for 21 h, after which the regions that were unaffected by erosion showed two couplets of mud covered by muddy sand in the lower couplet and sandy mud in the upper couplet. These couplets corresponded to two bed-waves that slowly migrated across the soft mud that was formed by con-tinuous slow settling of mud from suspension. It is interesting to note that this vertical sequence of heterolithic sediment did not require any temporal changes in flow velocity, as depth-averaged flow velocity was kept constant for the entire duration of the run.
WOR-analogous Runs 18 (C0 = 10.3%) and 19 (C0 = 12.1%) were conducted in the lower and middle region of lower transi-tional plug flow, respectively. Both flows exhibited high near-bed RMS(u′) and RMS(u′)0 values, rigid plugs and sawtooth-shaped velocity fluctuations (see Baas et al. 2009; Fig. 13). Despite the change in initial flow dynamics, these WOR-analogous ments had much in common with the USPB-analogous experi-ments of the lower transitional plug flow. Immediately after flow deceleration, sand settled out of suspension from the flow with
Fig. 24. WOR-equivalent bedforms in lower transitional plug flow. (a) 0.13 h and (b) 0.37 h after the start of Run 18.
same type of low-angle cross-lamination and bed-wave induced stratification as in the USPB-analogous lower transitional plug flow experiments (Fig. 25b and c). However, no evidence for a reverse-flow bedform was found in Run 19.
The current-ripple analogous, rapidly decelerated lower transi-tional plug flows described by Baas et al. (2011) experienced an early phase of rapid deposition of sand and mud, followed by a phase of migrating low-amplitude bed-waves, and a final phase of bed erosion. In general terms, therefore, these three phases mimic the bed changes in the USPB- and WOR-analogous experiments, described herein. However, the difference in final bed morphology in the experiments of Baas et al. (2011) was less dramatic than in the present experiments. In the experiments of Baas et al. (2011), current ripples persisted in the lower transitional plug flows, although these ripples were greater in height and wavelength and possessed a more intricate internal stratification than the current ripples in the control experiment. Herein, the bedforms that formed below lower transitional plug flow were entirely different from the upper-stage plane bed and washed-out ripples in the control exper-iments.
Bedforms in upper transitional plug flows
The USPB-analogous flow in Run 11 (C0 = 17.5%) and the WOR-analogous flows in Runs 20 (C0 = 13.7%), 21 (C0 = 15.4%), and 22 (C0 = 16.6%) were classified as upper transitional plug flows, based on the following observations (Fig. 13): (1) the Coles wake function fits the vertical profiles of downstream velocity better than the logarithmic law for wall-bounded shear flows; (2) vertical profiles of RMS(u′) and RMS(u′)0 show evidence for thick rigid plugs, and their near-bed values are lower than in lower transi-tional plug flows and turbulent flows; (3) sawtooth-shaped fluctua-tions in near-bed streamwise velocity time-series are replaced by minor, low-frequency velocity fluctuations.