COMMISSION OF THE EUROPEAN COMMUNITIES SCIENCE
RESEARCH AND DEVELOPMENT
Proceedings of
the International Workshop on
Science Park Evaluation
(Bari, 26th and 27th March 1
992)
SPEAR
Commission of the European Communities
)lroceedings oif
the International Work:shop on
Science Park Evaluation
,.
(Bari, 26th and 27th March 1992)
Editors: U. Bozzo- Director General, Tecnopolis Csata Novus Ortus
"
J. Elias de Freitas - CEC, DG XII (MONITOR/SPEAR
Programme)
~;
7. Higgins - ONITOR/SPEAR Network coordinator
-The Circa Europe Group , u lin
December 1992
Published by the
COMMISSION OF THE EUROPEAN COMMUNITIES
Directorate-General
Information Technologies and Industries, and Telecommunications
L-2920 LUXEMBOURG
LEGAL NOTICE
Neither the Commission of the European Communities nor any person acting on behalf of the Commission is responsible for the use which might be made of the following
information
Cataloguing data can be found at the end of this publication
Luxembourg: Office for Official Publications of the European Communities, 1992
ISBN 92-826-4832-X Catalogue number: CG-NA-14741-EN-C
© ECSC-EEC-EAEC Brussels • Luxembourg, 1992
CONTENTS
forf!JMX'd
Papers
~thodological Issues in the Evaluation of US Technology Parks
~ssion Impossible: Evaluation of the Impact of Technology Parks
Evaluating the French Science and Technology Parks' Experience
Technopolis Csata lVovus Orta: OUtcmnings frmn Self Monitoring
Evaluating cambridge Science Park
Science Parks and Technological Innovation
The Relationships between Space and Technology. Same Introducy Re.marks
Experiences of a Tenant of a Science Park
Technology Centres and Science Parks and their Effects on Job Creation in Structurally~eak Areas
Ccmrents fo II ONi ng W>rkshop discussion
Impact and Evaluation of Science Parks: smne re.marks
Evaluation oj ~cience Parks: smne re.marks on the experiences in the ~re advanced countries
~nts by G. COlletis
C~nts by G. Lewison
~nt s by D. McQueen
List of participants
I I I
M. I. Luger 1
D. H. M;Queen 33
T. Bruhat 47
M. M:zrinazzo 59
B. Hodgson 83
R. Van 101
Dierdonck &
K. Debackere
G. Collet is 131
G. Lewison 139 F. Dietrich 147
159
J.Campos
Rodrigues 161
L. Tsipouri 163
167
169
171
FOREWORD
The MONITOR/SPEAR Programme of the European Commission Is designed to developing R&D Evaluation Methodology. This International Workshop in Bari was held to discuss Evaluation Methodology for Science Parks in the context of the SPEAR Network Group. This topic has become 1n0re pressing In view of the recent stepping up of EC R&D Infrastructure Programmes towards the less favoured regions of the Community.
The COmmission is extremely grateful to Professor Gianfranco Dioguardi, Chairman of TECNOPOLIS Csata Novus Ortus in Barl and wishes to warMlY thank Dr. Umberto Bozzo for hosting this Workshop. This expression of gratitude extends, of course, to all those in Bari TECNOPOLIS who Made the necessary arrangements for the work to run so smoothly, and to Miss
War istella Marrocco I i in particular. We must also thank the
participants themselves for their contributions to the Workshop.
The discussions were assent Iaiiy divided between Findings (on the current Science Parts• performance> and Evaluation Methodologies. The reader May like to know that a baseline discussion on the concepts of science parks (and the like) had been initiated in the former SPEAR
lnternat ional Workshop (Braga, 1991), proceedings of which have been published by Universidade do Winho, Braga, Portugal.
Findings related to Evaluation
As to the Findings on the Science Park performance, we would like to single out the following points:
The high expectations that Science Parks would stimulating large numbers of new company start-ups seems now to be unfounded.
Similarly, the expectations that academics would become
entrepreneurs, and the benefits from extensive day-to-day synergies between academics and companies have proven to be over-optimistic. However, it would appear that measurement of success should not be based strictly on these criteria. Indeed, some papers suggested that such synergies are often
non-existant. This requires further investigation. A
disapointing result is that Science Parks seem to have
achieved I ittle in terms of technology transfer.
Drawing on the US experience, it would seem that the performance of Science Parks improves over time, i.e. the older
Science Parks are the most efficient although the evidence is
somewhat mixed. It is Important for a Science Park to be
closely connected with a University, since some evidence
suggests that this may lead to higher performance rates. The
major constraint appears to be "sub-critical" environment, i.e. inadequate popu I at ion size, too low reg iona I economic growth and problems of individual leadership.
In contrast to some of the less optimistic views of the performance of Science Parks, the lessons from the particular
case in Germany, deserve further consideration. Science Parks
may be viewed as a cradle for Regional Development (i.e., as a means of attracting new businesses together with R&D-based companies). Yet the fact that a good number of companies in a number of Science Parks reported no in-house R&D activity and no real contact with the local University suggests a need for further thought about the rationale for Science Parks.
Of particular importance are the findings which suggest that both on-park or off-park firms tend to be equally innovative, i.e. that Science Parks generate no extra incentive for innovation that cannot be found elsewhere. This is certainly a matter for further investigation.
As far as the scientific dimension of Science Parks is concerned, the "exce I I ence" factor is cr it i ca I . The factors prornot i ng exce I I ence (which remain i I 1-def i ned ) may we I I be the key for higher success-rates.
some
key points relating to Evaluation MethodologyAs far as methodological lessons are concerned, we would I ike to single out the emphasis on "quasi-experimental methods", i.e. the evaluation of Science Parks with an extensive use of control groups, thus enabling
Some other important methodological issues are related to assessing the local environment in which the Science Park operates (what are the key indicators ?), the time scale for the emergence of spin-off companies and their size (what do we know of them In the longer term?). The
methodology ought to be espec i a I y focussed on identifying causes and
effects at the various levels of analysis, i.e. input, performance and output level. It should also breakdown effects into first, second and third order magnitude or timescale because effects are certainly of a multiple character and tend to produce differentiated impacts. As
demonstrated by this Workshop Impact assessment remains a very
difficult problem for regional pol icy analysts.
The key success criterion remains whether or not technology-intensive
firms have steadily developed, (either assuming the form of true R&D
sp i n-offs, loca I R&D Units of companies or loca I branches of
Multinationals).
This suggests that some of the crucial areas of future methodological work w i I I be:
to assess the IIUitlpller effects of Science Park (e.g., what do
on-park companies really contribute in terms of money and
employment from the regional viewpoil"lt, and particular emphasis
should be given to the true R&D spin-offs).
to assess the economies resulting from the agglomeration effect
i.e., the effect of bringing together Industry and Science.
Underlying this, is the problem of measuring the so-called
synergies that are expected to develop between companies and academic community In the day-to-day I ife of a Science Park. It is
probably true that professional evaluators fai I to fully
understand the problems of measuring this type of interchange. This pertains both to typical economic measurement (e.g., economies of scale in the bringing together distinct activities) and to
measurement of factors as econorn i es I nvo 1 ved in procuring
information (what one might call the .. economics of information .. ). At any rate, the findings on the negligible "proximity effect",
quoted in the discussions provide important food for thought.
To develop regional •models" which outline the potential for development of a single region via the Science Park mechanism
(e.g., a region which has a good number of dlver~ified industries,
as well as a sub-critical mass of research capability, might require the setting-up of a Science Park more in the fashion of the quoted German case, i.e. aimed at attracting businesses and not restricted to particular fields of activity. As opposed to this, a
region which has significant scientific expertise, should
design a Park with the aim of attracting relevant industries in
a more specialised fashion. This would, define the mission of the Science Park
in principle, and thus to stronger criteria for evaluation, particularly ex-ante).
help to provide
Apart from these issues, this Workshop also identified a handful of
core Indicators. These ought to provide the backbone for the
evaluation, in particular:
Land area, Building area,
Facilities by type of use (e.g., Incubator, Training),
Tenant companies by type of activity and type of spin-off (e.g., local, private or semi-public, multinational),
Nr. of Jobs and skills by type of activity Firms return on investment,
Patents applications and licensed out
overall turnover <and R&D undertakings In particular) by type Of financing source
Regional <and national) main Economic Indicators.
Methodological Issues in the
Evaluation of U.S. Technology Parks
Michael 1. Luger
Metbodologlcallssues lo tbe Evaluation of U.S. Technology Parks
Michael I. Luger
University of North CaroliM, Chapel Ifill, NC. USA
As a general maner, economic development programs are implemented in the United States with little prior study, and are rarely subjected to rigorous evaluation after they have been put in place. The "test" that determines their desirability, both a ante and a post, tends to be political rather than
economic. Symbolism plays a role in the attractiveness of many programs. For example, there is a bias toward "bricks and mortar" programs that politicians can cite as physical evidence of their concern, over service-type programs that are more invisible. Elected officials who want to communicate their commitment to high wage job creation, therefore, are likely to support the construction of a high tech research facility or technology park, more than job training and education programs for workers. Similarly, elected officials place importance on an image of activism. There is a bias in economic development policy-making toward doing something rather than nothing, even if that something does not produce net benefits (in a benefit-cost sense). This behavior is revealed, for example, in a distinct "bandwagon" or contagion effect. We see states and local governments adopting programs that have been introduced elsewhere, not because those programs have been shown to be effective, but rather to avoid the appearance of being inert or backward. For elected officials Interested in the symbolism of programs, evaluation is irrelevant. For policy-makers motivated by a fear of appearing inert, evaluations are eschewed because they are too time consuming, and often inconclusive. In fact, there is evidence that elected officials intentionally choose not to have programs evaluated, so that political opponents do not have reason to criticize their actions.
This is not to say that there is linle interest in the United States in rational planning, which includes careful a ante and a post evaluation. Many of the planners and policy analysts who advise
elected officials, and most academicians, place high value on economic efficiency and policy effectiveness as criteria that must be satisfied in the design and implementation of programs. Their problem is to
conduct studies that do not sit on the shelf, but find their way into the policy-making process.
To be fair, the difficulty planners and analysts have in conducting useful evaluations is only partly a consequence of culture clash between them and elected officials. There are also methodological problems which make the evaluation of some public programs inherently difficult. Those problems increase the time and cost of evaluations, which further erode their attractiveness to elected officials.
In this paper, I discuss methodological problems that surround the evaluation of technology parks. In doing so, I beg the issue of whether those evaluations would be useful in the policy-making process if they were conducted properly. Suffice it to say, however, that the resolution of the methodological problems is necessary, if not sufficient, for evaluations to be useful to policy makers. First, I discuss the nature of the problems and propose means to overcome them. Then, I draw on my own work (with Harvey Goldstein) to illustrate what a methodologically correct evaluation of technology parks would look like.
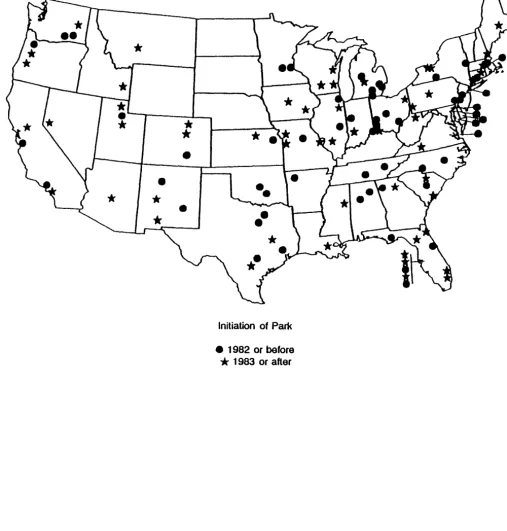
'ine choice of technology parks as a focus of study was motivated by the obsei'Vation that they are among the most popular economic development strategies currently in use, not only in the United States, but in Western Euro~ and the Pacific Rim, as well. In the United States, for example, there has been an explosion of technology park development. At last count, there were more than 120 parks in operation, with many more in the planning stage. Those parks, moreover, represent a small proportion of all parks that have been started (many have failed). They are located in at least forty of the fifty states, in both dense metropolitan and more rural settings. Figure 1 shows the geographic distribution of U.S. technology parks. Figure 2 shows the age distribution of those parks, indicating that the great majority of parks in operation are relatively young.
MethodologiCDI Problems in the EvalutJtion of Technology Park.s
• Unlike some programs that have a single objective, technology parks typically have multiple objectives. Therefore, the definition of "success" wiU differ, depending on who you ask. Moreover, even when a single objective is selected, "success" toward that objective is difficult to operationalize. In short, "success" is a normative concept.
• Analysis of the determinants of "success" is inherently limited, and perhaps biased, because a full treatment of "failures" is not possible. If we define a "failed" park as one that no longer exists, we have eliminated the possibility of studying it.
• If "success" is c ~fined in terms of the creation of net new economic activity we have a problem of countedactuality. That is, we only observe outcomes where parks ace located in the presence of the park. Special procedures must be applied to ascertain outcomes in that location if the park did not exist.
• Data to conduct a full evaluation are not routinely available. Special procedures must be used to collect and create the required data.
These problems are discussed more fully below.
Defining "Success" and "Failure:
There is no consensus about the definition of success among public officials, university administrators, economic development plallllers, and others who are involved in technology park development. Various actors cite different goals for park development, depending on their particular perspective. Park managers and economic development officials generally cite economic development as most important; university administrators are generally most concerned about university and technology development; and private park developers tend to cite income or profit generation as the key goal.
We can deal with these differences in two ways. First, we could employ multi-objective (or multi-attribute) plaMing and attempt to weigh, then combine, each of the goals to come up with one composite benchmark. In practice this is difficult to do because weights are hard to assign and progress toward the goals tends to be measured in different units. For example, economic development may be
measured in terms of job creation; technology development in tenns of new processes and products
created; and profit generation in terms of dollars. A composite outcome measure therefore is hard to
construct.
A second approach is to adopt the perspective of one set of actors and pedorm the evaluation for
them, recognizing that the conclusions drawn may not be relevant for others. That avoids the problem
of combining different units of measurement, but not the problem of operationalizing the definition chosen.
Because we consciously directed our evaluation toward elected officials and park managers, we
used their most frequently cited goal-- economic development --as the relevant outcome measure. We
still had to decide how to account for somewhat different types of economic development outcomes,
including job creation, income growth, greater income equality, expanded opportunities for special groups
within the labor force, and regional economic restructuring. These are not necessarily mutuaiJy consistent.
Both "success" and "failure" can be measured in different ways over the life cycle of a technology
park. In the start-up, or incubation stage of park development, for example, we might judge success as
the ability of park management to recruit at least one R&D organization without relaxing requirements
for location. Success in this first stage, then, would really be a potential" measure because the parks could
fail in a later stage, either by going out of business or by changing their focus away from technology.
We can measure success in the consolidation and maturation stages of park development, at least
in terms of economic development, by counting the number of jobs represented by the R&D organizations
that have located in the park, as well as the following induced changes in the region: employment growth,
business start-ups, regional income and income equality, employment opportunities for women and
minorities, occupational mix and the local wage structure (related to "regional restructuring"), research
capacity of the local university(ies), and the business climate and political culture.
The Problem of "Couoterfactuality"
As just noted, success in the middle and late stages of park development should be measured in
the region if the park did not exist? That is a counterfactual question because the only situation that is observed is one that includes the park. To get around that problem one can employ an interrupted time series or quasi-experimental research design. With the former, outcomes are plotted on a time line and the slopes of the segments before and after park development are compared. If the intervention (park development) had an effect, the slopes would differ. However, this technique does not control for other influences that may account for changing slopes.
Quasi -experimentation refers to a class of research designs that apply some aspects of classical experiments -- such as the use of control groups and pre- and post-test observations -- to causal research in actual field settings. It differs from classical experimentation because the random selection of cases into experimental and control groups is usually not a feasible (or ethical) option in field research, nor is the physical isolation of cases from aU other putative causal influences. Quasi-experimental designs potentially can increase internal validity of research findings toward the level of validity that can be obtained in classical experimentation.
In the context of technology parks a quasi-experimental research strategy would treat counties with parks as the experimental group and counties without parks, but similar in other respects, as the control group. Both would be compared on the basis of some outcome variable. If park development had a systematic effect, the outcome variable in park counties would have changed more than in the other counties.
I stated above that success in the consolidation and maturations stages of park development, in tenns of economic development outcomes, ideally would be measured in tenns of employment growth, business start-ups, regional income and income equality, employment opportunities for women and minorities, occupational mix and the local wage structure (related to "regional restructuring"), research capacity of the local university(ies), and the business climate and political culture. Data to measure the gross level of many of these outcomes can be gleaned from secondary government sources. But, data to
estimate the net impact of parks are not readily available and must be deduced from published data or collected directly from businesses inside and outside the parks and from universities. For example, it is not enough to obseiVe the number of high tech start-ups in a region over time. To estimate the impact of the technology park on business formation we can ask businesses to indicate the effect of the park and its tenants on their start-up or spin-off decision.
Similarly, published data reveal only the gross direct employment and payroll outcomes-- which park promoters typically cite as evidence of success the employment and payroll of park businesses. (Research Triangle Park, for example, boasts of 32,000 employees and $1.5 billion in payroll.) This is only part of the story, however. As noted above, some of those jobs and payroll dollars may well have been created within the region, even if a park had not been developed. Quasi-experimentation should account for that. In addition, the real effect of a technology park on the region's economy is likely to extend beyond the park through input-output linkages to other businesses in the region. That can be measured using detailed case studies in which trading patterns within the region between park and non-park organizations can be observed.
An EvaliUJJion of U.S. Technology Paries
The foregoing discussion indicates several strategic research decisions that had to be made in order to conduct our evaluation. The first was whether to limit the analysis to statistical analysis of a large sample of parks, using a quasi-experimental design, or to supplement that approach with detailed case studies.
The quasi-experimental design method has the advantage of having a large number of obseiVations of areas both with and without parks since the cost per unit of observation is low. It is the large number of observations that allows us to control effectively for rival factors (besides the existence of a technology park) that may affect an area's economic growth performance. The large number of obseiVations also allows us to generalize to the full population of parks (i.e., high external validity).
!i
i11
group that is similar to areas with technology parks in all important ways. In practice, we caMot control
U,
for all other rival factors in a formal sense. Instead, it is necessary to rely upon logic and experience in
particular cases to rule out some factors. A second disadvantage is that in order to have standardized
measures for all the cases, some valuable infonnation about some parks becomes inadmissable in a
quasi-experimental design, including much of the contextual and historical factors that may have contributed to
a particular park's success or failure.
The advantages of the case study method are the abilities to incorporate current and historical
contextual factors -- political, social and personal -- directly into the analysis and interpretation of the
results, and to collect highly detailed primary data from a variety of actors and textual sources. Among
the disadvantages of the case study method is a high cost per case. When resources are limited, the
researcher often is required to limit the number of cases. With a small sample size one has difficulty
generalizing the case study results to the full population (research methodologists refer to this problem as
"low external validity").
Rather than relying on either approach exclusively, we decided to use both. We employed a
quasi-experimental research design, using data from published sources and a mail survey to all known
park managers (from which we received 77 responses). We also conducted three detailed case studies,
obtaining information from a number of "key actors" in each, either by mail or face-to-face survey: (I)
the park manager ct ~itector; (2) the population of businesses and organizations located in each park; (3)
a sample of high-technology businesses located outside the park but within the designated region; ( 4) key
administrators in universities affiliated with the park; and (5) selected state and local government officials
and business leaders.
Our hybrid approach allowed us to maximize the internal and external validity of the results, given
the resources available. In the remainder of this paper I summarize the insights this strategy provided.
Results from the I.argc Sample Apa))'sis
After experimenting with different definitions of economic development success or failure we
9
chose to use, as the measure of success, the difference in total employment growth rates -- both after and
before a park bad been established -- between counties with a technology park and a control group of
counties without a park, having the same metropolitan status, population size, and location as the counties
containing the technology parks. By matching control group counties to each county with a park in that
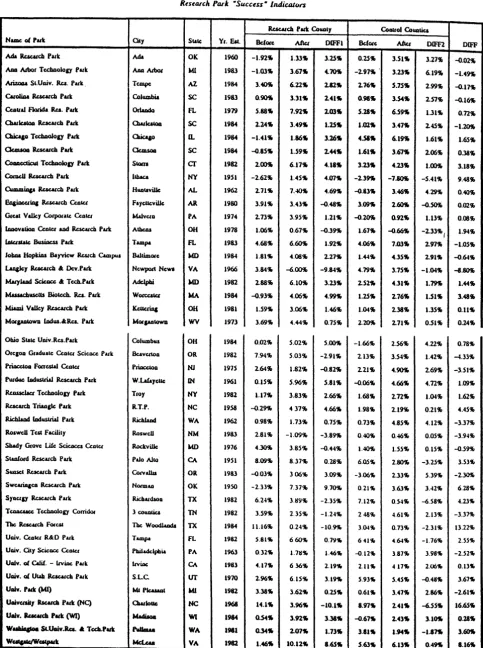
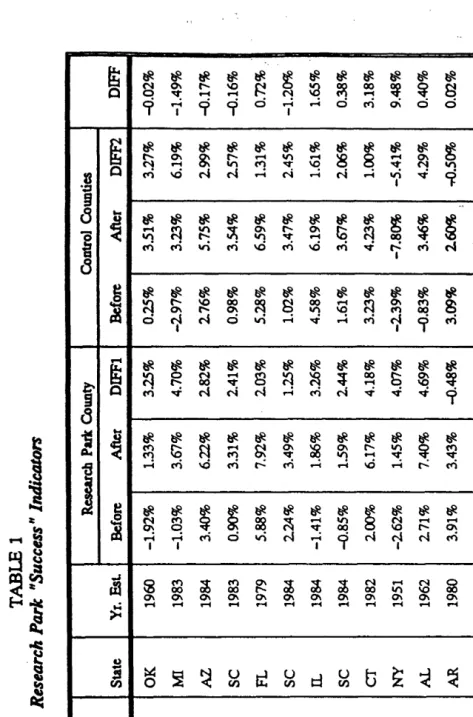
way we auempted to control for selection differences between areas with and without parks. Tables 1 and
2 show the results of this data construction for fony-five parks.
Table 1 indicates that the after total employment growth rates for park counties range from more
than 10 percent to approximately -6.0 percent. These numbei'S mean nothing unless they are compared
to some benchmark, so the control group counties' growth rates are also shown. The respective difference
in growth rates ranges from +9.25 to -9.75 percentage points. Thirty-two of the forty-five parks are in
counties that grew faster than their control group counties in the years after the parks were established.
Using a more stringent success criterion, which requires park counties to grow 20 percent faster than
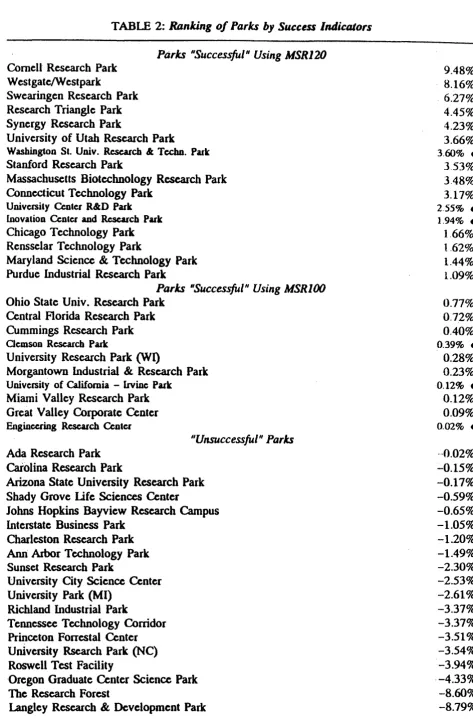
control group counties, we fmd that twenty-six of the forty-five parks have been successful. Table 2
presents the data in a different fonnat. The table distinguishes parks that employ more than one hundred
employees from those employing fewer than one hundred to account for the possibility that very small
parks are not as likely to have bad a significant impact on their region, despite the high success index they
may have been assigned. The table lists sixteen parks that are judged to have been successful under our
stringent criterion, another ten parks that have been successful under our more lenient criterion, and
nineteen parks that have ben unsuccessful -- at least in tenns of induced employment growth.
What accounts for these rankings? Specifically. are there local economic and/or park
characteristics that systematically account for a park's success or lack of success by our measures? First,
it is critical to stress again that the definition of "success" used here is a limited one. One limitation in
creation. Many of the economic development impacts of parks will take longer than five years to
materialize. In addition, parks that are not ranked high in our lists may still be judged to be "successful"
by other measures. Conversely, because we are not able to control for all conceivable rival factors, we
undoubtedly are listing as "successes" some parks that are in counties that would be growing relative to
their respective control groups even if a technology park were not present.
I'
j'Table 3 presents cross-tabulations of the success indicators and four key characteristics: the parks'
vintage, the geographic region of the country in which the park is located, the size of the metropolitan area 1
in which the park is located, and the type of university with which the park is formally or informally
associated. Vintage is important for three primary reasons -- because it takes time for a park to establish
linkages with other businesses in the region, because new R&D organizations are highly attracted to
regions that already have a concentration of R&D (i.e., localization economies matter to R&D
organizations), and because there is a premium for being an "early bird" since the supply of
technologically-oriented businesses is limited. Geographic region is included as a proxy for the local
industrial base and political culture. The Northeast and North CentraVMidwest regions, in general, have
older manufacturing bases and higher rates of unionization, for example, than the other two regions. Size
is included to capture the presence of agglomeration and urbanization economies, and economies of scale,
in general. And, the type of university is included to enable us to test whether the ability for neighboring
private sector scienth~tngineers and university researchers to collaborate has affected growth.
The table suggests the following:
• Vintage. We split the parks into three vintages. Because no parks were established between 1971 and
1973, we made the break between old and middle-aged parks at that point. Thus, "old" parks
have been in existence at least twenty years, "middle-aged" parks have been extant for at least
eight years, and "young" parks have been in existence for no more than eight years. Old and
middle-aged parks indeed appear to have been more successful than the youngest group of parks.
The difference in perfonnance between old and middle-aged parks is not large, and may be an artifact of the arbitrary dividing line we have drawn.
• Region. We can make two obseiVations of note from the left-:-hand side of the table: parks in the northeast region of the U.S. generally are older than in other regions, and almost half of all parks are in the South. Entries on the right-hand side of the table suggest that parks in the Northeast and North Central regions have been more successful than those in the South and West.
• Metropolitan area population. Parks in medium-sized regions, with populations between 500,000 and
1,000,000. appear to have performed better than other parks, and, parks in small areas, with populations less than 100,000, have performed better than many might have expected. These results, of course, are sensitive to how we arbitrarily draw up the size classes.
The results for small areas can be explained, in part, by the fact that parks located in those regions can serve the same function as a central business district: they can be a source of ag-glomeration economies that small places otherwise would lack. That parks in areas with populations between 500,000 and 1,000,000 have performed relatively better might be explained by those areas being sufficiently large to offer various urbanization and agglomeration economies that are important to attracting R&D activities. Those economies include a diversified pool of skilled labor, cultural amenities, good airline service, and necessary business support seiVices. Yet, those areas are not so large as to have generated disamenities, congestion, environmental degradation, a high cost-of-living, and other diseconomies of metropolitan scale.
causal factor on success is not isolated from all other factors. A standard way to control for other factors is to employ multiple regression analysis. We have performed this type of analysis in which we explain
ll
lhe variation in lhe park success measure (i.e., lhe dependent variable) by lhe characteristics listed in Table3, as well as other explanatory variables. Alternative measures for seven types of factors were formulated and tested, as well, including: (1) location, (2) vintage, (3) characteristics of park businesses, (4) university linkages, (5) park-provided services, (6) park-imposed restrictions, and (7) governmental assistance.1
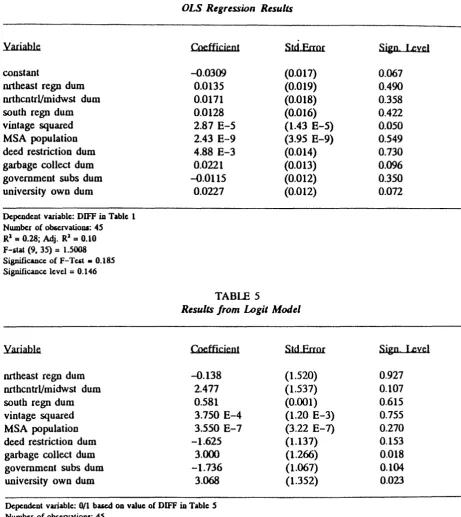
Three of the variables above proved to be statistically significant explanatory factors in most of the alternative models that were estimated: the age, or vintage of the park; formal affiliation with a public of private university; and the provision of garbage collection services. That is, these are the factors best able to explain the variation in the measure of technology park success. We present the results from two of the models below (ordinary least squares and logit models) and then present additional results from a suiVival/hazards model.
Table 4 contains results from a regression of the relative employment growth rate differences ("DIFF" in Table 1) on region (represented by dummy variables), the square of vintage, metropolitan population, the use of deed restrictions (represented by a dummy variable), the provision by park management of garbage collection services (dummy variable), the use of government assistance by park businesses (dummy variable), and park ownership by a private or public university (dummy variable).
1lucc alternative measwe3 of locatiotull duuactuistics were developed - a regional dummy (or indicator variable) to capture industrial base, politial, and socio-cultural differences; a dummy to indicate whether the park's county was a core county in a mcllopolitan area, a metropolitan non-core COWlty, w a non-metropolitan county; and the puk region's population. The last two mcaswe3 arc highly coaclated and serve as poxics for the same underlying phenomCAa, namely the presence of
agglomeration and wbanizalioo economics. Consequently, they (and Olhers that arc similarly coaelated) were not used in the !Wile regression model.
For vintage we used the number of years parks had existed bcfwc 1985. Because 1951 was our first observation, lhis
variable ranged bom 1 to 34.
M duuactui.sdcs of park businesses, we Used data on the types of favored businesses within pub, and the percent
of Door space within parks that is ,for small businesses. in incubatws.
We tried three measwea of the univusily-park Uni.age: a dummy indicating whether the parks arc OWDed and operated by a unlvcralty, a dummy ladlallna whether the parka arc proximate to a research wliversity, and a dummy indicating whether
the parks are ncar a type I research university. ·
The park-provided services we iDcluded as dummies included garbage coUectioa, fire pQtcction, aad road maintenance.
The resiTictiotLS we tested iDcludc dcc:d rcstd~ons. in general, and a limitation on manufacturing activity.
f"mally, we iDcluded dummy vuiablea (0 or1) in different regressions to indicae whether government suhsidies to park busincucs or management.
We squared the vintage variable for two reasons. First, the results in Table 3 suggest thai vintage (time) enters the;: model non-linearly. Second, we wanted to count time more heavily than other variables in the analysis because it can contribute to success in several ways, as WC? discussed above. We used garbage collection as the "bellwether" infrastructure service because it is one of the few services for which there are private alternatives; hence provision of garbage collection services by park management represents a convenience and probable cost savings to the park business. Finally, we chose the organizational status of the park (owned by university) as the measure of "the university connection" after trial and error. We suspect that it outperfonns other measures of university affiliation in our models because it is less ambiguous.
The results indicate vintage, garbage collection, and university variables each are significant explanatory variables (at the 0.10 level of significance) and relate to the dependent variable in the expected direction. The overall explanatory power of the model, however, is low. That is not so surprising given the nature of the data and the small sample size.
Table 5 shows results from a regression model using a dichotomous measure of park success as the dependent variable, and logit estimation.
In these results garbage collection and university ownership are statistically significant variables but the vintage variable ceases to be a significant explanatory factor of park success.
significant for younger parks than for older parks.
I essnos about Park Failures from tbe l.aq:e Sample
In the discussion of the econometric results above, I focused on the detenninaots of "success," measured as the direct plus induced regional employment growth that can be attributed to technology parks. The results also sb~ some light on the determinants of "failure," at least to the extent that we define "failure" as a small or nuU value for the dependent variable. For example, we can interpret the ordinary least square regression and hazards model results to mean that the younger the park, the higher the degree of failure. Similarly, the results can be read to suggest that parks that do nnt collect garbage are more likely to fail than parks that do provide that seavice.
The insights these results provide about park failures are limited for at least two reasons. First, the data we use in the regressions are only from parks that have not ceased to operate. We also would like to know how the parks that have "died" differ from those that continue to live. Second, the particular measure of success we have used is most appropriate for parks that have passed into the maturation stage for the very fact that induced employment effects can take years to materialize. Consequently, younger parks in the sample that have not yet entered the maturation stage may prematurely be judged as failures. Ideally, we would like to identify predictors that indicate which young parks are likely to proceed into the
I
maturation stage, and which parks will not.
A complete empirical analysis of failure is not possible because data are difficult, in many cases, impossible, to collect from parks that have ceased to exist. However, we can use anecdotal iofonnation about failed parks and data from existing parks to understand better how parks that fail differ from parks that are successful.
Park managers and other technology park professionals with whom we spoke, including some individuals who have worked in parks that did not 1, attract businesses, identified two factors that', are associated with park failure: a lack of conunitmeot and patience by key individuals, and distributional politics.
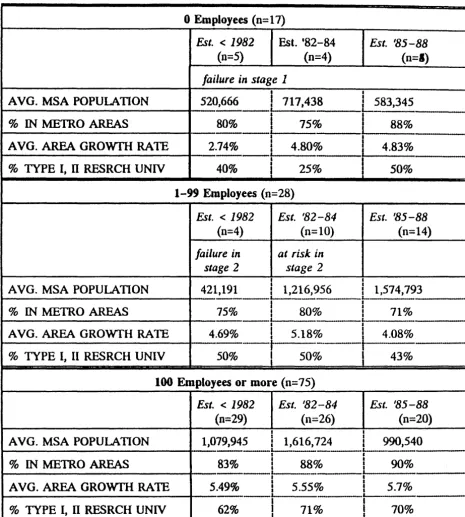
Data from existing parks reveal another important set of reasons for failure: inadequate population , size and growth potential in the region, and the absence of a research university. The small size of regions limits the possibilities of agglomeration and urbanization economies. Slower growth means that the region has relatively less future development potential, including expanding pools of labor and supplies. Not having proximity to a research university restricts R&D organ.izations' access to intellectual capital, regardless of the region's size.
Table 6 includes data from three types of parks: with no employees, with less than 100 employees, and with 100 or more employees. We present data on average metropolitan area size and growth rate, percent of parks in metropolitan areas, and percent of parks affiliated with research universities, by year of technology park birth, for each employee size class. Following our discussion of success and failure
/
above, we can designate parks established prior to 1985 and with zero employment as of 1988 to be failures in the incubation stage. Similarly, parks established prior to 1982 and with fewer than 100 employees as of 1988 can be designated as failures in the consolidation stage, and parks established prior to 1985 having fewer than 100 employees as of 1988 can be classified as "at risk failures" in that second stage of development.
We can use the table to ask: How do the parks that have "failed" differ from those in the table that have not? Parks that have failed are more likely to be in smaller regions, in counties that have had lower employment growth rates, and are less likely to be associated with a research university.
Insights from a Sample Ca_c;c Study
observed. By using "successful" parks as cases, we can attempt to ascertain the critical success factors that, if discovered, would be instructive for future public policy and private investment decisions. That is not to say that WlSuccessful parks are not valuable to study. But it is more difficult to obtain reliable information from key informants on unsuccessful parks, for political and interpersonal reasons.
After discussing the selection criteria with colleagues familiar with technology parks, and after communicating with park managers about their interest and willingness to cooperate in a case study, we finally selected the Research Triangle Parle in North Carolina, Stanford Research Parle in California, and the University of Utah Research Parle in Salt Lake City, Utah.
Key Methodological Issues. In each case study we attempted to measure the impact of park development on flCill location, employment growth, growth in level of per capita personal income, level of income inequality, local labor market conditions of women and minorities, and the overall innovative capacity of the region. I focus below on the first two for one technology park-- Research Triangle Park in North Carolina -- because they illustrate the use of input-output analysis to estimate the indirect growth effects.
Research Triangle Park. Created in 1959, the Research Triangle Park (RTP) in North Carolina is the largest, and considered to be one of the most successful, technology parks in the world. RTP occupies 6700 acres in the middle of a triangle fanned by the University of North Carolina in Chapel Hill, Duke University in Durham, and North Carolina State University in Raleigh. There are approximately 50 R&D-oriented organizations in RTP with a combined workforce of about 32,000. From its beginning, RTP has deliberately sought the R&D branch plants of major, technology-oriented corporations. The list forms a veritable who's who of the Fortune 500 -- IBM, Data General, Dupont, Northrop -- as well as foreign-based firms such as BASF, Burroughs-Wellcome, Glaxo, Ciba-Geigy, Northern Telecom,
Rhone-Poulenc, and Sumitomo. These and other organizations occupy spacious, low-rise, often architecturally distinct buildings in a low-density. wooded setting. Indeed, the appellation "park" is no misnomer in the case of RTP.
In addition to being one of the earliest, largest, and most "park-like" planned concentrations of
R&D activity in the world, RTP serves as a model because it is the symbol of one of the most dramatic
cases of regional economic restructuring that has yet been documepted. For that reason, representatives
of regions that have little or no technology-oriented activity, or tradition, look to RTP and see some
reason for optimism. The story of RTP is also one in which a particular set of actors have made a big
difference.
Finn location and employment growth. The existence of RTP appears to have been a significant
factor for the location of organizations both inside and outside of the park to locate in the region. For the
former, we estimate that 21 of the R&D organizations in the park probably would not have located in the
Raleigh-Durham area if RTP did not exist (see Figure 3). These percentage figures translate into an
estimated direct employment growth for the region of about 18,900.2
For the sample of businesses in selected industry sectors that located in the region but outside RTP
after the latter was founded, we estimate that approximately 16 percent would not have located in .the
region if the park had not existed. This translates into an induced employment impact from RTP of about
1240 jobs in the region's high-tech sector.3 Approximately one-half of the 16 percent probably would
1 These estimates arc bucd oo
the 1cspoDSCS from the CEOs of park organizations to the question of whctbe1 the mganizatioo would have located io the 1cgion if the technology park had not existed. Possible ICSpoDSCS we1e: (1) very likely, (2) likely, (3) maybe, (4) unlikely, and (S) very unlikely. The estimate of the pc1ceot of 01ganizalioos, and the employment in these organizations, that would DOC have located iD the 1cglon is calculated by assigning the following pobabilltics to the response: v'ery unlikely
=
0.9, uol.ikdy=
0.7, maybe=
0.5, and likely and very likely=
0.0.The estimate of the number of 01gaoizalioos that would not have located io the region but for the park is calculated as the 8WD of the pl'obabilitics over all ICSpoodcots. We then ioflatc this number (Of the full populatloa of orsan.izalions to iocludc non-1cspoodcnts. The employment estimate Is made by multiplyiog the probability times the employJilcnt in each organization. We inflated the result io the umc way to include non-1cspondcnts.
1 The estimate for the pcrceatqc of firms in the sample that wof:&(d a~ have located io the region except for the park is based on the same procedure used f01 puk organizations. The estimation of indirect employment stimulated 1
by the park is made similuly as for employment inside the park. The ooly diffcrcocc is due to the fact that a sample was used rathc1 than the full population. The size of the out-of-put populatioo in employment terms Is calaalatcd by subtnctiog all cmploymcat in the puk from the growth of employment in the region's high-tech sccto1 between 1960 and 1987. Percentages and pl'obabilltics derived from the sample were then applied to this population.
not exist anywhere if the park had not been created (see Figure 4).
The relatively high percentage of flCIDS whose decisions to locate in the region were based upon the existence of the park, seems to be related to the absence of other strong locational "pulls" besides the universities, and the relative autonomy of park businesses from other businesses in the region. That is, in the absence of the park (and the universities) there would be insufficient reasons for a large corporation to choose the Raleigh-Durham area for the location of an R&D branch plant. This contrasts with Stanford where a well -developed set of networks among firms exists in the region and provides a strong locational pull for new companies. Also, at Stanford and Utah, many of the entrepreneurs were already living and working in the region, and thus were most likely to start their businesses in their respective regions regardless of the existence of a technology park.
The estimates of employment stimulated by the park, described above, do not include firm and employment growth in the region brought about by the household income multiplier from the payroll for those 20,140 jobs in the region induced by the park {18,900 in the park and 1,240 outside the park). Neither does it include the employment impact from park organizations purchasing inputs from local businesses.• We estimate that the number of jobs generated in the region due to the household income multiplier is about 25,500. The number of jobs generated by the local purchases of all businesses in the region that would not be in the region except for the park is estimated to be about 7,400. The total number of jobs in the region for which the Research Triangle Park is responsible, i.e., would not be in the region if the park had not been created, is estimated to be about 52,000 in 1988.s This represents
4 Some portion of lhe high-techuology businesses aud employment included in ow estimate of that induced by the park by localizatiou C<:Oaomies may have located In the region u supplied of inputs to puk oJganizations. In these cases this employmeut impact is doublc-couwed. We believe, however, that it is small.
s these catima&es were made by applying data from U.S. Department of Comme1ce, lltueau of Ecoaomic Analysis, regional input-output tables (RIMS II). for North Cuollna to lhe information obtained from the park organizations and sample of
out-of-puk high-leehJIOiogy businesses. The steps in the estima&iou of jobs generated by the regional iacome multipliu arc
u follows:
& =number of jobs Inside the pu~ •caused• by the puk (18.900)
12.1 percent of total regional employment in 1988, and 24.1 percent of the total increase in non-government employment since 1959 when the park was founded.
Conclusions
The purpose of this paper was to identify and discuss methodological issues that arise in an evaluation of technology P,afkS, and then, to illustrate bow they have been dealt with in one such evaluation. Even more than other programs, technology parks present a challenge for researchers. Evaluators must define carefully what they are measuring due to the normative nature of the outcome (success) variable. Then, they must operational their outcome measure by devel~ping workable definitions for key variables. In particular, they must develop ways to measure the net induced effect of the technology park, rather than the direct gross effect alone. That requires the construction of a quasi-experimental research design, using before and after measures, and a large sample partitioned into control and experimental observations. It also may require the use of case studies with considerable primary data collection, to estimate the indirect effects on growth through induced start-ups and migration, and through the multiplier effect related to input-output linkages.
This approach applied to U.S. technology parks led to a series of definitive findings that can be summarized as follows: Even though the three case study parks appear to have been important for their respective regions, technology parks, by themselves, are not necessarily a wise investment for other regions. The "success" rate among all parks that are announced is relatively low. And, to the extent that
I; =number of jobs in the high-tech scaor outside the park stimulated by the park (1240) L = average annual salary of employees from El and E2 =$40,000
~ = increment to regional paytoll from El and E2, = (Ea + EJ x L = $805.6 million
P =estimate of local purchases (in S millions) by puk organizations and out-of-park high tech businesses •caused• by
the park = $620.9 million (hom rcsponscs to qucstioD.Daircs)
p =percent of local purchases paid to labor = 0.30 (hom regional input-output tables) <; =- increment to regional paytoll hom local business purchases = $186 million
C =-<; +<;(total increment to regional paytoll) = $991.6 million
F =-employment awltipller of households (hom regional input-output table) x 0.9 leakage factor to rest-of-state) = 24.3 jobs/$ millions of earnings '
E, = total number of jobs aeated through regional income multiplier = C x F = 24,095. The estimation of the number of jobs generated by local business purchases
vintage matters, it is too late for regions contemplating parks to "get in on the ground floor." Technology
parks will be most successful in helping to stimulate economic development in regions that already are
richly endowed with the resources that attract highly educated scientists and engineers. That is not to say
that regions with less rich endowments can not have a high technology future, but more basic and
long-term investments in improving public and higher education, environmental quality, and residential
opportunities will be needed first. If a decision to create a technology park is made, government leaders
should be prepared to invest liberally, and aU other stakeholders should be prepared to wait a number of
years before the invesbnent is returned.
Figure 'i
Geographic Distribution of Research Parks
*
•
*
*
*
•
•
Initiation of Pari<
• 1982 or before
[image:32.588.43.550.134.665.2]Figure
2
Age
Distribution
of
Research
Parks
50
45
...
" ...
3.9.
...
..
40
.··
···30
.··
20
.··
1969or
c
1960-64
1966-69
1970-7
4
1976-79
1980-81
1982-84
1986
or
>
Year
park
was
TABLE 1
Research Park ·success• Indica/an
Ruc.uda Pad Cowaty Coa&roiCowatics
Name o{ Puk a., State Yt. Eat BcfOIC Afl.cl 01Ff1 Bcf01c Abu DIFF2 OlfF
Ada Rucalda Puk Ada OK 1960 -1.92t. l.l3t; 3.25 .. 0.25t; l.S1t. 3.27'11 -(102'11
AAa 1\d)or Tcchaoloc Puk ADa Albol M1 1983 -l.Qlt; 3.67t. 4.7K -2.97t. . 3.23t. 6.19'11 -1.49'11
ArizoAa StUa.iv. R.c.a. Puk _ Tempe A1. 1934 3.40'Jt 6.22t. 2.12t. 2.7615. S.7St. 2.99'11 -o.l7'11 Caroliu R.cscarda Pad Columbia sc 1983 0.~ 3.3lt. 2.4115. 0.98t. 3.S415o 2.S7'11 -(116'1,
Ccat1aJ florida llu. Pad OdaDda FL 1979 S.8815o 7.92t; 2.03t; S.ll .. 6.S9t. 1.31t; 0.72'11
Clwlucoa ll.c.se&l'da Pad <lwlcacoca sc 1984 2.l4t; 3.49t. 1.25 .. unt. 3.47t; 2.4St; -l.l()t; OUu&o Tcchaoloc P~ Oaicqo u. 1984 -1.41t. 1.8611 3.26111 4.51" 6.l9t. 1.61"' 1.6S ..
Ocauoo 'llesatda Pad: Oc.msoo sc 1984 ~.SSt. 1.S911 2.44" 1.61" 3.67t; 2.06"' 0.38"' Couccaicul TcduaoJoc Put Slam cr 1982 2.00t. 6.17t; 4.18t; 3.23 .. 4.2Jt; 1.00.. 3.18"'
ComdJ llesatda P.vk llbac.a NY 19Sl -2.62"' 1.45'11 4.07t; -2.39'11 -7.11011 -5."1"' 9.48 ..
Oammia&a Ruc.uda Puk HUAtaviUc AL 1962 2.71'11 7.40 .. 4.69'11 -o.ut. 3.-16 ... 4.29'11 0.40'11 Eaaiaccdq Rucuch Ccotcl FaycUcviUc AR 1980 3.91'11 3.43"' ~.48 .. 3.09'11 2.60'1. -o..sot. 0.02'11
Gtw VaJJcy Corpot.J.tc Ccotcl M.alvua PA 1974 2.73"' 3.95'11 1.21'11 -o.~ 0.92'11 1.13'11 0.08 .. laaovalioa CcotCI ud llc:seuda P&d Alhcru OH 1978 1.06 .. 0.67"' -o.39'11 1.67'11 ~-66'1. -2.33'111 1.9-1'11 laluaC&&c Busiacss Put TAmpa FL 1983 4.68 .. 6.60t; 1.92'11 4.06'11 7.Q3t; 2.97"' -1.05'11 Jobaa Hopk.W Bayview Rc.srdl C£mpua ll<im01c MD 1984 1.81'11 4.08t; 2.27'11 1.44'11 4.35"' 2.91t; ~.6-4'11
l..aa&kJ lleac&rda cl Ocv.Pad Newport Ncwa VA 1966 3.8-4'11 ~-~ -9.84t; 4.79'11 3.75'11 -1.0-1'11 -8.80t;
Muylud Scicacc cl Tcch.Puk Addphi MD 1982 2.88t; 6.10'11 3.23t; 2.S2t. 4.31t; 1.7K l.44t;
td.usadauscUs Biolcch. llcs. Puk WOlCCSICI )dA 1984 ~.9Jt; 4.06 .. 4.99 .. 1.25t; 2.76t; 1.S1t; 3.48t;
Miami VaJJcy Ruc.uda Pad K.cucria& OH 1981 l.S9t; 3.06'11 1.46'11 1.0-lt; 2.38t. l.lS'II O.Ut; M01pa&owu ladus.ctllcs. Pad M01pa&owu wv 1973 3.69t; 4.44'11 0.1St; 2.~ 2.71t; O.Slt; 0.24t; Obio State Uaiv.Res.P.vk Columbus OH 198-4 0.02 .. 5.02'11 5.00'11 -1.66 .. 2.56'11 4.22'11 0.78 .. OrcJoa G1aduatc Ccotct Scicacc Pule Bc..avuwa OR 1982 7.9-1'11 S.OJ .. -2.91'11 2.13'11 3.54"' 1.42'11 -4.33'11
Priacdoa foaesta.l CcatCI Priacdoa NJ 1975 2.6-lt; 1.82'11 -o.82t. 2.21'11 4.90t; 2.69'11 -3.51"' Pulc&u.e ladustrial Rucuda p Ilk W.lalaJcUc IN 1961 0.15'11 5.96'11 S.81t; -o.06 .. 4.66'11 4.72 .. 1.09'11
Rca.s.scbu Tcchaoloc Put TtOJ NY 1982 1.17"' 3.83'11 2.66t; 1.68 .. 2.12 .. 1.0..'11 1.62'11
R.cscucll Triao&Jc Put R.T.P. NC 19S8 -o.29'11 437 .. 4.66'11 1.98'11 2.1H. 0.21"' 4.4S"
llicb1aad IDdustriaJ Puk Rich1aad WA 1962 0.98"' 1.73<JD 0.15'11 0.73'11 4.85"' 4.12'11 -3.37'11
RoswcU Tcse facilily R.oswcU NM 198.3 2.81'11 -1.09'JD -3.89'11 O . .W'II 0.46'11 0.05'11 -3.9-4'11
Shady Glove Lite Scic:ACQ ua&u Rockville MD 1916 4.30'At 3.85'11 -o.44'JD 1.-10'11 l.S5~ 0.15 .. -Q.59'11 StaACotd Rcsurda P Ilk Palo Al&o CA 1951 8.09'11 8.37'11 0.28 .. 6.05~ 2.~ -3.25'11 3.53'Jb SWLSCl Rc.Jatch P uk Cotvallu OR 1983 -Q.03"' 306% 3.09 .. -3.06'11 2.33'11 5.39'11 -2.~
Swcarira&ca llcsc.atch Put N011Daa OK 1950 -2.3)"' 7.37'JD 9.1~ 0.21 .. 3.6J'JD 3.42'11 6.28'Jb Syauu llacuch Puk Richucboa TX 1982 6.2-4~ 3.!19~ -2.35 .. 7.12 .. 0.5~'11 -6.S8'JD 4.23~
TCAIIC&ICC Tcchooloc Comdof 1 couaUc& TN 1982 3.59'11 2.35'11 -1.24'11 248'A. 4.61'11 2.13'11 -3.37%
Tbe llc:acuch F01esr The Woodl.aod.a TX 198-4 11.16 .. 0.24'11 -10.K 3.~ .. 0.73 .. -2.31~ 13.22'11 Uaiv. Cc.atcl R&D Puk Tampa fL 1982 S.8l'Jb 660% 0.7Y-. 641 .. 4.~ .. -1.76'A. 2.S.S" Uaiv. Ql)' Scicacc U:otc~ PtU.l&dclpbi.a PA 196.3 0.32'11 1.7ti'A. 1.46 .. -0.12~ 3.87 .. 3.98 .. -2.52'11 Ualv. o{ Calif. - ltviAc Pule ltviAC CA 1983 4.11'11 616'11 2.19 .. 2.11~ -4 17'11 2.06'11 0.13~
[image:34.582.58.541.52.700.2]N Vl Name of Park Ada Research Park Ann Arbor Technology Park Arizona StUniv. Res. Park Carolina Research Park Central Florida Res. Park Charleston Research Park Cllicago Technology Park Cemson Research Park Connecticut Technology Park Cornell Research Park Omunings Research Park Engineering Research Center Great Valley Corporate Center Innovation Center and Research Park Interstate Business Park Johns Hop~s Bayview Resrch Campus Langley Research & Dev.Park Marylan~ Science & Tech.Park Massachusetts Biotech. Res. Park Miami Valley Research Park· Morpntown IDdus.&Res. Park
City Ada Ann
Arbor
Tempe Columbia Orlando Cllarleston Cllicago Cemson Storrs Ithaca Huntsville Fayetteville Malvern A1hens Tampa Baltimore Newport
News
Adelphi Worcester Kettering Morgantown
TABLE
1
Research
Park
HSuccessH
Indicators Research
[image:35.855.53.526.51.767.2]TABLE 2: Ranking of Parks by Success Indicators Paries "Successful" Using MSR120
Cornell Research Park Westgate/Westpark
Swearingen Research Park Research Triangle Park Synergy Research Park
University of Utah Research Park
Washington St. Uoiv. Research 4 Tecbn. Puk
Stanford Research Park
Massachusetts Biotechnology Research Park Connecticut Technology Park
University Center R&D Park
[novation Center and Research Park
Chicago Technology Park Rensselar Technology Park
Maryland Science & Technology Park Purdue Industrial Research Park
Paries "Successful" Using MSRlOO
Ohio State Univ. Research Park Central florida Research Park Cummings Research Park
Oemson Research Park
University Research Park (WI)
Morgantown Industrial & Research Park
University of California - Irvine Park
Miami Valley Research Park Great Valley Corporate C.enter
Engineering Research Center
"Unsuccessful" Parks
Ada Research Park
Carolina Research Park
Arizona State University Research Park Shady Grove life Sciences Center
Johns Hopkins Bayview Research Campus InteiState Business Park
Charleston Research Park Ann Arbor Technology Park Sunset Research Park
University City Science Center University Park (MI)
Richland Industrial Park
Tennessee Technology Corridor Princeton Forrestal Center University Rsearch Park (NC) Roswell Test Facility
Oregon Graduate Center Science Park The Research Forest
Langley Research & Development Park
9.48% . 8.16% 6.27% 4.45% 4.23% 3.66%
3.60% •
3.53% 3.48%
3.17%
2.55% • 1.94% •
1.66% 1.62% 1.44% 1.09% 0.77% 0.72% 0.40%
0.39% •
0.28% 0.23% 0.12% • 0.12%
0.09%
0.02% •
N -....)
Vintage Region Size (1980
population
range) Type
of University** Characteristics TABLE 3 Park "Success,. and Selected Characteristics Number of parks
Year established•
.Average difference
Percent successful MSR 100 }JSR120 I I I I Old
i
1950-70!
0.009!
58.3%!
50.0% ~---~---~:---~~----·---~,---~,---· 12 Middle-aged 18!
1973-82!
0.007!
72.2%l
55.6% I ---·~~----·---~~----·---+,---1 Young 15l
1983-84i
-o.009 ~ 40.0%i
13.3~ I I I Northeast 7 ! 1975.0!
0.017 71.4%!
57.1%~---~---~---~.---~---~.---· North-Central/Midwest
TABLE 4 OLS Regression Results
variable
constant
ru1heast regn dum nrthcntrVmidwst dum south regn dum vintage squared MSA population deed restriction dum garbage collect dum government subs dum university own dum
Dependent variable: DIFF in Table 1 Number of observations: 45 R1 = 0.28; Adj. R1 = 0.10 F-stat (9. 35) = 1.5008 Significance of F-Tut • 0.185 Significance level = 0.146
Coefficient
-0.0309 0.0135 0.0171 0.0128 2.87 E-5 2.43 E-9 4.88 E-3 0.0221 -0.0115
0.0227
TABLE 5
Std Error
(0.017) (0.019) (0.018) (0.016) (1.43 E-5) (3.95 E-9) (0.014) (0.013) (0.012) (0.012)
Results from Logit Model
Variable
nrtheast regn dum nrthcntrVmidwst dum south regn dum vintage squared MSA population deed restriction dum garbage collect dum government subs dum university own dum
Coefficient
-0.138 2.477 0.581 3.750 E-4 3.550 E-7 -1.625
3.000 -1.736
3.068 Dependent variable: 0/1 bued on value of DIFF in Table 5
Number of observations: 45 Log-likelihood statistic= -19.813
Rcstrided (Slopes=O) Log-liUlihood statistic
=
-30.645 Chi-squared (8) = 21.664Significance level :o:: 0.006 Percent succcssu predided c 76.1
Std Error
(1.520) (1.537) (0.001) (1.20 E-3) (3.22 E-1) (1.137) (1.266) (1.067) (1.352)
Sign l.eyel
0.067 0.490 0.358 0.422 0.050 0.549 0.730 0.096 0.350 0.072
Sign l,eyel
[image:38.579.75.537.60.577.2]