Methodologies for city-scale assessment of renewable energy generation
potential to inform strategic energy infrastructure investment
Katrina Adam
a, Victoria Hoolohan
a, James Gooding
a, Thomas Knowland
b,
Catherine S.E. Bale
a,c,d, Alison S. Tomlin
a,⁎
aEnergy Research Institute, School of Chemical and Process Engineering, University of Leeds, Leeds LS2 9JT, UK b
Leeds City Council, The Leonardo Building, 2 Rossington Street, Leeds LS2 8HD, UK c
Centre for Integrated Energy Research, University of Leeds, Leeds, LS2 9JT, UK d
Sustainability Research Institute, School of Earth and Environment, University of Leeds, Leeds, LS2 9JT, UK
a b s t r a c t
a r t i c l e i n f o
Article history:
Received 18 February 2015
Received in revised form 23 September 2015 Accepted 27 October 2015
Available online 18 December 2015
Keywords: City-scale
Solar resource assessment Wind resource assessment Distributed energy generation Renewable resource mapping Strategic energy management
In support of national and international policies to address climate change, local government actors across Europe and Asia are committed to reducing greenhouse gas emissions. Many recognise the contribution that decentralised renewable electricity production can bring towards reducing emissions whilst also generating rev-enue. However, these actors are often subject to significantfinancial pressures, meaning a reliable and compelling business case is needed to justify upfront investment. This article develops a method for rapid comparison of initial project viability for multiple city sites and installation options using data from wind and solar resource pre-diction techniques. In doing so, detailed resource assessments grounded in academic research are made accessi-ble and useful for city practitioners.
Long term average wind speeds are predicted using a logarithmic vertical wind profile. This employs detailed three-dimensional building data to estimate aerodynamic parameters for the complex urban surface. Solar re-source is modelled using a Geographical Information System-based methodology. This establishes the location and geometry of roof structures to estimate insolation, whilst accounting for shading effects from other buildings and terrain features. Project viability for potential installations is assessed in terms of the net present value over the lifespan of the technology and associated Feed-in Tariff incentive. Discounted return on investment is also cal-culated for all sites. The methodology is demonstrated for a case study of 6794 sites owned by Leeds City Council, UK. Results suggest significant potential for small-scale wind and solar power generation across council assets. A number of sites present a persuasive business case for investment, and in all cases, using the generated electricity on site improvesfinancial viability. This indicates that initial installations should be sited at assets with high elec-tricity demands. Overall, the work establishes a methodology that enables large city-level asset holders to make strategic investment decisions across their entire portfolio, which are based onfinancial assessment of wind and solar generation potential accurate to the individual asset scale. Such tools could facilitate strategic planning within cities and help to ensure that investment in renewable energy is focused at the most viable sites. In addi-tion, the methodology can assist with asset management at the city scale by identifying sites with a higher market value as a result of their potential for renewable energy generation than otherwise might be estimated.
© 2015 The Authors. Published by Elsevier Ltd. This is an open access article under the CC BY license (http://creativecommons.org/licenses/by/4.0/).
1. Introduction
Cities that are actively engaged in strategic energy management have the potential to contribute towards achieving national energy pol-icy goals, resulting in reduced carbon emissions and increased revenue generation (Allman et al., 2004; Platt et al., 2014). To facilitate such strategic engagement, rather than the implementation of piecemeal
“fund-chasing”projects, organisations require access to comprehensive,
jurisdiction-wide data, detailing the potential energy value of their assets (land and buildings). This paper describes methods for rapid high-level scoping of potential project viability across a city. We apply these methods to a case study in the city of Leeds, UK. The wind and solar resource available across the city-wide study area isfirst evaluated and then applied to annual power generation calculations.
Net present value (NPV) and discounted return on investment (ROI) are calculated for all site and installation options across the asset portfo-lio using user-defined inputs forfinancial conditions. Different options can therefore be rapidly calculated and compared. This novel approach enables organisations to make initial strategic investment and energy
⁎ Corresponding author.
http://dx.doi.org/10.1016/j.cities.2015.10.015
0264-2751/© 2015 The Authors. Published by Elsevier Ltd. This is an open access article under the CC BY license (http://creativecommons.org/licenses/by/4.0/).
Contents lists available atScienceDirect
Cities
management decisions across their whole asset base without recourse to individual site analysis performed on a one by one basis.
The paper is structured as follows. First, a contextual background for the work is provided. The methodology describes the hierarchical pro-cesses used to estimate the city's wind and solar resource, followed by thefinancial models and assumptions used to assess potential sites for theirfinancial viability. Estimations of the city-wide technical potential andfinancial calculations are then presented independently. In the dis-cussion, we consider the effects of variations in model input parameters on the predicted NPV, and the implications both generally and for policy implementation at local and national government levels. Finally, conclu-sions are drawn regarding the potential of integrated resource assessment models to enable strategic energy management at the city scale.
2. Context
Cities have a role to play in the development of distributed renew-able energy generation, and there are examples of progressive cities worldwide that have taken steps to deploy renewable energy technolo-gies including wind and solar (International Energy Agency, 2009). Since our case study city is based in the UK, we briefly examine the con-text of UK local authority (LA) engagement in distributed generation, whilst also noting where common policies and approaches can be found elsewhere.
2.1. Local energy governance
Localism, or increased local governance, is a current policy within the UK (DCLG, 2010) and seeks to empower cities to“do things in their own way”. Though localism is much broader than local energy supply and se-curity, greater decentralisation of energy generation, as envisaged in the 2011 White Paper (DECC, 2011), relies on increasing strategic planning at the city level (Johnston, 2011). Nevertheless, research estimates that just 30% of UK LAs are actively involved in strategic energy management (Hawkey et al., 2014). In their report, Hawkey et al. map our case study city of Leeds as an“energy leader”(p. 8), with“multiple activities in ener-gy developments”(p. 9). Despite this, significant challenges remain be-fore truly strategic approaches can be adopted within cities. Current energy projects by Leeds City Council (LCC) are linked to available funding opportunities rather than as a result of a long-term strategy; a situation that LCC is actively seeking to improve (Bale et al., 2012).
Recent UK government publications (DECC, 2014a, 2014b) demon-strate an expectation that LAs will take a lead in the development of local energy generation, through support to local communities, invest-ment in local energy schemes, or more targeted approaches for specific subsets of public buildings, e.g. schools. Furthermore, as ongoing budget restrictions are imposed on local government, LAs are considering a range of revenue raising and efficiency saving options including sale of property and land, and generation of alternative income streams. This study provides a means of assessing the value of these assets in terms of energy generation potential, and the associated ongoing revenue streams. Income may be derived either from investment in renewable generation on sites that may have otherwise have been sold, or through rental income from independent generators using the sites.
Distributed generation in the UK is supported by Feed-in Tariff (FiT) schemes, a policy measure which provides payment for every kilowatt hour of renewable electricity generated. FiT schemes have been deter-mined to be the most efficient means of encouraging the deployment of renewable technologies (Couture and Gagnon, 2010). The UK scheme is structured as a market-independent policy, with planned digression linked to deployment rates.
A number of other countries also have FiT policies, meaning that methodologies for supporting strategic investment in city-scale renew-able technologies are of value beyond the UK. In light of the topic of this special issue concerning energy and climate change mitigation across
Europe and Asian cities, here we highlight some policies that are rele-vant in Asia, as described byChen, Kim and Yamaguchi (2014).In Japan, a market-independent model is applied, with afixed price for purchasing renewable energy. South Korea, although having no national FiT scheme (discontinued due to thefinancial burden), still has local FiT schemes implemented at city-level in some jurisdictions. In Taiwan, FiT rates are adjusted by government in response to the cost of generating renewable electricity.
2.2. Barriers to investment in local energy
The barriers to investment in renewable technology are well known, and apply to many cities worldwide. For UK city authorities, barriers in-clude the complex subsidy mechanisms and contract set-ups for selling electricity from large-scale distributed generation developments. In ad-dition, lack of investment capital, complex organisational structures within local government, frequently changing national policy, and a lack of knowledge of the energy value of assets have all been cited as po-tential barriers (Allman et al., 2004; Kelly and Pollitt, 2011). A feature of the latter is the difficulty associated with the assessment of city-wide energy resources without resorting to multiple individual site studies. The need for affordable technological andfinancial advice at an early planning stage has been identified as a key component for the develop-ment of renewable energy schemes (Bale et al., 2012).
2.3. Resource assessment methods
To date, urban solar resource assessment has received more attention than urban wind within the literature. Early assessments used large-scale, low-resolution insolation estimates in conjunction with land and building classification methods to assess national (Šúri et al., 2007) and regional (Izquierdo et al., 2008) photovoltaic (PV) generation potential.
Since these earlier studies, the use of GIS methods to estimate available roof area for PV generation has become more established, opening up pos-sibilities for city-scale assessments.Bergamasco and Asinari (2011a) ana-lyse vector maps to calculate building footprint area, however theirfinal estimates for solar energy potential remain aggregated to the municipal scale.Kodysh et al. (2013)andBrito et al. (2012)useLightDetection
andRanging (LiDAR) data to estimate available roof area for PV installa-tion. Both of these methods develop insolation maps clipped to individual building areas. Kodysh et al.identify the opportunity to use insolation maps for estimating potential electricity yield, and Brito et al.actually es-timate a yield. Other studies focus on improving generation predictions through refined techniques for roof-area estimation (Bergamasco and Asinari, 2011b; Jacques et al., 2014). However, none of these methods con-siderfinancial aspects of realising the identified potential.
Urban wind speed estimation techniques are far fewer in number.
Peacock et al. (2008)state that methods to predict wind energy had thus far not been suitable for predicting output in an urban environ-ment, and tended to over predict wind resource. Subsequently a num-ber of studies have presented methods for calculating wind resource in the complex urban environment, using LiDAR data to estimate aerodynamic parameters based on detailed building characteristics over cities (Millward-Hopkins et al., 2013b; Weekes and Tomlin, 2013). However, there are few studies which address city-wide wind resource assessments. One such study (Millward-Hopkins et al., 2013a), highlighted the potential capacity of energy generation from building mounted wind turbines across Leeds, suggesting a sig-nificant urban wind resource if locations were carefully selected. As with the solar literature, no assessment of thefinancial viability of these sites is given.
assessment of multiple possibilities is desirable. In addition, knowledge of the resilience of strategic plans to changes in policy is an invaluable tool for the planning organisation. While resource assessment is well represented in the literature, few studies consider thefinancial aspects of installing technology to utilise the identified resources. Two exam-ples are:Li et al. (2014)who considered the NPV of optimised schemes in Ireland, based on various combinations of solar PV and micro-wind technology; andSun et al.(2013), who determined both the technical potential of the nine prefecture cities in Fujian Province, China, and a broader assessment of generation costs and NPVs across the region using a grid cell approach under two FiT scenarios. In neither case does the analysis extend to comparisons between individual sites.
As both resource assessment and GIS techniques have developed, so has the availability of tools to inform communities of the local energy resource (Bristol City Council, 2012; Van Hoesen and Letendre, 2010). These tools do not however, provide a platform forfinancial analysis which is required for strategic decision making.
This paper outlines a method to produce reasonably accurate yet rapidly available estimates offinancial feasibility that are spatially refer-enced to individual buildings within a large asset base. All analysis was completed using only two software programmes, Esri ArcGIS and Matlab, both of which are widely used in academia and industry. The method re-quires digital surface models (DSM) and digital terrain models (DTM); both generated from LiDAR data, and building footprint (shapefile) data. Open source GIS and numerical computation packages such as GRASS GIS and GnuOctave could be used to achieve the same results.
3. Research methodology
This study uses hierarchical methods to enable rapid scoping of project viability at 6794 potential renewable generation sites across Leeds. In a novel addition to existing analyses,financial assessment of multiple instal-lation scenarios at each individual site is undertaken. The stages of the methodology are shown inFig. 1. and described in detail in the subsequent text. The case study considers LCC assets, including used and unused land and buildings which lie within the extent of the available LiDAR data.
The underlying resource assessments are based on high resolution data describing building and vegetation geometries across the city. GIS tools are used both for resource assessment and presentation of outcomes, demonstrating the potential to provide a rapid overview of resources with a spatial reference. The methods described can be applied to any region for which high resolution LiDAR, reference clima-tology and land use data exist.
3.1. Wind
Development of wind turbines specifically designed with low start-up speeds and lower rated power means it is increasingly possible to produce significant energy from wind within an urban environment (Millward-Hopkins et al., 2013b). However, despite a number of
bene-fits such as demand reduction, decreasing transmission losses and allowing individuals to take more responsibility for their energy use, wind resource in the urban environment remains underexploited. Addressing this underexploitation,Millward-Hopkins et al. (2013b)
ascertained the potential for building-mounted turbines within the urban environment. This study assesses the potential for installing larg-er ground-mounted turbines at suitable locations within the city region.
3.2. Theoretical potential
A large variety of wind turbines are available in the UK, varying sig-nificantly in size and rated power output. In this work all wind turbines between 15 and 45 kW, certified under the UK Microgeneration Certifi -cation Scheme (MCS) are included, as they are suitable for the land available within an urban region and are eligible for FiT payments (Microgeneration Certification Scheme, 2014). Furthermore, varying
the size of the turbines allows the economic potential of turbines with different capacities and capital costs to be investigated. The hub-height of a mounted turbine significantly affects power output, since wind varies approximately logarithmically with height (Eq.1) and power is proportional to wind speed cubed. Different hub-heights were therefore considered for each turbine, subject to options available from the manufacturer. These would in reality also be affected by struc-tural and planning considerations.Table 1details the selected wind tur-bines and hub-heights, and estimates of installation costs obtained through correspondence with individual manufacturers.
Annual average wind speeds across the city were calculated using the method developed byMillward-Hopkins et al. (2013b), with the re-sults previously validated against measured data from 21 anemometers across 5 UK cities. The validation showed that the mean absolute error for sites not sheltered by nearby buildings (as is the case in this study) was less than 0.3 ms−1. The method provides a vertical scaling of long
term average wind speed data from a UK wide reference climatology database, in this caseNOABL (2014), to account for the frictional effects of the urban surface. As afirst step, the reference wind speed is scaled from its reference height of 10 m, up to a height where interference from the urban environment is deemed to be negligible; the top of the urban boundary layer. The wind speed is then scaled down in a two-step process to predict wind speed at the turbine hub-height using the standard logarithmic profile (Millward-Hopkins et al., 2013b):
u¼ uk ln z−d
z0
ð1Þ
wherez0anddare the aerodynamic roughness length and displacement
height respectively,u* is friction velocity,kis the Von Kármán constant (≈0.4), andzis height above the ground.z0is a parameterisation of the
drag force exerted on theflow due to the roughness of the surface (Weekes and Tomlin, 2013). The scaling is particularly sensitive to the parameterisation ofz0andd.In particular,Millward-Hopkins et al. (2013b)highlighted the need to account for building height variability within morphometric models used to estimate these parameters. Thus the aerodynamic parameters used in this work are estimated from a de-tailed digital surface model that is used to appraise the geometry and ar-rangement of buildings and vegetation within the city. Following the approach ofMillward-Hopkins et al. (2011);Millward-Hopkins et al. (2013b)this is achieved using detailed LiDAR data describing surface heights with a horizontal resolution of 2 m.
Thefirst step of the down-scaling process involves scaling the wind speed to an appropriate blending height, taken as the top of the rough-ness sub-layer (Kastner-Klein and Rotach, 2004). Above this height the wind profile is more greatly affected by an area extending 5 km upwind of the location, known as the upwind fetch; whilst below it the profile is more strongly influenced by the local geometry. The second step uses aerodynamic parameters specific to more localised 250 × 250 m grid-squares to estimate the wind speed at appropriate hub-heights.
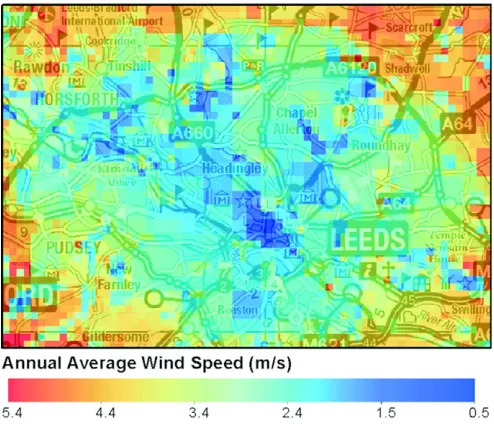
The scaling calculations are carried out for each 250 × 250 m area across the city, for eight wind directions. Long term average wind speeds are then calculated by weighting the predictions by the frequen-cy distribution of the wind direction measured at a local reference mea-surement site as detailed inMillward-Hopkins et al.(2013b). The predicted mean wind speeds can be presented as a city-wide map, with an example across Leeds, 10 m above the average building height within each grid square, shown inFig. 2.
3.3. Restricted potential
The following practical and technical criteria were used to create ex-clusion zones where a wind turbine would be inappropriate:
• Council sites beyond the wind map boundary (the region not covered by LiDAR).
• Polygons with areasb20,000 m2, accounting for the necessity of
locating turbines a suitable distance from nearby dwellings to avoid nuisance from noise orflicker. It is possible that wind turbines could be installed in smaller areas, but this limit was used to investigate op-timal positioning.
• Areas with a mean annual wind speedb5 ms−1at 20 m above ground level to account for the lower likelihood of a suitablefinancial return due to inefficient turbine operation. This is a somewhat more conser-vative value than that used byMillward-Hopkins et al. (2013a)but given possible uncertainties in wind speed predictions, a conservative approach was deemed to be appropriate.
3.4. Technical potential
The expected power output for each individual site was calculated for the selected turbines inTable 1based on the predicted long term av-erage wind speed and power curves giving the energy output of a tur-bine over a range of wind speeds under test conditions. These were acquired from the manufacturer for the CF15, CF20 and Ampair 20 (Ampair, 2012; C and F Green Energy, 2013a, 2013b) and estimated by Better Generation for the Kingspan 15 and WindEn 45 (Better
Generation, 2012a, 2012b).
The use of power curves should be based not on the long term aver-age wind speed, but on the frequency distribution of wind speeds. The Weibull distribution has been shown to give a goodfit to measured
wind speed data (Seguro and Lambert, 2000) and is used here. This dis-tributionf(u) is a function of the shape parameter,β, and the scale pa-rameter,η:
f uð Þ ¼βη uη β−
1 e−uη
β
ð2Þ
whereurefers to the wind speed,β= 1.8, as defined inBest et al. (2008)), andηis given by:
η¼ u Γ 1þ1β
ð3Þ
whereūis the long term average wind speed andΓrefers to the gamma function.
The annual energy output can then be calculated using:
Annual Electricity kWhð Þ ¼ Xn
u¼1p uð ÞXf uð Þ ð36524Þ n
u¼1f uð Þ
ð4Þ
wherep(u) is a the expected power output from the turbine at a given wind speedu, andf(u) is the frequency with which wind speeduis expected to occur based on the Weibull distribution. The summation is evaluated forufrom 1 ms−1to 25 ms−1at intervals of 1 ms−1. After applying the exclusion criteria, 51 individual sites across Leeds were identified for further investigation as shown inFig. 3.
3.5. Solar PV
Use of existing infrastructure for solar PV installation enables exten-sive deployment of distributed generation without changing land use.
“Permitted development”allows installation of smaller rooftop schemes without planning permission, and new UK government strategies are encouraging PV development at mid-range capacities (DECC, 2014b). Here we evaluate the viable resource for existing urban rooftops and land areas in Leeds.
3.6. Theoretical potential
Digital surface model (DSM) data obtained fromLandmap (2014)
[image:5.595.43.294.86.206.2]was used for the physical analysis. The DSMfile is generated from LiDAR points detailing ground height above sea level at 2 m resolution, and 0.15 m vertical accuracy. A raster map showing annual insolation at the same resolution was produced using the Area Solar Radiation
Table 1
Details of the turbines chosen for assessment and the cost of installation;acost estimates from sales team,bcost estimate from website (Ampair, 2012).
Turbine Rated power (kW) Hub-height (m) Initial cost (£)
WindEn 45 45 18 £180,000a
30 36
CF20 20 15 £81,000a
20
CF15 15 15 £75,000a
20 Ampair 20
20
15 £68,500b
18 £72,000b
22 £75,000b
Kingspan 15 15 15 £73,000a
[image:5.595.45.292.505.717.2]20
Fig. 2.Predicted mean wind speed across Leeds at 10 m above the average building height. © Crown Copyright/database right 2014. An Ordnance Survey/EDINA supplied service.
[image:5.595.312.561.535.709.2]function in the ArcGIS Solar Radiation toolset, licenced byEsri (2014)
and originally developed byFu and Rich (1999):
• Upward looking hemispherical viewsheds are created using the sur-rounding topography for each point on the raster surface.
• These are overlaid with sun- (direct) and sky-maps (diffuse sunlight) for each cell.
• The total radiation (direct plus diffuse) arriving at the cell surface in a specified time period is calculated (in this case one year).
• The process is repeated for all cells in the raster.
Default values for transmittivity (0.5) and diffuse fraction (0.3) were used.
Validation of the approach was carried out for selected sites by com-parison with data taken from interactive maps based on the PVGIS data-base for Europe (JRC European Commission, 2014;Šúri et al., 2005). The sites were chosen via analysis of the insolation raster to obtain the loca-tions of the three highest estimates at 10° slope intervals from 0 to 50° for each of E, SE, S, SW and W aspects. Sixty-nine such locations were found to exist within the LCC assets considered. These locations were compared with annual insolation estimates from PVGIS for the same lat-itude and longlat-itude, slope and aspect.
At all 69 data points, the highest values computed using the Area Solar Radiation tool were lower than those taken from the PVGIS data-base. This can be partly attributed to the shading effects captured by the viewshed technique in Solar Analyst. Differences between the estimates are larger at lower insolation levels, as shown inFig. 4. Refi ne-ment of the irradiance model could improve estimates at the individual building scale, but for the purposes of this study a conservative estimate provides a useful basis for analysis.
3.7. Restricted potential
LCC data was used to create two shapefiles showing the footprints of all buildings and boundaries of land areas respectively. Any shapefile polygon co-located with a listed building data point fromEnglish Heritage (2014)was excluded from the resource assessment due to ad-ditional planning and structural limitations at such sites.
Restrictions were applied to the original surface raster using condi-tional criteria shown inTable 2. Rooftop slope and aspect criteria were chosen to reflect best practise as determined through a review of existing literature (Melius et al., 2013). Land slopes were limited to 5° as this was considered shallow enough to enable installation of solar
panels facing any aspect with minimal ground works. Overlaying the in-solation raster with the reduced surface raster enabled mean inin-solation values to be extracted for cells meeting the surface criteria. LCC sites for assessment were identified by combining the reduced insolation raster and shapefiles. Mean annual insolation and total suitable area were cal-culated and recorded for these sites.
3.8. Technical potential
Potential annual electricity generation at each site was calculated using:
Annual Electricity kWhð Þ ¼KI0:76 ð5Þ
where K is installed capacity (kW), I is mean annual insolation (kWh m−2) and 0.76 is a conversion factor determined from
interroga-tion of the PVGIS online maps for a hypothetical 1 kW system within Leeds at various slopes and aspects (JRC European Commission, 2014). For all combinations of slope and aspect, the conversion factor from mean annual insolation (kWh m−2) to annual electricity generation
(kWh kW−1installed) was 0.89. Further assumed system losses of 15%
re-duced the conversion factor to 0.76.
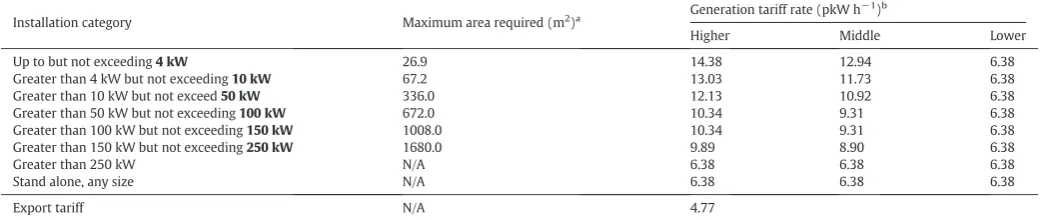
This study seeks to assess the feasibility of installations based, in part, on FiT revenue. Each roof was assessed for installation ca-pacities matching the upper limit of each of the UK Solar PV FiT boundaries (OFGEM, 2014b) as shown inTable 3, until the area re-quired for an array exceeded the property's estimated maximum area. The maximum capacity supported was also assessed using ap-propriate FiT rates eligible to 31st December 2014. Land was
assessed solely for the maximum possible installation size, due to a single tariff rate for stand-alone installations.
Previous methodologies have addressed potential roof area reduc-tions due to shading and roof furniture using reduction coefficients based on empirical data collected by early adopters of GIS assessment techniques (Gooding et al., 2013; Wiginton et al., 2010). Due to the highly varying nature of the roofs assessed, and constraints such as roof strength, this approach was not appropriate for this study. It is ac-knowledged that as the area required for an installation approaches the maximum suitable area on a property, obstructions and shading may limit practical installation capacities.
3.9. Financial potential: wind and solar
[image:6.595.301.552.86.120.2]Thefinancial potential of 6794 sites was assessed; 51 wind sites, 335 land sites for ground-mounted PV and 6408 rooftop PV sites. At each site, annual electricity generation estimates were combined with the assumptions inTable 4to calculate NPV and ROI over the 20-year lifetime of the FiT. Loan interest was based on 20-year an-nuity rates from the Public Works Loan Board (United Kingdom Debt Management Office, 2014) with repayments in equal instal-ments. Inflation was set to 2.5%, based on the Retail Price Index to which the FiT is linked. Electricity costs were based on correspon-dence with LCC. Operations and maintenance (OPEX) costs for wind are estimated based on data from larger wind turbines and wind farms and should therefore be assumed to contain a degree of uncertainty.
[image:6.595.36.283.527.708.2]Fig. 4.Comparison of mean annual insolation predicted by PVGIS and Esri models for 69 locations across the city of Leeds with the same slope and aspect inputs at each individual location.
Table 2
Surface criteria used to reduce the original surface raster to determine suitable areas for solar installations.
Assessment type Slope criteria Aspect criteria
Rooftop 0° to 60° 90° (E) to 270° (W)
3.10. Calculation of NPV and ROI
Calculating NPV and ROI enables direct comparison between technologies and installation sizes. NPVs were calculated for all possible installations at every site using:
NPV¼PRV−C ð6Þ
whereCis capital cost (CAPEX) andPRVis the present value of the in-stallation, calculated as:
PRV¼X N
t¼1 rt
1þf
ð Þt−1
1þL
ð Þt ð7Þ
Here,Nis FiT lifetime,fis inflation rate,Lis loan interest,rt.is annual
income andtis time. Annual income is calculated using:
rt¼½GþP xð Þ þEð1−xÞ Yð1−dÞt−1−ðKMÞ ð8Þ
whereGis FiT generation rate (received for every unit generated),Pis FiT export rate (received for units exported to the local grid, determined by the export fraction,x),Eis unit electricity cost,Yis electricity gener-ated in year one,dis degradation rate,Kis installed capacity andMis an-nual OPEX. The export fraction is assumed to be 0.5 for installations below 30 kW, while for larger installations electricity export would be metered.
Discounted ROI is calculated using:
ROI¼NPV
C ð9Þ
Due to a lack of reliable information for contemporary technology, salvage value has been excluded from all calculations. This will result in a conservative estimate of NPV and ROI. The division of the method-ology into two parts as shown inFig. 1enables straightforward alter-ation of the inputs, e.g. FiT rates, degradalter-ation rates or loan interest, to suit the user's specific situation.
4. Results
4.1. City-wide technical potential
The total generation potential identified across the LCC assets was substantial. Though the vast majority of sites returned positive NPVs, a larger percentage of solar sites were negative, in part due to the wind speed restrictions placed on initial wind site selection. Despite this, at least 75% of all sites returned a positive NPV in each scenario.
This large,financially viable resource provides a strong business case for investment in city-wide distributed generation, leading to both re-duced carbon emissions and increased revenue for the city authorities.
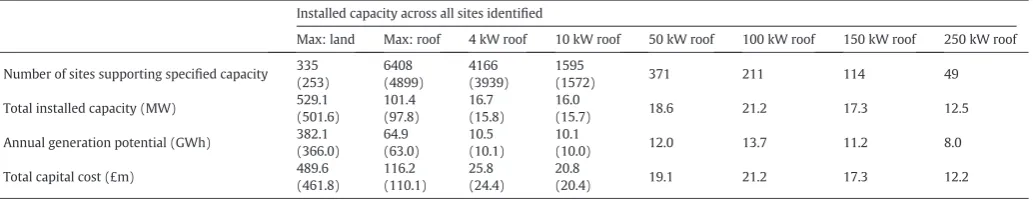
Table 5andTable 6show the city-wide total electricity generation po-tential, installed capacity and CAPEX if a single installation of each type specified was placed at each suitable site identified. Variations in NPV and ROI will be discussed in the next section.
4.2. Financial calculations
The NPVs and ROIs of potential installations at each identified site were calculated across the LCC portfolio using the methods and assump-tions detailed above. Reference cases used input values shown in
Table 4, and an export fraction of 0.5.
4.3. Wind
Fig. 5shows the range of NPVs and ROIs across all sites for each turbine and hub-height using the reference case. The largest capacity turbines in general give the greatest returns. Furthermore, returns in-crease with hub-height for all models investigated. Therefore any tur-bine should be installed at the maximum possible hub-height for the location in question. Negative returns were calculated at some sites for 15 kW turbines at a 15 m hub height.
4.4. Rooftop PV
[image:7.595.42.566.96.206.2]Fig. 6shows the range of NPVs and ROIs across all 6408 rooftop sites, calculated for the reference case at higher and middle tariff rates. All rooftop solar installations of 50 to 250 kW returned positive NPVs, while some of the smaller capacity installations at some sites returned a negative NPV. When more than 25 eligible installations are registered to a single recipient the tariff received for the 26th site onwards is re-duced from the higher to the middle rate (OFGEM, 2013). This reduces
Table 3
Generation and export rates for Solar PV installations eligible for the UK FiT (OFGEM, 2014b). Figures in bold are the installation boundaries used in this study.aBased on Sunmodule Plus SW250-270 mono black (SolarWorld, 2014),bInstallations with eligibility dates between October 1st and December 31st 2014 inclusive. The PV generation tariff is split into three levels: higher, middle and lower; the rate received varies with total installation numbers and building efficiency ratings (OFGEM, 2013).
Installation category Maximum area required (m2
)a Generation tariff rate (pkW h −1
)b
Higher Middle Lower
Up to but not exceeding4 kW 26.9 14.38 12.94 6.38
Greater than 4 kW but not exceeding10 kW 67.2 13.03 11.73 6.38
Greater than 10 kW but not exceed50 kW 336.0 12.13 10.92 6.38
Greater than 50 kW but not exceeding100 kW 672.0 10.34 9.31 6.38
Greater than 100 kW but not exceeding150 kW 1008.0 10.34 9.31 6.38
Greater than 150 kW but not exceeding250 kW 1680.0 9.89 8.90 6.38
Greater than 250 kW N/A 6.38 6.38 6.38
Stand alone, any size N/A 6.38 6.38 6.38
Export tariff N/A 4.77
Table 4
Assumptions and data sources forfinancial assessment;a
EVO Energy (2014);GMI Energy (2014);Solar Essence (2014),b
Leeds Solar (2013),c
Trading Economics (2014),d United Kingdom Debt Management Office (2014),e
OFGEM (2014a),f
OFGEM (2014b),g Staffell and Green (2014),h
SolarWorld (2014),i
EWEA (2014), andj
Dufton (2012).
Variable Wind Solar
Capital costs (CAPEX) Varies—seeTable 1 Varies—based on correspondence with installers listeda
, and website datab
FiT lifetime 20 years 20 years
Inflation rate 2.5%c
2.5%c
Loan interest 3.35%d
3.35%d
FiT rates OFGEM Tablese OFGEM Tables: Higher &
Middle ratef
Electricity cost 10 pkW h−1 10 pkW h−1
Degradation rate 1.6%g
0.7%h Annual operation and
maintenance (OPEX) £0.02 kW h
[image:7.595.43.292.609.743.2]the NPV of a site (Fig. 6a–c), but nevertheless the majority of sites and sizes still return positive NPVs.Fig. 6indicates that PV installations of 50 kW have the most favourable ROI. However, mean ROI at 50 kW (ap-proximately 0.7) is exceeded by mean ROI at the highest hub height for all but one of the wind turbine models, suggesting that in terms of effi -ciency, investments in solar installations cannot compete with larger wind installations.
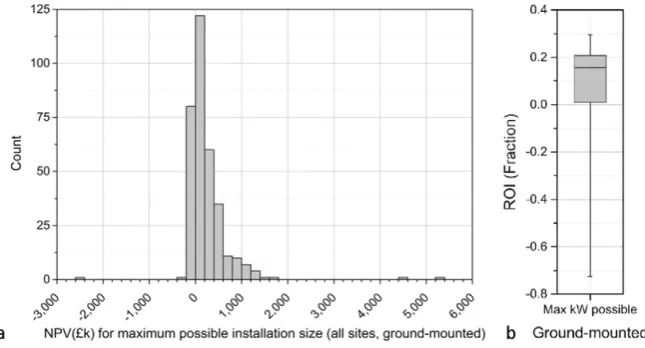
The huge variability in the maximum possible installation size be-tween sites (capacities ranged from 0.5–1129.75 kW) resulted in a cor-respondingly large range of NPVs (Fig. 6). This is illustrated in more detail inFig. 7, which shows the distribution of NPV groups for 6179 out of 6408 sites at maximum possible installation capacity, up to an NPV of £50,000. A further 228 sites had NPVs in excess of £50,000, and one site had a negative NPV of nearly−£45,000; these have been excluded for clarity due to their scattered nature.
4.5. Ground-mounted PV
Ground-mounted solar installations also have a large variation in NPV and ROI due to the large range of potential capacities across the 335 sites (7–26.8 MW).
Fig. 8shows the number of sites in each NPV group, demonstrating that just over 75% (253 of 335) of all ground-mounted sites return pos-itive NPVs. Of these, 131 sites return an NPV in excess of £200,000, with larger ground-mounted installations greatly exceeding the highest NPVs for rooftop PV and wind options. Conversely, the maximum ROI is lower than the majority of wind and rooftop options, indicating that despite its higher NPVs, ground-mounted PV is the least efficient invest-ment. This may be attributed to the structure of the FiT, in which stand-alone systems receive a lower generation tariff than either rooftop PV or wind installations.
For both rooftop and ground-mounted installations, returns increase with the size of the installation.Fig. 7is based on the middle tariff rate, due to the fact that if solar PV were extensively deployed by a city au-thority in the UK, most sites would receive the middle rate. To maximise NPV for rooftop PV, initial installations should be as large as possible to benefit from the higher tariff rate. No such restrictions apply to wind or ground-mounted solar PV, where a single tariff rate applies at each of the capacity intervals.
4.6. Mapping the potential
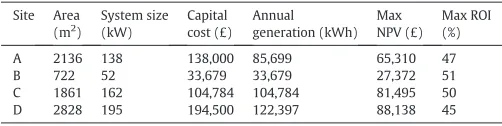
Figs. 5 to 9andTables 5 and 6provide an overview of the aggregated renewable energy resource across Leeds. In addition, the method devel-oped in this work produces spatially referenced data that can facilitate rapid comparison of the resource at individual locations.Fig. 9presents a section of the city-scale map of predicted NPVs for a highly localised site comparison.Table 7shows the associated site information attached to the GIS shapefile. The ability to map the capacity andfinancial data of each individual site enables strategic planners to quickly visualise data and identify the most suitable locations for investment. For example, here a planner is able to identify that although site D has the largest NPV, it is site B which would provide the greatest ROI. Similarly, the an-nual generation potential, NPV and ROI of site C all exceed that of site A, despite site A having a larger surface area.
5. Discussion
Estimation of the viable renewable electricity generation potential across a city, supported with mapped information showing thefinancial potential of each specific site, has the potential to provide city authori-ties with the power to disseminate easily-understandable information to a wide range of stakeholders. Although the information shows the relative merit of sites, details of the sensitivity of such a tool must also be understood to support a robust business case. In this section, we explore the sensitivity of the Leeds results to various input vari-ables, and discuss the implications of the results for Leeds and cities in general.
5.1. Effect of variables on NPV
[image:8.595.33.554.76.173.2]A variety of data sources and assumptions are used within the meth-odology described, and uncertainties in these could influence the pre-dicted energy generation andfinancial outcomes. The sensitivity is likely to be affected by the city in question, with UK-specific assump-tions, particularly the FiT, among the key variables in the Leeds case study. It is therefore crucial to assess the potential influence of input as-sumptions on the results. Input parameters were varied to assess their impact on the mean NPV across all sites. The percentage change, for
Table 5
Aggregated total generation potential for wind installation options across all sites. Bracketed numbers exclude sites with negative NPV.
Make WindEn 45 Ampair 20 CF20 CF15 Kingspan 15
Hub-height 18 30 36 15 18 22 15 20 15 20 15 20
Number of sites 51 51 51 51 51 51 51 51 51
(43)
51 51
(50) 51
Total installed capacity (MW) 2.30 2.30 2.30 1.02 1.02 1.02 1.02 1.02 0.77
(0.65)
0.77 0.77
(0.75) 0.77
Annual generation potential (GWh) 3.70 5.66 6.25 1.24 1.56 1.89 1.89 2.57 1.10
(0.97)
1.56 1.21
(1.19) 1.64
Total capital cost (£m) 9.18 9.18 9.18 3.49 3.67 3.83 4.13 4.13 3.83
(3.23)
3.83 3.72
[image:8.595.38.555.644.745.2](3.65) 3.72
Table 6
Aggregated total energy generation potential for solar installation options across all sites. Bracketed numbers exclude sites with negative NPV (middle FiT rate).
Installed capacity across all sites identified
Max: land Max: roof 4 kW roof 10 kW roof 50 kW roof 100 kW roof 150 kW roof 250 kW roof
Number of sites supporting specified capacity 335 (253)
6408 (4899)
4166 (3939)
1595
(1572) 371 211 114 49
Total installed capacity (MW) 529.1
(501.6)
101.4 (97.8)
16.7 (15.8)
16.0
(15.7) 18.6 21.2 17.3 12.5
Annual generation potential (GWh) 382.1 (366.0)
64.9 (63.0)
10.5 (10.1)
10.1
(10.0) 12.0 13.7 11.2 8.0
Total capital cost (£m) 489.6
(461.8)
116.2 (110.1)
25.8 (24.4)
20.8
both technologies, is expressed as a change from the mean NPV as cal-culated in the reference cases.Fig. 10summarises the results for the wind analysis where mean wind speed predictions and export fractions were varied. Thefigure demonstrates that the accuracy of the wind speed predictions is the largest factor affecting the NPV of the sites con-sidered, for all turbines and hub-heights. Installing a turbine with a higher hub-height has the dual benefit of realising a larger NPV in the
first place (Fig. 5), and reducing the sensitivity of the NPV to wind speed variations and the fraction of generated electricity exported. In all cases, decreasing the export fraction (i.e. using more electricity on site) improves the NPV in a UK setting.
[image:9.595.104.503.52.204.2]Varying the capital and operational costs and export fraction in the solar analysis, again shows that reducing the export fraction increases the NPV across all sizes of installation (Fig. 11). Siting to enable high
Fig. 5.Range of a) NPVs and b) ROIs across all 51 sites for reference wind case. Boxes show 25th, 50th and 75th percentiles; whiskers show maximum and minimum values.
[image:9.595.88.515.336.716.2]onsite usage rates could go some way towards offsetting a decrease in NPV should CAPEX and OPEX costs exceed original estimates.
5.2. Implications
The variation of NPV with export fraction provides a secure ratio-nale for deploying renewable generation installations at sites with the greatest demand for generated electricity. In Leeds, public ser-vice buildings owned by the city authority meet this criterion. Schools or leisure centres for example, often have the area required to install renewable generation, and the daytime demand to use the electricity produced. An alternative scenario can be envisaged in which renewable generation is combined with electric vehicle charging, once again matching supply with demand while simulta-neously improving the infrastructure for electric vehicles within a city. These scenarios, and others which can be readily imagined in other cities, have the potential to help cities meet the expectations upon them to“take a lead”in distributed energy generation, as discussed in the opening context, by showcasing renewable technol-ogy in a highly visible arena.
Mappingfinancial potential across a city has the potential to enable matching of viable sites with other city authority targets including
climate change mitigation. Sites located within areas of deprivation could be targeted as a means of reducing fuel poverty within the city; conversely, areas of economic wealth might be targeted to try and encourage greater numbers of private domestic dwellings to follow suit with renewable generation. Furthermore, using mapping as the mechanism for conveying the information is likely to increase the ac-cessibility of the information to potentially disparate personnel within a city authority, and can be used as a visualisation tool to en-gage external stakeholders. Through development of a suitable inter-face, information could be interrogated with ease for a number of applications. With an increasing emphasis on transparency and open access data, it could be feasible that such a tool could be de-ployed for wider use; providing groups with the opportunity to seek out suitable community-funded low carbon opportunities, or highlighting opportunities for renewables developers to rent land for their projects. This would have a dual benefit of providing a starting point for community groups, which can struggle to identify a suitable site for their aspirations, while at the same time reducing the burden of implementation for local government.
5.3. Policy implications
A clear advantage of the methodology developed here is that a broad sweep of potentiallyfinancially viable investment options can be iden-tified in a short time with limited staff resources. This is particularly beneficial in a policy environment wherefinancial incentives are con-stantly changing. In the UK, the reduction in FiT payments for solar PV installations over 25 in number for a single asset holder is perceived by LAs to be a significant barrier to installing PV extensively. Refining the rules for multiple installations is one possibility for increasing de-ployment rates within cities. However, this study demonstrates that there remains a huge potential for revenue generation notwithstanding the current FiT criteria.
Public support for urban wind turbines may be perceived by city authorities as lower than that for solar PV, but the higher starting NPV values, and single tariff rate available for unlimited installa-tions, may provide additional evidence to support viable wind installations.
6. Conclusions
[image:10.595.37.283.51.236.2]In this paper, the energy value of land and rooftops owned by Leeds City Council has been assessed for individual sites and installation op-tions over a city-wide region, demonstrating the value of the method for other cities. Estimates were achieved through the development of
Fig. 7.Numbers of rooftop PV sites with NPVs up to £50,000 at intervals of £1000 (middle FiT rate).
[image:10.595.132.455.554.728.2]a novel hierarchical modelling methodology, extending previous high resolution resource estimation methodologies to facilitate rapid calcula-tion, alteration and re-calculation of estimates offinancial potential, thereby providing a basis from which strategic energy investments can be planned. The model enables site-level data to be aggregated, pro-viding city-wide estimates of cost, installed capacity potential and antic-ipated electricity generation levels, for different scenarios. The approach facilitates the planning of future investment in climate change mitiga-tion through renewable energy generamitiga-tion, and in determining the value of city assets. The methodology is reproducible for other cities where relevant data can be made available, and is thus applicable be-yond the UK.
The effect of the stratified solar FiT policy in the UK was evaluated. Though returns are reduced for all installations exceeding the multiple installation limit, there remain large numbers of viable site across the city. Wind installations are not subject to the same restrictions, which may help to promote their deployment. Resilience to policy variation in a constantly-changing environment is likely to increase the likelihood of a scheme reaching site. The insights gained in this work provide the opportunity to plan for such resilience, increasing deployment of low carbon energy technologies to reduce carbon emissions while also gen-erating local economic benefits.
Data
This publication is supported by datasets, some of which are avail-able openly, and others that were obtained upon request and are subject to restrictions. LiDAR data was obtained from The Environment Agency through their publicly accessible data portal (http://environment.data. gov.uk/ds/survey#/). GIS data on land and estates owned by Leeds City Council was shared under a confidentiality agreement and cannot be distributed openly due to commercial sensitivity. All other datasets are referenced within the main text.
Acknowledgments
[image:11.595.313.560.52.220.2]This work was supported by EPSRC through grant number EP/K022288/1 and the University of Leeds Doctoral Training Centre in Low Carbon Technologies (grand number EP/G036608/1). The authors
Table 7
Technical andfinancial details for sites shown inFig. 9.
Site Area (m2
)
System size (kW)
Capital cost (£)
Annual generation (kWh)
Max NPV (£)
Max ROI (%)
A 2136 138 138,000 85,699 65,310 47
B 722 52 33,679 33,679 27,372 51
C 1861 162 104,784 104,784 81,495 50
[image:11.595.42.293.76.139.2]D 2828 195 194,500 122,397 88,138 45
[image:11.595.314.558.261.427.2]Fig. 9.Mapped sites across the city (left); the rectangle locates the section of NPV map shown (right). Numerical data for sites shown is listed inTable 7. © Crown Copyright/database right 2014. An Ordnance Survey/EDINA supplied service.
Fig. 10.Variation of mean NPV with input variables for all wind turbines considered.
[image:11.595.58.546.559.715.2]thank LCC for the supply of data and Professor Tim Cockerill for com-ments on thefinancial calculations.
References
Allman, L., Fleming, P., & Wallace, A. (2004).The progress of English and Welsh local authorities in addressing climate change.Local Environment,9, 271–283.
Ampair (2012). Ampair 20 kW Wind Turbine Specification.http://www.ampair.com/ wind-turbines/ampair-20kw-wind-turbine#technical[Accessed 14/04/2014]). Bale, C. S. E., Foxon, T. J., Hannon, M. J., & Gale, W. F. (2012).Strategic energy planning
within local authorities in the UK: A study of the city of Leeds.Energy Policy,48, 242–251.
Bergamasco, L., & Asinari, P. (2011a).Scalable methodology for the photovoltaic solar energy potential assessment based on available roof surface area: Application to piedmont region (Italy).Solar Energy,85, 1041–1055.
Bergamasco, L., & Asinari, P. (2011b).Scalable methodology for the photovoltaic solar energy potential assessment based on available roof surface area: Further improve-ments by ortho-image analysis and application to Turin (Italy).Solar Energy,85, 2741–2756.
Best, M., Brown, A., Clark, P., Hollis, D., Middleton, D., Rooney, G., ... Wilson, C. (2008). Small-scale wind energy technical report.Met office.
Better Generation (2012a). Proven 35 Wind Turbine.http://www.bettergeneration.co.uk/ wind-turbine-reviews/proven-35-wind-turbine.html.
Better Generation (2012b). WindEn 45 Wind Turbine.http://www.bettergeneration.co. uk/wind-turbine-reviews/winden-45-wind-turbine.html.
Bristol City Council (2012).Solar Energy: Solar map, is my house suitable?(https://www. bristol.gov.uk/housing/solar-energy#jump-link-0).
Brito, M. C., Gomes, N., Santos, T., & Tenedório, J. A. (2012).Photovoltaic potential in a Lisbon suburb using LiDAR data.Solar Energy,86, 283–288.
C & F Green Energy (2013a). CF15.http://www.cfgreenenergy.com/product_uk/cf-15 C & F Green Energy (2013b). CF20.http://www.cfgreenenergy.com/product_uk/cf-20 Chen, W. -M., Kim, H., & Yamaguchi, H. (2014).Renewable energy in eastern Asia:
Renew-able energy policy review and comparative SWOT analysis for promoting renewRenew-able energy in Japan, South Korea, and Taiwan.Energy Policy,74, 319–329.
Couture, T., & Gagnon, Y. (2010).An analysis of feed-in tariff remuneration models: Impli-cations for renewable energy investment.Energy Policy,38, 955–965.
DCLG (2010).Decentralisation and the localism bill: An essential guide.Department for communities and local government. London.
DECC (2011).Planning our electric future: a white paper for secure, affordable and low-carbon electricity.Department of Energy and Climate Change. UK: The Stationary Office Ltd.
DECC (2014a). Community energy strategy: Full report. London: Department of Energy and Climate Change https://www.gov.uk/government/publications/community-energy-strategy.
DECC (2014b).UK solar PV strategy part 2: Delivering a brighter future.London: DECC https://www.gov.uk/government/uploads/system/uploads/attachment_data/file/ 302049/uk_solar_pv_strategy_part_2.pdf.
Dufton, D. (2012).Solar PV cost update.Parsons Brinckerhoffhttps://www.gov.uk/ government/uploads/system/uploads/attachment_data/file/43083/5381-solar-pv-cost-update.pdf.
English Heritage (2014). Designation Data Download Area. http://services.english-heritage.org.uk/NMRDataDownload/.
Esri (2014).ArcGIS help 10.1: Area solar radiation (spatial analyst). Vol. 2014. EVO Energy (2014). EVO energy.http://www.evoenergy.co.uk/
EWEA (2014).Wind energy—The facts (volume 2). Costs and prices.(Online:http://www. ewea.org/fileadmin/ewea_documents/documents/publications/WETF/Facts_ Volume_2.pdf[accessed: 14/08/2015]).
Fu, P., & Rich, P. M. (1999).Design and implementation of the solar analyst: An ArcView extension for modeling solar radiation at landscape scales.Proceedings of the 19th an-nual ESRI user conferenceSan Diego, USA.
GMI Energy (2014). GMI energy.http://gmienergy.co.uk/.
Gooding, J., Edwards, H., Giesekam, J., & Crook, R. (2013).Solar city indicator: A method-ology to predict city level PV installed capacity by combining physical capacity and socio-economic factors.Solar Energy,95, 325–335.
Hawkey, D., Tingey, M., & Webb, J. (2014).Local engagement in UK energy systems—A pilot study of current activities and future impact.Energy technologies institute. Uni-versity of Edinburgh.
IEA (2009). Cities, towns & renewable energy: Yes in my front yard.https://www.iea.org/ publications/freepublications/publication/Cities2009.pdf.
Izquierdo, S., Rodrigues, M., & Fueyo, N. (2008).A method for estimating the geographical distribution of the available roof surface area for large-scale photovoltaic energy-potential evaluations.Solar Energy,82, 929–939.
Jacques, D. A., Gooding, J., Giesekam, J. J., Tomlin, A. S., & Crook, R. (2014).Methodology for the assessment of PV capacity over a city region using low-resolution LiDAR data and application to the city of Leeds (UK).Applied Energy,124, 28–34.
Johnston, A. (2011). The 10 pillars of local energy security.http://www.lgiu.org.uk/ report/the-10-pillars-of-local-energy-security/.
JRC European Commission (2014). Photovoltaic geographical information system– Inter-active maps.http://re.jrc.ec.europa.eu/pvgis/apps4/pvest.php.
Kastner-Klein, P., & Rotach, M. (2004).Meanflow and turbulence characteristics in an urban roughness sublayer.Boundary-Layer Meteorology,111, 55–84.
Kelleher, J., & Ringwood, J. V. (2009).A computational tool for evaluating the economics of solar and wind microgeneration of electricity.Energy,34, 401–409.
Kelly, S., & Pollitt, M. (2011).The local dimension of energy.EPRG working paper. Cambridge.
Kodysh, J. B., Omitaomu, O. A., Bhaduri, B. L., & Neish, B. S. (2013).Methodology for esti-mating solar potential on multiple building rooftops for photovoltaic systems. Sustainable Cities and Society,8, 31–41.
Landmap (2014). Landmap: spatial discovery.http://www.landmap.ac.uk/
Leeds Solar (2013).Leeds solar PV price comparison autumn 2013. ( http://www.leeds-solar.co.uk/price-guide).
Li, Z., Reynolds, A., & Boyle, F. (2014).Domestic integration of micro-renewable electricity generation in Ireland—The current status and economic reality.Renewable Energy,64, 244–254.
Melius, J., Margolis, R., & Ong, S. (2013).Estimating rooftop suitability for PV: A review of methods, patents and validation techniques.NREL (http://www.nrel.gov/docs/ fy14osti/60593.pdf).
Microgeneration Certification Scheme (2014). Product search.http://www.microgeneration certification.org/index.php?option=com_content&view=article&id=21&Itemid=155 Millward-Hopkins, J. T., Tomlin, A. S., Ma, L., Ingham, D. B., & Pourkashanian, M. (2011).
Estimating aerodynamic parameters of urban-like surfaces with heterogeneous building heights.Boundary-Layer Meteorology,141, 443–465.
Millward-Hopkins, J. T., Tomlin, A. S., Ma, L., Ingham, D. B., & Pourkashanian, M. (2013a). Assessing the potential of urban wind energy in a major UK city using an analytical model.Renewable Energy,60, 701–710.
Millward-Hopkins, J. T., Tomlin, A. S., Ma, L., Ingham, D. B., & Pourkashanian, M. (2013b). Mapping the wind resource over UK cities.Renewable Energy,55, 202–211. NOABL (2014). NOABL Database.http://www.rensmart.com/Weather/BERR OFGEM (2013).Feed-in tariff: Guidance for renewable installations (version 5).OFGEM. OFGEM (2014a). Feed-in tariff scheme: Tariff Table 1 October 2014 Non-PV only.https://
www.ofgem.gov.uk/publications-and-updates/feed-tariff-scheme-tariff-table-1-october-2014-non-pv-only.
OFGEM (2014b). Feed-in tariff scheme: tariff Table 1 October 2014 PV only.https://www. ofgem.gov.uk/publications-and-updates/feed-tariff-scheme-tariff-table-1-october-2014-pv-only.
Peacock, A. D., Jenkins, D., Ahadzi, M., Berry, A., & Turan, S. (2008).Micro wind turbines in the UK domestic sector.Energy and Buildings,40, 1324–1333.
Platt, R., Straw, W., Aldridge, J., & Williams, J. (2014).City energy: a new powerhouse for Britain.Institute for public policy research.
Seguro, J., & Lambert, T. (2000).Modern estimation of the parameters of the Weibull wind speed distribution for wind energy analysis.Journal of Wind Engineering and Industrial Aerodynamics,85, 75–84.
Solar Essence (2014). Solar essence.http://www.solaressence.co.uk/
SolarWorld (2014). Sunmodule plus SW250-270 mono black.http://www.solarworld.de/ fileadmin/downloads_new/produkt/sunmodule/datenblaetter/en/mono/mono_ black_250_en.pdf.
Staffell, I., & Green, R. (2014).How does wind farm performance decline with age? Renewable Energy,66, 775–786.
Sun, Y. -w., Hof, A., Wang, R., Liu, J., Lin, Y. -j., & Yang, D. -w. (2013).GIS-based approach for potential analysis of solar PV generation at the regional scale: A case study of Fujian province.Energy Policy,58, 248–259.
Šúri, M., Huld, T. A., & Dunlop, E. D. (2005).PV-GIS: A web-based solar radiation database for the calculation of PV potential in Europe.International Journal of Sustainable Energy,24, 55–67.
Šúri, M., Huld, T. A., Dunlop, E. D., & Ossenbrink, H. A. (2007).Potential of solar electricity generation in the European Union member states and candidate countries.Solar Energy,81, 1295–1305.
Trading Economics (2014). United Kingdom inflation rate.http://www.tradingeconomics. com/united-kingdom/inflation-cpi
United Kingdom Debt Management Office (2014).Public works loan board.(http://www. dmo.gov.uk/index.aspx?page=PWLB/PWLB_Interest_Rates[Accessed 07/05/2014]). Van Hoesen, J., & Letendre, S. (2010).Evaluating potential renewable energy resources in Poultney, Vermont: A GIS-based approach to supporting rural community energy planning.Renewable Energy,35, 2114–2122.
Weekes, S., & Tomlin, A. (2013).Evaluation of a semi-empirical model for predicting the wind energy resource relevant to small-scale wind turbines.Renewable Energy,50, 280–288.