Rochester Institute of Technology
RIT Scholar Works
Theses
Thesis/Dissertation Collections
2007
Effects of Freezing and Thawing on the Structures
of Porous Gas Diffusion Media in PEM Fuel Cells
Joaquin A. Pelaez
Follow this and additional works at:
http://scholarworks.rit.edu/theses
This Thesis is brought to you for free and open access by the Thesis/Dissertation Collections at RIT Scholar Works. It has been accepted for inclusion
in Theses by an authorized administrator of RIT Scholar Works. For more information, please contact
Recommended Citation
Effects of Freezing and Thawing on the
Structures of Porous Gas Diffusion Media in
Approved By:
PEM Fuel Cells
by
Joaquin A. Pelaez
A Thesis Submitted in
Partial Fulfillment of the
Requirement for the
MASTER OF SCIENCE
IN
MECHANICAL ENGINEERING
Dr. Satish G. Kandlikar
Department of Mechanical Engineering
Dr. Steven Day
Department of Mechanical Eningeering
Dr. Jeffrey Kozak
Department of Mechanical Engineering
Dr. Edward C. Hensel
Department Head of Mechanical Engineering
DEPARTMENT OF MECHANICAL ENGINEERING
THESIS REPRODUCTION PERMISSION STATEMENT
Permission Granted
Title of Thesis: Effects of Freezing and Thawing on the Structures of Porous Gas
Diffusion Media in PEM Fuel Cells
I
, Joaquin
A.
Pelaez, hereby grant permission to the Wallace Library of the Rochester
Institute of Technology to reproduce my thesis in whole or in part
.
Any reproduction will
not be for commercial use or profit.
Abstract
Fuel
cells are avery
promising
technology
for
transportation applicationsin
thefuture.
Many
companiesareperforming
researchin
ordertomaketheimplementation
offuel
cell-powered vehiclesmorefeasible.
One
issue
thatneedstobe
addressedis
thefact
that
fuel
cellvehicles willbe
usedin
sub-freezing
climates.Vehicles
undergofrequent
shut-down and
startup
events, and assuch,freezing
andthawing
effects onfuel
cellcomponents
become important
whenthevehicleis
shut off andleft standing in
coldclimates.
When
shutoff,fuel
cellswill maintainwaterin
themembrane electrodeassembly
(MEA)
and gasdiffusion layer
(GDL)
unlesscertainpurging
protocols arefollowed. Excessive purging
willlead
tomembranedryout
andincreased
systemcosts.Understanding
theeffectsofrepeatedfreeze-thaw
cycling
ontheGDL is
criticalin
developing
effectivepurging
techniques.When
thecellis
subjectedtosub-freezing
temperatures,
thewaterremaining in
thesemediawillfreeze. This
freezing
couldhave
adetrimental impact
onthepore structure,fiber
integrity,
andbinder
effectivenessin
theGDL,
thereby
decreasing
the electrochemicalactive surface area oftheelectrolytes andhurting
the overall performance ofthecell.This
thesispresents a numericalsimulationtohighlight
thedamage
causedby
freezing,
followed
by
an experimentalstudy
toobservetheseeffects
in
aGDL
under a compressed state torepresentactualfuel
celloperating
conditions.
This study
validatesthedamage incurred
throughfreeze-thaw cycling
andconfirmstheneed
for
developing
cost-effectivepurging
protocols.Another
finding
ofthis
study
is
theusefulness of electrical resistancemeasurementtechniquesin
identifying
Table
of
Contents
Abstract iii
TableofContents iv
ListofFigures vii
ListofTables xi
Nomenclature xii
SymbolsandAbbreviations xii
Greek xiii
Subscripts xiii
1. Introduction 1
2. Literature Review 4
2. 1.
Freezing
structural effectsin Porous Media 52.2. Waterand
freezing
behavior in PEMfuelcells 92.3. PEM
Freezing
Performanceend-effects 143. Objectives
3.1. Research Needsinstudying GDL freezeeffects 20
3.2. Objectivesofthepresent work 20
3.3. Approach 21
4. Analytical
Modeling
244.1. Model 24
4.2. Material Properties 27
4.3. Results 31
4.4. Discussion 34
5.1. Objectivesoftheexperimentalstudy 36
5.2. Test Section 37
5.3. GDL Samples 40
5.4. Test Section Compression Fixture 41
5.5. Air
Supply Loop
435.6. Water
Supply Loop
445.7. Electrical System 45
5.8. High-Speed Videosystem 48
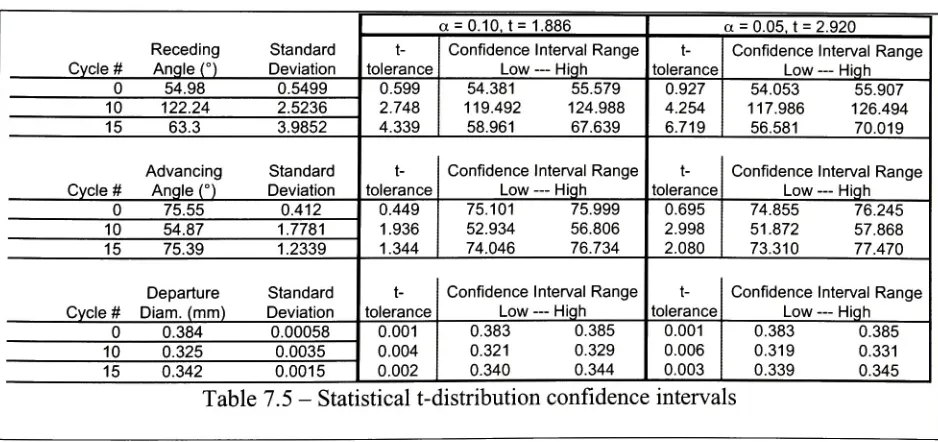
5.9. Experimental Parametersand
Uncertainty
505.9.1.
Uncertainty
inElectricalResistance 505.9.2.
Uncertainty
in Differential Pressure Measurements 515.9.3.
Uncertainty
in Droplet Departure Measurements 526. Experimental Procedure 53
6.1. Thermal
Cycling
536.2. WaterandAir supply Procedures 54
6.3. Performance
Testing
616.3.1. GDL Through-planepressure
drop
6 16.3.2. Electrical Resistance 62
6.3.3. Droplet Behaviorobservation 64
6.3.4. Beginning- andEnd-of-live Surfaceobservation 64
7. Data ReductionandAnalysis 66
7. 1. Electrical Resistance 66
7.2. Through-PlaneAir Flow Measurement 72
7.3. ImageAnalysis: Contact Angle 73
7.4. Image Analysis: Visual Damage Inspection 79
8. ResultsandDiscussion 82
8.3. Contact AnglesandTeflon Content 86
8.4. Visible Damage Mechanisms 87
9. Conclusions 107
References 109
Future Work 112
List
ofFigures
Figure 1.1 - PEM fuel
cellcross section 2
Figure2.1-Sample Matrixused
by
Salmonet.al[16]
5Figure 2.2- Percolation Clusters from Salmonet.al
[16]
6Figure 2.3- Hori's
micro-crackstress model
[15]
7Figure 2.4- Frost
depthandheaveovera6-mo. Period
[14]
8Figure2.5- Frost
heave inporous material
[10]
9Figure 2.6- Location
oficelensformation
[10]
10Figure3.1-PEMreactantgas path 23
Figure 3.2- PEM
current path 23
Figure4.1-LocationofGDLmodeled region 24
Figure 4.2- Model
areas 25
Figure 4.3
-Meshedareas 30
Figure 4.4- Nodes
andtemperatureapplication 32
Figure 4.5
-Nodaldisplacements 32
Figure 4.6
-Stress iny-direction 33
Figure 4.7
-Von MisesStresses intheGDL 33
Figure5.1-Complete
testing
loop
37Figure 5.2- Flattened
electrode
tip
usedinresistance measurement probes 38Figure 5.3- Electrode
bottomsfixedtochannel plates 39
Figure 5.4
-Electrodetipson channel plates 40
Figure 5.5- Compression
Figure 5.7- Air
loop
schematic:(3)
electrodes,(9)
airtank,(10)
airregulator,(11)
air 43rotameter,
(12)
airtestsectioninlet, (13)
testsection air/water outletFigure 5.8
-Water supplyloop:
(1)
syringepump,(2)
testsection waterinlet,
(3)
44electrodes,
(4)
testsection wateroutlet,(5)
t-fitting,(6)
pressuretransducer,
(7)
bleedvalve,(8)
bleedtube exit,(15)
computerFigure 5.9- Four-point
methodfor measuringelectrical resistance ofGDLsamples 45
during
freezetesting
Figure5.10-Electrodeand wire solder connections 47
Figure5.11-Mountedtestfixturewithwire connections 48
Figure5.12- High-speedcamera
setup 49
Figure5.13-Video
lighting
setup 50Figure 6.1 - Electrode
placementinchannels 63
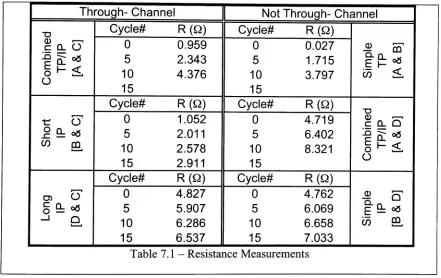
Figure7.1-Combined Through-Plane/In-Plane [A &
C]
68Figure 7.2- Short In-Plane [B &
C]
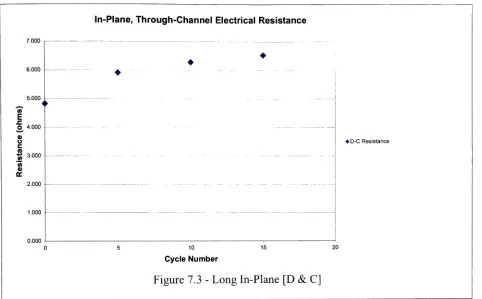
68Figure 7.3
-Long
In-Plane[D &C]
69Figure 7.4- Simple Through-Plane[A &
B]
70Figure 7.5- Combined Through-Plane/In-Plane [A &
D]
70Figure 7.6- Simple In-Plane [B &
D]
71Figure 7.7
-Airflowresistance plot 73
Figure 7.8- Droplet
measurements 75
Figure 7.9- Contact
angle plot 78
Figure7.10-Departure diameterplot 78
Figure7.11-Videotestmatrix 79
Image 7.12- Keyenceconfocal microscope and stagefor GDLobservation 80
Figure 8.2
-AOO Before Thermal
Cycling,
450x 88Figure 8.3
-AOO After Thermal
Cycling,
450x 88Figure8.4
-A07 Before Thermal
Cycling,
450x 89Figure8.5- A07
After Thermal
Cycling,
450x 89Figure8.6
-A15 Before Thermal
Cycling,
450x 90Figure 8.7
-A15 After Thermal
Cycling,
450x 90Figure8.8- MOO Before Thermal
Cycling,
450x 9 1Figure8.9-MOO After Thermal
Cycling,
450x 91Figure8.10-M07 Before Thermal
Cycling,
450x 92Figure8.11-M07After Thermal
Cycling,
450x 92Figure 8.12- M10 Before Thermal
Cycling, 450x,
#1 93Figure 8.13
-M10 After Thermal
Cycling,
450x,
#1 93Figure8. 14
-M10 Before Thermal
Cycling, 450x,
#2 94Figure 8.15- M10 After Thermal
Cycling, 450x,
#2 94Figure 8.16
-M15 Before Thermal
Cycling,
450x 95Figure 8. 1 7
-Ml 5 After Thermal
Cycling,
450x 95Figure 8. 1 8
-ZOO Before Thermal
Cycling, 450x,
#1 96Figure 8. 1 9- ZOO After Thermal
Cycling, 450x,
#1 96Figure 8.20- ZOO Before Thermal
Cycling, 450x,
#2 97Figure 8.2 1- ZOO After Thermal
Cycling, 450x,
#2 97Figure 8.22
-Z07 Before Thermal
Cycling, 450x,
#1 98Figure 8.23
-Z07 After Thermal
Cycling, 450x,
#1 98Figure 8.24- Z07 Before Thermal
Cycling, 450x,
#2 99Figure 8.25
-Z07 After Thermal
Cycling, 450x,
#2 99Figure 8.26- Z07 Before Thermal
Cycling, 450x,
#3 101Figure 8.27- Z07 After Thermal
Cycling, 450x,
#3 101Figure 8.28- Z10 Before Thermal
Figure 8.30- Line
fracture in GDLafter removal 1 03
Figure8.3 1
-Linefractureafterremoval,focalplane#2 104
Figure 8.32- GDL
gas channelimpression 105
Figure 8.33- GDL
List
ofTables
Table 4.1- Water
thermalproperties 28
Table 4.2
-Structural PropertiesofGDLand water 29
Table 6.1 - GD L
weights with water 5 5
Table 7.1- Resistance
Measurements 66
Table 7.2- Electrical
curvefit data 72
Table7.3- Pressuremeasurementdata 72
Table 7.4- Droplet
Angle Data 76
Table7.5- Statistical
Nomenclature
Symbols
andAbbreviations
e
-Charge
onone electronF
-Charge
on one mole of electronsGDL
-Gas
Diffusion Layer
GDM
-Gas Diffusion Media
I
-Current
MEA
-Membrane Electrolyte
Assembly
MPL
-Micro-porous
layer
N
-Avogadro's
number n-Sample
sizeOCV
-Open Circuit Voltage
Pe
-Electrical
power outputoffuel
cellPEM
-Proton Exchange Membrane
orPolymer Electrolyte Membrane
PEFC
-Polymer Electrolyte Fuel Cell
PEMFC
-PEM Fuel
Cell
R
-Resistance
s
-Sample
standarddeviation
V
-Voltage
Vc
-Fuel
cell operational voltage
x
Greek
A
-Stoichiometric
ratio\i
-Population
meanSubscripts
a
1
-Introduction
Fuel
cells, andpolymer-electrolytemembranefuel
cells(PEMFCs)
in particular,
are avery promising
technology
for
transportationapplicationsin
thefuture.
They
offertheadvantageofzero
local
emissions, as ahydrogen
fuel is
theonly
requiredinput,
and clean wateris
theonly
product ofthechemicalreaction
occurring
during
operation.Additionally,
PEM
fuel
cells arelow-temperature
fuel
cellsincethey
operateat about80C. This
allowsfor
shorterwarm-up
times than thatrequired
for
ahigh-temperature fuel
cell.For
these reasons,many
companies areperforming
researchin
ordertounderstandthefundamental underlying issues
and maketheimplementation
offuel
cell-poweredvehicles morefeasible.
A
basic PEM fuel
cell unititself
consists of nomoving
parts,whichis
a greatadvantageovercurrentpetroleum-or diesel-
fueled internal
combustion engines.Each
individual
cellin
astack
is
composedof severalparts, as shownin Figure 1.1.
The
basic
PEM
fuel
cell unitis
shownontheleft-half
ofFigure 1.1. On
eitherside ofthecell, a
bipolar
plateis
usedfor
several purposes.First,
thebipolar
platehas
gas channelsmachined,
stamped,
ormoldedinto
theirfaces. These
channelsareonthe order of1mm
in
their4
*area
hydraulic
diameter,
Dh
(Dh
=),
or smaller.These
gaschannelsserve tocarry
the perimeterreactant gasestoall points oftheactive surface and remove productwater
from
thecell.Inward
ofthe
bipolar
plates arethegasdiffusion layers (GDLs). These GDLs
allowthereactant gasestoreachthecatalyst sites andtoallow productwaterto travel
from
thecatalyst sitesto thegaschannels
for
removal.The
catalystlayer,
typically
platinum,is bonded
toeitherside ofthepositively-chargedprotons
(Hydrogen
ions)
todiffuse
from
theanode-sideto thecathode-sidereaction sites.
\|/ \|/Nj/yv\|/ y
Air-Side Bipolar Plate" "
Membrane "CatalystLayers "GasDiffusion Layers
Hydrogen-SideBipolar Plate
*' .n.
cz
rz
LZ
V V y V
1
.77
Figure
1.1-PEM fuel
cell cross sectionThe fuel
cell operatesusing
thereverseelectrolysis process.Oxygen
or airis
delivered
tothecathode side, and
hydrogen
is delivered
to theanode side.On
thehydrogen
side,themolecules are split
into
positively-charged protonsand negatively-chargedelectrons.The
protons, as
previously
mentioned,diffuse
throughthemembrane andreducetheoxygenmoleculesto
form
water.To
completetheelectrical circuit,however,
the electrons musttravelthrough anexternal
load
connectedto theendsofthefuel
cell stack.This
chemical reactionprovidestheelectricalpowerofthe
fuel
cell.The
righthalf
ofFigure 1.1
showsthatwateris
produced atthecatalyst sites
between
theGDL
andthemembrane.From
here,
thiswater must [image:16.532.39.466.94.401.2]Unfortunately,
thiswaterpresents operational anddurability
concernsin PEM
fuel
cells.Fuel
cellscurrently
employedin
static power applications are sometimes mountedoutdoors,
andin
cold weatherapplications,damage
to theMEA
canbe
causedby
freezing during
periods offuel
cellshutdown.This is because
waterremainsin
thefuel
cellif
notproperly
purged.If
fuel
cells are
implemented into
productionvehicleson alarge
scale, thesepowerplantsmay
potentially
sufferthesamefate.
Four
aspects offuel
celloverpotentials,orlosses,
are asfollows:
activationlosses,
fuel
crossover and
internal
currents,ohmiclosses,
and masstransportlosses.
The
twoareasthat theGDL
plays animportant
rolearetheohmiclosses
andthe masstransportlosses. Ohmic losses
are relatedto theelectrical resistance of
many
ofthefuel
cellcomponents.The
membrane mustadequately
conductthe protons,andtherest ofthefuel
cell's electrical circuit mustproperly
conducttheelectrons.
The
catalyst sites must make proper contactwiththemicro-porouslayer
(MPL)
andtheGDL,
whichin
turn,
must make contactwiththecurrent-collecting bipolar
plates.The
masstransportin
theGDL
pertainstohow easily
thereactant gases reachthecatalyst sitesand
how easily
water canbe
removedfrom
thecatalyst sitesinto
thegas channels.The
focus
ofthepresentworkis
tostudy
thefreezing
effects on aGDL. This
damage is
expectedtomanifest
itself in
thesurface oftheGDL
through thehydrophobic
propertiesorphysical structure, thepore structurethrough
changing
airtransport properties,orthroughthestructurethat
impacts
electrical properties.A
detailed
literature
reviewis
presentednext,2
-Literature
Review
A
greatdeal
ofresearchhas been
performed as to theability
offuel
cells to startup in
cold climates
[1-6]
and on the effect offreeze-thaw cycling
on the performance ofPEM fuel
cells
[6-13],
but
thereis
little
published work ontheprecise effects that thefreeze-thaw
cycling
has
onthepore andfiber
structureofthegasdiffusion
mediathemselves.Previous
researchdetails
thefreezing
andthawing
effects ofconcrete and soil[14-17],
asthese two materialsare
commonly
presentin
sub-freezing
climates, are exposed toliquid
water,and
have
theability
tocarry
theliquid
waterusing capillary forces.
There
aregenerally
twodifferent
phenomenathatareusedtodescribe
thefreezing
effectsin
porous media.The
first is
a simple9%
volumetric expansion astheliquid
waterfreezes
andforms ice.
This
theory
is
appropriatefor
water,but degradation
effectshave been
shownfor
fluids
that contract uponfreezing,
such asbenzene
and nitrobenzene[17].
The
theory
thatis
used
in
this caseis frost
heave,
in
which subcooledliquid
waterdiffuses
towardice
lenses,
causing
theselenses
to grow.Frost
heave
is
dependent
on the presence ofliquid
waterand theability
ofthe porous material to allowwatertodiffuse
throughout themedia.This
chapter willpresentthe
different
theories ofporousstructuredegradation,
and review publishedwork ontheprevious research that
has
been done
on thefuel
cell system and the effects offreeze-thaw
2.1
-Freezing
Structural
effectsin Porous Media
To
morefully
understandthefailure
phenomenain
theporous materialsin
a polymerelectrolyte membrane
fuel
cell(PEMFC),
it
is beneficial
tounderstandthefreeze/thaw
phenomena
in
otherporous materials.This
section providesanoverview ofbasic
freezing
behavior
due
toavolumeincrease
aswaterfreezes,
aswellas a more advanced concept calledfrost
heave. These
phenomenaarediscussed in
referencetoporous materials such as soil andcement,aswellaswithrespectto
PEM
fuel
cells.Salmon
et.al[16]
exploresdegradation in
porous material as a result of a volumeexpansion as
liquid
water changesits
phase toform ice.
To
model this volumetric change, aporous medium was modeled as a matrix or
lattice.
Each ny location in
the matrixis
representativeofa poreat
location
row and columnj,
and with size givenby
the valueofny.() 0>) (c)
0 78 0.99 0 58 0.45 0.91 0 78 099 0.58
B3
0.91 0.78 0.990.58 086 0.910.19 0.67 0 81 0 12 0.70 ^80670.8lR!l^w! 0.31 0.67 0.81 0.27 0.94
0.84 0.75 0.620 980.72 0.84075El098
d
D.S3^P!^S|^M
0.84 0.7S 0.09 0.98 0.78
035083O.S0 0.09 0.36 0.46 0.83 0.87 0.39 0.72
0.60081 0.77 0.16 0.91 waai <ku[*e uuj n n n II II
0.84 0.95 0.80 0.51 0.99
Figure 2.1
-Sample Matrix
usedby
Salmon
et.al[16]
Figure 2. 1
shows the5x5
sample matrix, andeach cell(or pore)
is
assigned adifferent n^
sizevalue.
The fluid
transport methodis
called theinvasion
percolation movement, thebasis
ofwhich
is
capillary
action.The basic
principleis
that thesmaller pores willbe filled first due
tosaid
capillary forces.
All
pores adjacent to afilled
pore willthenbe
filled
with priorityon thesmallestpores,
just
asin
thefirst iteration
or time step.When
asatisfactory cluster of poresis
simulation,
each pore size valueis
increased based
on a simple algorithm.As
the simulationis
repeated, thepore sizes evolve.
D=l n=2 n=3
Figure 2.2
-Percolation
Clusters from Salmon
et.al[16]
Figure 2.2
shows aninteresting
behavior
offluid invasion using
a200x200
matrix.At
successive
iterations
ofthe simulation, theinvasion
clustersdo
not repeat.This behavior is
referred to as "self-avoiding" and
is due
to the simulatedincrease in
size of each porein
thefreeze/thaw
cycle ofthe previous cluster.This
themeis
commonfor
othercommonly
acceptedpore growth algorithms aswell.
Hori
[15]
expands upon the simple volume expansion principle and elaborates on thetopic of
frost damage
to porousbrittle
material.Unlike Salmon
et.al[16],
Hori
explains thisphenomena
in
terms oflarge
poresfurther expanding
and smaller porescontracting
uponfreezing.
When
the waterfrozen in
the poresthaws,
it
canflow
through the enlarged pores,thereby
further
increasing
their size andamplifying
theirreversible damage.
Hori
models thecracked solid
tt
pore structure
^1
_L--^ Applied stress ^..L___i_^_a,macrostress
u
&
')
(
/
-JLn. ;
i
isolatedcrackin infinile domain
Figure 2.3
-Hori's
micro-crack stress model[15]
The
stressesdue
to theincreased
volume ofice
can cause the micro-cracks to grow,thereby
causing
adeformation
andaloss
of stiffness.This
model examineshow
thedegradation
affectsthe
deformation in
the structure ofa cave.The
three majorfactors
that mustbe
takeninto
consideration when
determining
the extent of thedamage
to the porous structure are(1)
thetemperature to which the material
is
cooled,(2)
the number ofthermal cycles the materialis
subjected
to,
and(3)
the externalloads
applied to the material.A
certaincooling
temperaturemust
be
reachedbefore
any
damage is
sustainedto the material, and thedamage
willbe
moresevere as more extreme
cooling
temperatures are attained.Additionally,
the number ofthermalcycles will
increase
the extent ofthedamage.
However,
each subsequent cycle willhave
adecreasing
damage
contribution until additional wateris
introduced
to the system.The final
factor
contributing
to the extent ofdamage due
tofreeze
andthawcycling is
theexternalload(s)
appliedto the media.
Hori
statesthat afree-standing
medium will sustain moredamage
than amedium subjected to compressive
forces.
However,
as the compressiveforces
exceed a certainthreshold,
they
can contributetoirreversible
shrinkage orcompressionofthemedia asaresultofWhile
asimplevolumechangeis
a convenientmodel,
another phenomenonthatexistsin
porous materials
in
freezing
climatesis
calledfrost heave.
Hermansson
andGuthrie
[14]
providea
very
detailed
description
ofhow frost heave
occursin
brittle
materials.While
soilis
used asthe media
in
whichtostudy frost
heave,
thisconcept canconceivably
be
appliedto thestudy
ofice
formation
in
fuel
cells.Frost
heave is
theforemost
contributorto thedegradation
of pavedsurfaces
in
cold climates.<#* <*> cj=
dp < & o> # of> 6> < cf> & #
Date
|
-FrostDepth ?Frost Heave
|
Figure 2.4
-Frost
depth
andheave
over a6-mo. Period
[14]
Figure
2.4
illustrates
thefrost depth
and magnitude offrost heave
over anapproximately
6-month period.
While
frost heave
appearsduring
periods ofsub-freezing
temperatures,
it has
consequences
in both
the cold and warm periods.When
the soilis
subjected tosub-freezing
temperatures and
frost
heave
is
present, the surface ofthe pavement canbecome
cracked andotherwise marred.
In
warmperiods, whenthe soilis
nolonger
freezing,
thedamage incurred
by
the
frost heave
canlead
to adepreciated
load-carrying
capacity.The
existence and magnitude offrost heave itself depends
on severalfactors,
such as thedepth
ofthefrost,
the availability ofavailable.
Supercooled liquid
watermay
stillexistin
the media attemperaturesbelow freezing.
Due
topressure gradientsin
the pores, thesefilms
of water candiffuse
through the media andtravel towards the
ice
crystals asthey
areforming.
These
crystals proceed toform ice
lenses,
which are
typically
parallel to the surface of the media.These
lenses
create a substantialexpansion
force,
orheave,
onthe media, andthatis
wherethemajordamage
is incurred.
2.2
-Water
and
freezing
behavior
in PEM fuel
cellsHe
andMench
[10]
discuss how frost heave
canbe found
directly
in fuel
cells.There
areseveralarticlesthat
discuss
theend effects ofthermalcycling in
an operationalfuel
cell, andthereare othersthat
discuss how
waterfreezes
andbehaves in
porousmedia, thisarticlecombines theseprinciplesto
demonstrate
how
and wherewaterfreezes in
aPEM
fuel
cell.The
phenomenonthat
is
exploredis frost
heave,
andit
can occurin
porous media even whenit is
saturatedwitha
fluid
thatcontractsuponfreezing.
,
-Ice Lens -,v_
Figure 2.5
-Frost
heave
in
porous material[10]
The
model presentedby
He
andMench
is
aone-dimensional model.The diffusion
mediaandtemperature,
capillary
forces,
andfreezing
temperature.Due
to thefact
thatGDLs
aretypically
constructed
from
carbonpaper,Toray
carbon paperis
usedfor
theexamination offreezing.
Perhaps
the mostimportant
contributionto theunderstanding
ofthisphenomenonis
theirproposal
for
thelocation
oftheice lens formation.
,Diffusion Media
Catalystlayer
' '
/ / / /
////,
Hf^^///A
V
RowChannel
A A A A ^ A
/
/
/ A Row////A
Channel////A
1 a^^^^t .^-^-^. 1
Bectrolyte
Figure 2.6
-Location
of
ice lens formation
[10]
He
andMench
proposethat theice lenses
aremostlikely
toform
wherethecatalystlayer
meetsthemembrane
(3),
wherethe catalystlayer
meetsthediffusion
media(2),
andwherethediffusion
media meetsthechannel(1),
ascanbe
seenin Figure 2.6. He
andMench's
modelsimulation
is
stillin
progress.Lee
andMerida
[11]
have
also presentedresearchvery
pertinentto thecurrent work.They
areusing
ex-situtesting
methodstodetermine
thedamage
mechanismsin
aGDL
samplefrom
severalsources,freezing being
one ofthem.They
prepared aGDM
samplesimilarto thatemployed
in
aworking fuel
cell.A Teflon coating
was added,as wasamicro-porouslayer. The
GDM
samples were placedin
atestfixture
andcompressed,andthe samples'strain responsesas
a
function
of cycle number wererecorded.permeability,
surfacecontactangle, porosity, and water vapordiffusion.
The
electricalresistivity
measurements werecalculatedthroughthe
4-point measuring
method.The
surface contact anglewas measured
by
using
thesessile-drop
method andmeasuring
the contact angleofa1 5mL
droplet.
The porosity
was measuredusing
amercury porosity-measuring
device.
Air
diffusion
was calculated as a
function
ofthe airflowthrough theGDL
as afunction
of pressure.The
Darcy
coefficients werecalculated.Finally,
water vapordiffusion
was measuredusing
a customdual-chamber
device. The
twochambers wereevacuated ofany
moisture,and moist air wasintroduced into
one chamber.The
moisture content oftheair ontheother chamberas afunction
oftimegives a measureofthewater vapor
diffusion
through theGDL.
Lee
andMerida
experiencedsomeinteresting
results.The
in-plane
electrical resistivity,bending
stiffness,plate-sidecontactangle,catalyst-side contactangle, porosity,and water vapordiffusion
all exhibitednochangebefore
and afterthefreeze
cycling.The only
aspectsthatexhibited
any
change werethein-plane
andthrough-planeair permeability.The
author attributesthesechangesto a
loss
ofthemicro-porouslayer (MPL). This layer
is
important
tothecurrentcollection
function
oftheGDL.
While
thisresearchis
similarto thatcontainedherein,
thereare somethingsthatshouldbe done differently.
First,
theGLD
samples werefreestanding
whenthey
werefrozen. This
does
notaccurately
representthe conditionsin
afuel
cell.Second,
themethodofmeasuring
resistivity
that theauthor usedonly
measuresin-plane
resistivity.The
combinedin-plane
andthrough-plane
resistivity
areboth
important,
andassuch, shouldbe
measured.Benziger, Nehlsen,
et.al[18]
investigate how
thewater producedin
the catalystlayer
flows
andbehaves
in
relationto theGDL.
They
first
describe how
theGDL behaves in
regardsandthiswater willremain
in
thepores andhinder
gastransport.However,
if
theGDL
is
hydrophobic,
water willbe
preventedfrom entering
themedium unless a requisite pressureis
reached
in
ordertoconvectively force
waterthrough themedium.A
GDL-appropriate Carbon
paper sheet
is
naturally
hydrophobic,
andasTeflon
is
addedto theGDL,
thehydrophobicity
willincrease.
Additionally,
GDLs have
acounter-currentability,in
thatair and water currentsflow
in
oppositedirections
simultaneously.To
determine
thevoidfraction
in
the medium, theauthorsused
Kerosene,
whichfreely
wicksinto
thesamples.As far
asthehydro
staticpressureis
concerned, theauthorsnoticeda
very
interesting
phenomenon.The
waterpressurehead
wasincreased,
but
noflow
throughthemedium was noticed until5200 Pa. Above
that point,waterwould
flow. Once
waterwasflowing
through theGDL,
thepressure wasdecreased
tomeasurethepressure/flow correlation.
Even
whenthepressurehead
wasbelow 5200
Pa,
water wouldstill
flow. Another
relevantobservationthe authors madeis
that thepressurehead
requiredtoforce
waterthroughtheGDL
samplesdecreased from
thevirgin samplesto theusedsamples.The
authors also statethatthecarbon clothhas
poresaslarge
as250
microns,whereasthecarbonpaper
has
pores ofonly 50
microns.Those
pores,however,
areirregular
anddo
not offer adirect
paththrough themedium.
As
mentionedin
several porous mediapapers, thewater willtake apercolation paththroughthe
GDL,
but
here,
theauthorsstatethat thewater willtravel throughthe
largest
pores only,astheTeflon
keeps
thesmallerporesfrom
taking
on water.In
orderfor
thewatertotravelthroughthe
GDL,
apressureis
requiredasaforementioned.This
pressureis
derived
eitherfrom
thevolumetric constraints atthewater generationsites(catalyst
layer)
orthrough
being
absorbedinto
thePEM,
causing it
toswell.Their
workin
regardstomeasuring
In summary, up
to60
percentofthevolumein
aGDL
canbe filled
withwater,but
only
afraction
ofthatspaceis
usedfor
watertransport.The
GDLs
needirregular
poredistributions
soastoallow
larger
poresfor
watertransportaway
form
thecatalyst and smaller onesfor
gastransport to thecatalyst sites.
Nishida
et.al[19]
investigate
watergeneration andfreezing
behavior
in
an operational5-cm2
fuel
cell.They
aimtopromote waterremovalfrom
thecathodeGDL
because
thecondensedwater
in
theGDL
willinhibit
gasflows
to thereaction sites.To study
water generationanddistribution,
they
ranthe cell at an environmentalchambertemperatureof
30
C
andsubsequently decreased
the temperature to10
C.
Upon making
thischange, thesize and numberofthe
droplets
increased.
This
suggeststhatastemperatureis
decreased,
theamountofwater condensedin
theGDL is increased.
Similarly,
thesize ofthedroplets
producedfrom
theGDL
surfacewillincrease in
thedownstream direction. This is
attributedtothe
fact
that thehumidity
ofthegasesincreases
in
thisdirection,
as well asthefact
thattheamountofcondensedwater
is increased.
They
alsostudied watertransport throughtheGDL.
They
determined
that thewaterdroplets
areformed
at ornearthe catalystlayer
and aretransported to the
GDL
surfaceby
capillary
motion.Another
phenomenonthatNishida
et.alwantedtostudy
wastheremovalofwaterfrom
the
GDL
volume.An
improvement
they
madetoacurrentGDL
wastoputvery
small andshallow grooves
in
theGDL
surface.They
determined
thatwiththisimprovement,
theliquid
waterthat
is
producedquickly
migrates to thegrooves and willbe
removed much moreeasily.In
testing,
a cell withoutthegroovesin
theGDL
wassetto aprescribed currentdensity
andproducedcould not
be
removed,andtheflooding
inhibited
reactant gasesfrom
reaching
thecatalyst surface.
Nishida
et.al alsolooked
atfreezing
phenomena.However, they
observedhow
waterfroze from
coldstart-up
asopposedtopost-shut-downfreezing
of afuel
cell.They
notedthatwaterproduced
in
a cold cellwouldnotfreeze
immediately
due
to theheat from
the chemicalreactionthat
is
occurring.2.3
-PEM
Freezing
Performance
end-effectsWhile it is important
to understand themechanisms ofdegradation in
porous structures,the end effect must also
be
examined.In
thefollowing
investigations,
experiments are runin
order to
determine
(a)
the effects ofthefreeze/thaw cycling
onthefuel
cell system as a whole,and
(b)
theeffectsthatadhering
toa water-purgeprotocol canhave
onthelife
ofafuel
cell.Yan
et.al[6]
studied the cold startbehavior
ofPEMFCs
and the effects oflow
environmentaltemperatures ontheperformanceof an
operating fuel
cell.Custom
catalystink is
formulated
and applied to carbon papertomake the electrodes.The MEAs
are thenassembledusing Nafion
andhot-pressing
the electrodes on each side.To
benchmark
the performancecharacteristics, polarization curves weretaken
immediately
before,
during,
and after operationatthe
desired
sub-zero temperatures.The
polarization curves are then compared tolook for
irreversible
damage
causedby
thecycling.Tests
are conductedtodetermine
thePEM fuel
cell'sstarting
characteristicsfrom
-5, -10,and -15
C.
The
cell wasfirst
runateither roomtemperature or80
C.
After allowing
thefuel
(cathode), (b)
they
were purgedwithdry
nitrogen(anode)
and air(cathode),
or(c)
they
werenotpurged.
For
restartattempts,dry
gases at roomtemperaturewerefed
to thecells.Successful
starts wereperformedfrom
-5C
giventhat thecells were purged.However,
purging did
notnecessarily
guarantee that the cells wouldsuccessfully
startfrom
temperatures
lower
than -5C
because
the water producedduring
the chemical reaction wouldfreeze
andhinder
thegasflow.
Additionally,
whenthefeed
gaseswerepre-heated,thecellstartedup
muchmore easily.
However,
it
couldnotstartatlow stoichiometry
ortemperature.To
gauge performance of thefuel
cell atdifferent
temperatures,
the environmentalchamber was used to change the ambient temperature around the
fuel
cell.The
temperatureswere varied
from
-15C
to80
C
atdifferent
intervals.
As
the chamber temperature waschanged
from
-15 to25
C,
performanceincreases
were noticed.However,
performancedegradation
occurredduring
chambertemperaturechangesfrom 25
to80
C.
Yan
et.al attributethis to the
fact
that the membraneloses
protonconductivity
above25
C.
The
best fuel
cellperformance,
therefore,
wasrealizedat roomtemperature.Water
can existin
threeforms in
theGDL
and on the membrane(free
water,bound
water, and
bound-non-freezing
water).The
term "bound"is
used to refer to the presence ofchemical
interactions
with protons presentin
themembrane.The
bound
non-freezing
water, asthe name suggests, will not
freeze.
The bound
waterfreezes
typically
attemperaturesbetween
260 K
and213 K.
The
free
waterfreezes
at about273
K,
or0C.
The
freezing
water causesseveral sources of
decay
whenthecellis
exposedto thelow
temperatures.First,
ice
canform in
thecell and
hinder
orblock
the transportofgases acrosstheGDLs.
Second,
de-lamination
oftheCho
et.al(2003)
[7]
conducted similarfreeze/thaw
research on an operationalfuel
cell.They
utilized avery
thorough test procedure to examineprecisely
the sources ofdegradation
when a
PEMFC is
thermal cycled.Catalyst
ink
was created and applied to theelectrodes,
andthe
MEA
was assembledin
avery
similar manner toYan
et.al[6].
Cho
attributes thedegradation
ofPEMs
to the volume change causedby
water's liquid-solid-liquid
phase anddensity
changesin
water whenit
is
freeze
cycled.During
thetesting,
theenvironmental chamberand
fuel
cellwerebrought
to thecell's80C operating
temperature.After
thecell operationwasceased, thechamberand
fuel
cellsystem werebrought
to-10C, sustained atthat temperaturefor
one
hour,
andbrought back up
to80C.
During
thetesting,
thecurrentand voltagebehavior
ofthe cell was monitored.
Other
parameters examined were the currentdensity
at0.6
volts, poresize
distribution,
electrochemical active surface area, and protonconductivity
of the polymerelectrolyte.
Despite
thermalfreeze/thaw
cycling, theOCV
ofthefuel
cell, as wellas theprotonconductivity
ofthe polymer membrane, werefairly
constant and seemedindependent
of thenumber ofthermal cycles that the systemunderwent.
The
currentdensity, however,
decreased
about
9.3%
afteronly four
cycles.The
pore size wassimilarly
altered, as thecycling increased
the average pore size
by
over66%. The
electrochemical active surface area and catalyst siteutilization were also reduced.
The decreases in
performance of the cell,therefore,
canbe
attributedtoan
increase in both
theohmicoverpotential andchargetransferresistance.Cho
et.alclaim that since membrane's proton conductivity remains unchanged, the contact resistance
is
the culprit
for
theincrease in
ohmicresistance.Cho
et.al[8]
then published a similarly titled articlein
whichthey
discussed
the80
C
cycletesting
wasusedasthecontroldata. Two
separatetest groups werethen run, andin
eachgroup, a
different fuel
cellwater-purging
method wasimplemented.
During
thefirst
experimentalrun conductedby
Cho
et.al,dry
gases wererunthrough thecell until therelative
humidity
ofthe expelled gases reached a preset value.In
thesetests,
theOCV (open
circuit voltage, zeroload condition)
stayedfairly
constant, and the currentdensity
declined
very slightly (about 0.06%
percycle).This
gas purge method provedtobe
an effectivemethodtoreduce
degradation
ofthe cell.However,
thedisadvantage
ofusing
gasestopurgethecell
is
thatit
took aroundtwenty
minutes to reach thedesired
relativehumidity
value oftheoutlet gas streams.
During
the second experimentaltest,
antifreeze solutions were used as a purge method.The
antifreeze was run through the cell via the gasfeed lines for
afew
seconds.Since
theantifreeze can cause the membrane electrode
assembly
to swell, methanol and ethylene glycolsolutions were chosen
in
order to minimize the swelling.Thermal cycling using
this purge method yielded negativedegradation
rates, whichimply
that the performanceis slightly
increased
through antifreeze solution purging.Moreover,
both
of the experimentalwater-purging
methods provedtobe
effective,but
antifreezepurging
mightbe
themore viable optiontoprevent significant
degradation in
portablePEMFC
applications.In
order tofurther
examine the type anddegree
of physicaldamage
to the membraneelectrolyte assemblies through thermal cycling,
Guo
andQi
[9]
performed threedifferent
treatmentcases
for
theMEAs.
In
all such cases, theMEAs
are thermal cycledfrom 20C
to-30C.
The
author used30
minutesfor
thetransientheating
andcooling
stages and sixhours
ofThe
first
treatment case consisted ofexamining
freestanding
MEAs. The
assemblies thatwere
only
exposedto therelativehumidity
in
the ambient air sustainedsignificantly less damage
than the
MEAs
thatwerefully
hydrated. The
treatment ofthelatter
group
ofMEAs
consisted ofsoaking in
water at80C for
ten minutes,wiping
to remove superficial water, and thenintroduction
to the thermal cycling.These
freestanding,
hydrated
MEAs
exhibiteddelaminated
and
detached
catalystmaterial,which couldlead
toincreased
contact overpotential.In
both
additionaltreatment groups, theMEAs
were assembledin
a single-cell.The
cellwasoperated, andthe reactant streams werecut abruptly.
After undergoing
thermal cycling, theMEAs
weretested.However,
priorto thefreezing,
onetreatmentgroup
underwentadry
reactantgas
purging
procedurefollowed
by
adry
nitrogen purgefor
fifteen-minutes
and one-minute,respectively.
The MEA
thatdid
notundergo adehydration
step
sustained significantdamage
in
the
form
offractured
catalyst material.The MEA
that wasdehydrated,
on the otherhand,
exhibited no apparent
damage. This illustrates
thatif
wateris
removedbefore
thecellis
allowedto
freeze,
less
damage
will occur.While
damage
was sustainedby
theMEA
in
the operationalfuel
cell,both
ofthese testcases appearedtobe
in
abetter
statethanthefreestanding
MEA. This
is
attributed to theclamping assembly force in
the operationalGDL
and theincreased hydration
levels
in
thefreestanding
samples.Despite sustaining
cracks anddamage
to theMEAs,
the operationalfuel
cell exhibited nomajor short-term performance
degradation. The
authorconjectures,however,
that thelifespan
ofthe cell will still
be negatively
impacted
by
thedamage. Guo
andQi,
therefore,
similarly
concludethat
decreasing
oreliminating
thewater contentin
theMEA
priortoallowing
aSeveral
researchersatBallard Power
Systems
(St-Pierre, Roberts,
et.al,(2005) [13])
presenttheirrecent workwith
PEM
andDM
(direct
methanol) fuel
cells andhow dry-gas
purging
canbe
applied.This
allowsthewatertobe drawn
away
by
convection andto evaporateinto
thedry
gases.This
willhelp
preventice formation in
thecellwhenit
is frozen.
For
thetesting,
thefuel
cellwas allowedtocooltoroomtemperaturebefore
purging
tookplace, and after
freezing,
it
was allowedto thawpriorto theintroduction
of reactant-gas andcoolant streams.
The
authorsmake animportant
point asfar
asthetiming
ofthepurge.When
purge gases were
fed
throughthe cell, thechannels woulddry
outfirst,
followed
by
thediffusion
media, and
subsequently
themembrane.Therefore,
if
purge gaseswerefed for
toolong
of aduration,
themembrane woulddry
out andnegatively
affect performanceuponstartup.Since
membrane
conductivity
woulddecline,
thecurrent provided atstartup
wouldbe
limited
andtherefore therateof
heating
thefuel
cellwouldbe
sub-optimal.However,
the authors still saw3
-Objectives
3.1
-Research
needs
in studying GDL
freeze
effectsFrom
theliterature survey
presentedin
thepreviouschapter, several observations canbe
made.
First,
thefreezing
does
have
a significant negativeimpact
onthedurability
andperformanceofa
fuel
celloperating in
sub-zero environmental conditions.Second,
thefree
standing
porous materialslike GDLs
will sustain moredamage
than those testedunder acompressedstate.
Additionally,
purging
with adry
gas or antifreezeis
effective,but purging
timesandmethodsneedto
be carefully
evaluatedtoavoidexcessively
drying
themembrane.Finally,
theprecisemechanismoffreeze
damage
in
theGDL
is
notknown
in
theGDL
matrix.3.2
-Objectives
of
the
present workIn
ordertobetter
understandthesefreezing
damage
mechanismsin
thePEMFC
GDL,
theobjectivesofthepresent workaretocreate ananalytical model andanex-situtest
fixture
of aPEM
fuel
cellGDL in
orderto:Develop
aphysical modeltoidentify
theforces
causedby freezing
waterin
theGDL's
capillary
poresExperimentally
determine
thefreeze damage in
termsofo
GDL's
electricalresistancein
acombinedthrough- andin-plane
direction
o
GDL's
through-planeresistanceto airflow
o
Surface hydrophobic
properties oftheGDL
Develop
anunderstanding
oftheGDL
damage
mechanismsby
studying
theresultsfrom
thenumericalandexperimentalstudies
These
objectiveswillultimately
aidin
determining
thedegradation
ofaworking fuel
celldue
to thelosses
thatarerepresented.First,
the gaspermeability
measurement should give anidea
ofhow
masstransportlosses
willcorrespondto thermalcycling.If
thestructure oftheGDL
is
changedthroughanincreased in
theporesizes, gaspermeability
shouldincrease,
and masstransportmightthereforeoccur more
readily
and reducethefuel
cellinefficiency.
Another
areaof concern
in fuel
cellsis
theohmicoverpotential.The
electricalconductivity
oftheGDL is
very
important
to theefficient operationfuel
cell.This
willbe
measured as afunction
ofthermalcycling.
The
resultsfrom
thistesting
shouldbe
able togiveinsight
asto theeffects ofthermalcycling
onthe ohmiclosses
andmasstransportlosses.
3.3
-Approach
These
objectiveswillbe
accomplishedthroughthefollowing
engineering
techniques(in
theirrespective
order)
An ANSYS
model willbe
createdtodetermine
thestresseswhen awater-saturatedGDL
is frozen
A
testfixture
willbe
devised
thatallowsfor
in-plane,
through-plane,
and combinedthrough- and
in-plane
electricalresistancemeasurementsThe
pressure-flow rate characteristicsoftheGDL in
thethrough-planedirection
willbe
A high-speed
camera willbe
usedtorecorddroplet departure
events sothediameters
andcontactangles can
be
measuredA
microscopewillbe
usedto takehighly-detailed
picturesoftheGDL
both before
andafterthe
cycling
An
additionalexplanationoftheelectricalmeasurementsis in
orderfor
clarity.In
thefuel
cell, asaforementioned, theelectricalcurrentmust
be
ableto travelfrom
thecatalyst sites,through the
MPL
andGDL,
andultimately
to thebipolar
plateswith aslittle
resistance aspossible.
However,
thepathtakenby
theelectricalcurrentis
notnecessarily
astrictly
through-plane one.
The
greenarrowsin Figure 3.1
representtheapproximatepathway
of airdiffusion
from
thegas channels.The
electrochemical activesurfacearea, whileexisting
underthelands
ofthe
GDL,
willalso exist underthechannelsthemselves.Since
thebipolar
plates serve as currentcollectors, theelectrical current willneedto travelonpathways, such as shown
in
thenextfigure. The
red arrowsin Figure 3.2
representthepathsthat theelectrical currentmay
needtotake to travel
from
the electrochemical active surfacesto thelands
ofthebipolar
plates.It
cantherefore
be
observedthatboth
thethrough-planeandin-plane
electrical resistances are ofBipolar Plate
Gas
channelLand Region
GDL
Catalyst
LayerMembrane
/A\
'notdrawn toscale
Figure
3.1-PEM
reactantgaspath* Bipolar
riate
Gas
channel~~
Land Region
\^f/J
*oUL
^__ Catalyst Layer
* iviemDrane
*not drawn toscale
Figure 3.2
-PEM
4
-Analytical
Modeling
There
are severalpapersthatdetail
analytical modelsoffreezing
in
poresin
soil orconcrete
[14
-17],
but
nonedetail
how
thiswouldapply
to a carbon paper-type structure.The
finite-element
modeling
softwareANSYS
willbe
employedto addressthis.4.1
-Model
The
modelwill consist of aportion of aGDL
cross-section.The
entiresectionwillbe
190
pmthick,
whichis
theapproximate thicknessof aGDL.
The
sectionwaschosentobe 210
pm wide
for
modeling.In
addition, threepores were added.Literature
on gasdiffusion layer
structurestatesthatpores can
be
ontheorder of10-30mm
in diameter. As
such, thewidths of allthepores
in
themodel are chosentobe 30
pmdiameter,
whichis
onthehigh-end
oftherangebut is
still areasonable size.^a
Modeled Region
Bipolar Plate
section
GDLsection
Cathode Catalyst
section
Figure
4. 1
-Location
ofGDL
modeled regionlayer.
It is
nottheentirewidth ofthe gaschannel,but
ratherjust
a small portionthatwillbe
modeled.
Figure 4.2
-Model
areasFigure
4.2
showsthe areasin
thecross-sectional model.Area A2
(purple)
is
theGDL
material.
Areas
Al, A4,
andA3 (light
blue,
darker
blue,
andred,respectively)
aretheporesin
the sample.
Pore
Al
is
fully
enclosedby
theGDL. Pore A4 is
modeled atthebottom
oftheGDL
cross section, andis
assumedtobe bounded
by
theGDL
onthree sides andthecatalystlayer
onthebottom. Pore A4 is located
toward theupper surface oftheGDL
andis
exposedtothegas channel.
Pore A4
is
bounded
by
theGDL
onthethree remaining sides,but
is free
toexpand upwards
into
the channel region.Pores Al
andA4
are modeledas30
x30
pm squarepores,whereas
A3 is
modeled as130
pmdeep. The
top
oftheGDL
is
takentobe
the surfaceinside
thegasflow
channel, andthelower
regioncontaining
poreA4
is
the surface againsttheIn
this simulation, thepores are modeled asbeing
filled
with water.The
GDL's
top
andbottom
surfaces willthenbe
exposedto atemperatureof249 Kelvin
(about
-11F
and-24C).The
water'sthermalexpansioncoefficientwillbe
usedtomodelthewater's volume changeuponfreezing.
This
expansionwill put a stress onthepores modeledin
theGDL
structure.The
model
does
nottakeinto
accountthepossibility
ofsub-cooledliquid
waterbeing
presentin
thepores.
The
simulationwillbe
acoupledthermal-structuralmodel.To
performthis,
thesystemmust
be
modeled as athermalelement, savedin
athermal environment, andthenconvertedtoastructural element and saved
in
astructuralenvironment.The
thermalproblem willbe
solved,and aftertheresults are
found,
thestructural model willbe
solvedusing
the temperaturedistribution found in
thethermalanalysis.These
analysestogetherwill give astressdistribution
in
theGDL
as a resultoffreezing.
The
freezing
willbe
modeled asstarting
atthetop
andbottom boundaries
oftheGDL
(gas
channeland catalystlayer,
respectively).It
is
assumedthat theupperporeis filled
withwater,which willnot exit
into
the air channel.This
assumptionis based
onthefact
thatwaterwillremain
in
certainporesin
theGDL
structure andis held
in
with surface tensionforces. The
freezing
front
willtravelfrom
theupperandlower boundaries
towards thecenter oftheGDL.
Again,
thisensuresthat theliquid
wateris
not evacuatedinto
the channelin
themodel.The
desired
output ofthismodelis
thedistribution
oftheVon Mises
stressesin
theGDL. This
willallow a conjectureto
be
made astowhetherGDL damage is
expecteddue
tothepresence ofwater
during
afreezing
event.This
output willbe
comparedtoand verified againstthe4.2
-Material Properties
As
therearetwoseparateanalysesthatmustbe incorporated into
thismode,
both
thermaland structural properties ofthesematerials must
be
in
putinto ANSYS. For
theThermal
analysis,
only
threepropertiesareneeded: thethermalconductivity
[20],
the specificheat
[21],
andthe
density
[20].
However,
theGDL
is
acarbon papermaterial,and assuch, thefiber
orientation
in
theGDL
is
notunidirectionalorevenin
aprescribeddirection. As
microscopicimages
have
shown, theGDL fibers
arein every
direction,
notonly in
thex-y
(in-plane)
direction,
but
alsoin
thez-direction(through-plane). Due
tothis,
theGDL
mustbe
modeled asan
isotropic
material withbulk
propertiestakenfrom
themanufacturer's website.The
manufacturer'swebsite
does
notlist
aspecificheat,
soMatweb
was usedtolocate
asimilarmaterial withthisvalue
listed.
The GDL
carbon materialis
simulated ashaving
isotropic
properties asfollows:
aspecific
heat
of710
J/kg.K,
athermalconductivity
of21
W/m.K,
and adensity
of440
kg/m3.
The
thermalconductivity
andthedensity
are givenonthemanufacturer's website(Toray)
[20],
andthe specific
heat
wastakenfrom Matweb
asaspecificheat
of a comparablecarbon cloth(Thornel Carbon Fiber VCB-20 Carbon
Cloth)
[21]. This
material was chosendue
to thecarboncomposition ofthe cloth,which
is
assumedtobe
similarto thegraphite/carboncomposition ofthe
GDL.
The
thermalproperties of water must alsobe
tabulatedin
ANSYS. The
relevantproperties arethermal
conductivity
and enthalpy.The
temperature-dependent properties of waterare shown
in
Table
4. 1. The
nomenclatureKxx
andENTH
areANSYS'
notation
for isotropic
In
additiontothe thermal properties, the structural properties ofboth
materials mustbe
input.
There
is
nodata
onthemodulus ofelasticity
(Young's
Modulus)
givenby
Toray,
but it
does
list
abending
modulus.To
determine
an appropriate valuefor Young's modulus,
data
obtained
in
theIntroduction
toComposites
course was referenced.A T300
fiber
and5208
matrix composite material
has
an axialmodulus of132 GPa
and atransversemodulusof10.8
GPa. Since
thismaterial'stransversemodulusis in
thevicinity
ofToray'
s
10 GPa
flexural
modulus,
Toray'
s
figure
willbe
usedfor Young's
modulus.The Posson's
ratiowillbe
takenfrom
theT3 00/5208
compositematerialdata.
Conductivity (Kxx)
for Water at243.1 5 Kat273.1 5 K
at305 K
at330 K
at353.15 K
EnthalDV
(ENTH)
for Water0.5690 W/m.K W/m.K W/m.K W/m.K W/m.K 0.5691 0.6200 0.6500 0.6699
at243.1 5 K
at273.1 5 K
at305 K
at330 K
at353.15 K
0
J/kg
J/kg
J/kg
J/kq
0.1 1.34E+05 2.38E+05 3.35E+05GDL
Ex 1.00E+10 Pa
Prxy
0.24 ~Water
Ex
1.00E+10
PaPrxy
0.24 ~Temp
Temp
Strain,
CTEK C E
243.15 -30 0.0276
253.15 -20 0.0281
263.15
-10 0.0287273.15 0 0.0294
277.128 3.978 0
283.15 10 9.00E-05
293.15 20 0.000587
303.15 30 0.00144
Table 4.2
-Structural Properties
ofGDL
and waterTable 4.2
shows alltheinput
structuraldata
for
theGDL
andthewater.The
thermalstrain
data for
thewaterwas calculated asfollows; first,
thevolumefor
1kg
of waterwascalculated
from
thewater'sdensity,
p.m[kg]
V[m3]
=Plkg/m*]
Assuming
thatthisvolumeis
acube, eachedgelength
ofthe cubeis
calculated.l-MV
From
thisedgelength, /,
thelinear
strain, e,is
calculated.61
E=
In
Equation 4. 1
Equation 4.2
Equation 4.3
In
theEquation
4.3,
l0
is
the"original"edgelength
atthereferencetemperature.This
temperature
is
takenas277.128 K (3.978
C)
because
thewater'sdensity
is
greatest andthethe
instantaneous
coefficientsofthermalexpansion requiredfor
the stress analysis.It
is
alsoimportant
tonotethatModulus
ofElasticity
andPoisson'sRatio
values are notedfor
thewater.These
values areirrelevant in
the scope ofcalculating
stressesin
theGDL. These
give stressdistributions in
theice,
whichis
oflittle importance.
Due
tothis,
thesame valuesfor
thecomposite
GDL
were usedfor
thewater.Before any further
testing
couldbe
conducted, themodelhad
tobe
meshed.Figure
4.3
shows
how
themeshhas been
constructed.The
entire sample wasmeshedusing
aANSYS'
meshtooland aglobal meshsizeof
4. The
meshwasthenrefinedateachinternal
boundary
ofthepores.
The
refinement wasperformedusing
ANSYS'
"refine
mesh"feature in
themeshtool.4.3
-Results
The
thermalanalysis mustbe
conducted priortoperforming
thestructural analysis.Initially,
thethermalanalysis was conducted as atransientanalysis.The
GDL
and water systemwasgiven some
initial
temperatureof294 Kelvin. The
upper andlower
edges were exposedtoafreezing
temperature(249
Kelvin). The
transientanalysis showedthat,
giventhehigh
thermalconductivity
ofthematerial andthesize ofthemodel(190mm
x210
mm), temperature gradientsin
themodeled sectionwouldbe
small andthe temperaturewouldreachsteady
statevery
rapidly.Due
tothis,
it
wasdeemed
thatperforming
atransientanalysiswasfairly
unnecessary,asthe
GDL
reachesits steady
statetemperaturedistribution
so quickly.The
thermalanalysiswouldbe
conductedby
applying
afreezing
temperature atthetop
andbottom
surfaces.Figure
4.4
showsthenodes at each ofthemeshedpoints,aswellasthenodesatthe
top
andbottom
wherethe
freezing
temperaturewas applied.After
the steady-stateproblem wassolved,auniformdistribution
of244 Kelvin
was achieved.This
data


![Figure 7.6In each of these plots, one- Simple In-Plane [B & D] common trend exists: the overall resistance of the system is](https://thumb-us.123doks.com/thumbv2/123dok_us/117556.11386/85.532.30.507.68.368/figure-plots-simple-plane-common-exists-overall-resistance.webp)