RESEARCH
A 117-year retrospective analysis
of Pennsylvania tick community dynamics
Damie Pak
1, Steven B. Jacobs
2and Joyce M. Sakamoto
3*Abstract
Background: Tick-borne diseases have been increasing at the local, national, and global levels. Researchers studying ticks and tick-borne diseases need a thorough knowledge of the pathogens, vectors, and epidemiology of disease spread. Both active and passive surveillance approaches are typically used to estimate tick population size and risk of tick encounter. Our data consists of a composite of active and long-term passive surveillance, which has provided insight into spatial variability and temporal dynamics of ectoparasite communities and identified rarer tick species. We present a retrospective analysis on compiled data of ticks from Pennsylvania over the last 117 years.
Methods: We compiled data from ticks collected during tick surveillance research, and from citizen-based submis-sions. The majority of the specimens were submitted by citizens. However, a subset of the data was collected through active methods (flagging or dragging, or removal of ticks from wildlife). We analyzed all data from 1900–2017 for tick community composition, host associations, and spatio-temporal dynamics.
Results: In total there were 4491 submission lots consisting of 7132 tick specimens. Twenty-four different species were identified, with the large proportion of submissions represented by five tick species. We observed a shift in tick community composition in which the dominant species of tick (Ixodes cookei) was overtaken in abundance by Derma-centor variabilis in the early 1990s and then replaced in abundance by I. scapularis. We analyzed host data and identi-fied overlaps in host range amongst tick species.
Conclusions: We highlight the importance of long-term passive tick surveillance in investigating the ecology of both common and rare tick species. Information on the geographical distribution, host-association, and seasonality of the tick community can help researchers and health-officials to identify high-risk areas.
Keywords: Ticks, Passive surveillance, Museum collections, Community composition
© The Author(s) 2019. This article is distributed under the terms of the Creative Commons Attribution 4.0 International License (http://creat iveco mmons .org/licen ses/by/4.0/), which permits unrestricted use, distribution, and reproduction in any medium, provided you give appropriate credit to the original author(s) and the source, provide a link to the Creative Commons license, and indicate if changes were made. The Creative Commons Public Domain Dedication waiver (http://creat iveco mmons .org/ publi cdoma in/zero/1.0/) applies to the data made available in this article, unless otherwise stated.
Background
The Centers for Disease Control and Prevention reported a 3.5× increase in vector-borne diseases in the USA between 2004–2016, with 76.5% of cases caused by tick-borne pathogens [1]. The increase in tick-borne disease is attributed to climate change, land use changes, and expanding geographical ranges for several important endemic tick species, posing novel risks to local commu-nities [2, 3]. Although there are many tick-borne patho-gens, the vast majority of tick-borne disease cases are caused by Borrelia burgdorferi [1, 4], the main etiological
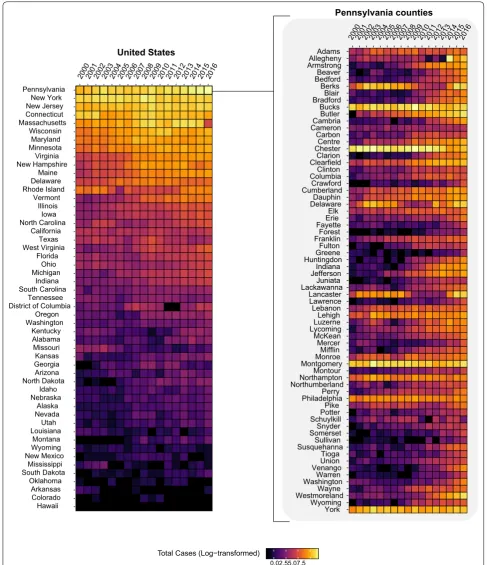
agent of Lyme disease in the USA. Pennsylvania has had the highest number of total Lyme disease cases since 2000, with increasing numbers of annual cases across several counties (Fig. 1).
Surveillance data collected over multiple decades may reveal spatio-temporal changes in ectoparasite commu-nities [5]. Data such as spatial distribution and occur-rence of both abundant and rare species of ticks can be correlated with land use (e.g. habitat loss, fragmentation, management), fluctuating environmental conditions, or changes in human or animal behavior (e.g. encroachment may bring reservoir hosts in closer proximity) [3, 6]. Long-term surveillance data can also reveal shifts in the temporal dynamics of tick populations and communities [2]. Although the seasonality of known tick species has
Open Access
*Correspondence: [email protected]
0.02.55.07.5
T ransformed)
200 0
20012002200 3
200 4
200520062007200820092010201 1
201220132014201 5
2016
Hawaii Colorado Arkansas Oklahoma South DakotaMississippi
New MexicoWyoming Montana LouisianaUtah NevadaAlaska NebraskaIdaho North DakotaArizona
GeorgiaKansas Missouri Alabama Kentucky WashingtonOregon District of ColumbiaTennessee
South CarolinaIndiana MichiganOhio
Florida West VirginiaTexas
California North CarolinaIowa
Illinois Vermont Rhode IslandDelaware
Maine New HampshireVirginia
MinnesotaMaryland Wisconsin MassachusettsConnecticut
New JerseyNew York Pennsylvania
United States
200020012002200320042005200 6
20072008200920102011201 2 2013201420152016
York Wyoming Westmoreland Wayne Washington Warren Venango Union Tioga SusquehannaSullivan
SomersetSnyder SchuylkillPotter Pike PhiladelphiaPerry Northumberland Northampton
Montour Montgomery Monroe
Mifflin Mercer McKean Lycoming Luzerne Lehigh Lebanon Lawrence Lancaster Lackawanna Juniata
Jefferson Indiana HuntingdonGreene Fulton Franklin Forest
Fayette Erie Elk Delaware Dauphin Cumberland Crawford ColumbiaClinton ClearfieldClarion ChesterCentre Carbon CameronCambria
Butler Bucks Bradford Blair
Berks Bedford Beaver Armstrong Allegheny Adams
Pennsylvania counties
[image:2.595.54.542.87.653.2]been described, year-to-year distribution of tick species may be influenced by inter-annual variability (e.g. local climate) and biotic factors (e.g. local reservoir species abundance). These data can be useful for developing pre-dictive models that accurately measure the risks of tick-borne zoonotic agents.
We present a retrospective analysis of tick collection data in Pennsylvania from the early 1900s to June of 2017. Some of the data prior to 1968 had been published in a progress report on ticks from Pennsylvania but were pre-sented in a format that included anecdotes and overall percentages rather than raw number breakdowns by spe-cies [7]. We revisit these specimens and utilize the raw data from both these time periods (1900–1967 and 1968– June 2017) to identify shifts in tick community compo-sition, phenological patterns, and host associations. We used our database to map the distribution of major tick species at the county level, investigate tick community spatiotemporal dynamics, and explore host associations by tick species.
Methods
Study locations
The state of Pennsylvania (PA) is located in the North-east/Mid-Atlantic region of the USA (State Center: 40.9699889, −77.7278831 [8]. Climate in Pennsylvania is variable by location, but broadly classified as a continen-tal type with warm, humid summers (mean temperature ranges of 17.7–23.33°C, [9]. The majority of Pennsylva-nia’s land-use is dedicated to agriculture (both croplands and pastures), forestland, with some dense urban areas [9, 10]. There have been significant changes in the human populations of PA from 1960 to 2010, but a large propor-tion of the PA populapropor-tion has remained heavily clustered around Philadelphia and Pittsburgh, which are located in south-eastern and in south-western PA respectively (Additional file 1: Figure S1).
Submissions
The PSU Frost Entomological Museum (‘Frost Museum’) houses arthropod samples collected by researchers, teaching collections, and samples submitted by the pub-lic for identification. We present our analysis of the tick specimens from 1900 to June 2017, although some Frost Museum collections date as far back as the late 1800s. Because tick samples were submitted to the Depart-ment of Entomology or the Frost Museum over a period of 117 years, they represent multiple collection/submis-sion periods (early 1900–1959; 1960–1969; 1970–1988; Tick Research Lab (TRL) submissions from 1990 to 1993 and 1995–present). Two public campaigns account for the majority of the citizen-submitted specimens. The first campaign (between 1963–1967) was conducted by
Dr Robert Snetsinger. He enlisted the help of the public through advertisements in radio, television, and newspa-pers to obtain 700 specimens [7]. Additionally, he utilized active surveillance methods to collect approximately 500 ticks using a combination of dragging, sweeping, live animal trapping, and roadkill examinations of mammals and birds to assess tick abundance in localized areas [7]. A second funded campaign dedicated to estimating tick abundance and species diversity was launched by Steven B. Jacobs (second author) from 1990 to 1993 (TRL), in which he cataloged, identified, and labeled each speci-men. Specimens were accompanied by additional data: date of tick discovery, location and vegetation type of tick encounter, and host species.
Data from both campaigns and subsequent submis-sions were combined into a single dataset for our analy-ses. For analysis on the distribution of tick species over time, we used total tick counts. For quantifying host asso-ciation, however, we used “submission” number which we defined as a vial or lot containing one or more ticks. We chose to use this more conservative measure rather than total specimen count to avoid skews in abundance by hosts. For example, a submission lot of 1 tick versus 50 ticks from a host were both classified as “one submission”.
While most specimens were collected within state boundaries, a few were declared from people either vis-iting or returning from visvis-iting other states. Tick speci-mens identified as species that are not commonly found in Pennsylvania were later discovered to have been imported from other states/countries or found on exotic animals. Non-PA data were excluded from state-wide analyses, but were included in Additional file 2: Tables S1 and Additional file 3: Table S2).
Identification
Spatial distribution
We focused on the geographical distribution of the five most abundant species of significant public health and veterinary importance: Amblyomma americanum (Lin-naeus), Dermacentor variabilis (Say), Ixodes cookei
(Packard), Ixodes scapularis (Say), and Rhipicephalus sanguineus (Latreille). Working on the assumption that counties with higher populations would submit more specimens than less populated counties, we estimated the prevalence rate (the total numbers of individual ticks per 100,000 people). This was done by adjusting the total tick count of each species by the countyʼs total popula-tion. We looked at relevant time periods during the surveillance programme: 1960–1969; 1990–1999; 2000– 2009; and 2010–2018. For each time period, we used the United States Census data for 1960, 1990, 2000 and 2010, respectively, to calculate the tick prevalence rate (Addi-tional file 1: Figure S1) [18–20]
Temporal analysis
We used the annual sum of all individual tick specimens to investigate how annual submission rates changed over time. We then analyzed the temporal dynamics of the five most abundant taxa (A. americanum, D. variabilis, I. cookei, I. scapularis and R. sanguineus). We did not eval-uate total counts by year as these varied drastically due to the active campaigning for citizen submissions or the introduction of identification fees. Therefore, we looked at the proportional contribution of each species to the annual summed counts of all the five major species. To detect if there have been any monotonic trends (i.e. grad-ual shifts in abundance), we ran a non-parametric, two-sided Mann-Kendall trend test on the yearly proportion of each of the species between 1900–2017.
We investigated the seasonal distribution of the tick community by analyzing the monthly frequency of sub-missions. Citizen submissions were to include the date of discovery, but for specimens that lacked these, we used the date that a given submission was received. We analyzed the seasonal distribution of motile life stages (larvae, nymphs and adults) for the five most abundant taxa. The proportions were calculated by comparing the monthly abundance of each life stage (larvae, nymphs and adults) to the cumulative sum of all stages.
Host associations
Host information (combined by family, except for dog, cat, human and groundhog) was available for many of the tick submissions. Host data were classified as either domestic or wildlife. We analyzed the host-tick data by summing the total submissions by both the tick species and the host group. We constructed a circular network map to visualize the relationships between tick species
and hosts. All host association analyses were done with R (Version 3.4.13) with the packages Kendall for the Mann-Kendall test and the circlize package for chord diagrams of host association mapping [21, 22].
Results
[image:4.595.305.539.344.725.2]A total of 4491 submission lots consisting of 7132 tick specimens across 23 species were identified (Table 1). Five species of ticks accounted for the majority (91%) of the total number of tick specimens: Dermacentor vari-abilis (n = 3172); Ixodes scapularis (n = 1899); Ixodes cookei (n = 897); Rhipicephalus sanguineus (n = 332); and Amblyomma americanum (n = 196). Other tick spe-cies that had at least 100 specimens were Dermacentor albipictus (Packard) (n = 107), Ixodes dentatus (Marx)
Table 1 The total submissions to the PSU Department of
Entomology/Frost Entomological Museum from 1900 to 2017. Generic names that have been changed since the submission date are shown in parentheses
Species No. of
submission lots
No of specimens
Amblyomma americanum 183 196
Amblyomma cajennense 1 1
Amblyomma dissimile 8 8
Amblyomma longirostre 1 1
Amblyomma maculatum 5 5
Amblyomma (Aponomma) transversale 2 2
Amblyomma sp. 2 2
Argas cooleyi 2 2
Argas persicus 3 3
Carios (Ornithodoros) kelleyi 18 18
Dermacentor albipictus 81 107
Dermacentor andersoni 1 1
Dermacentor variabilis 1498 3172
Haemaphysalis chordeilis 1 1
Haemaphysalis leporispalustris 38 78
Ixodes affinis 1 1
Ixodes angustus 39 39
Ixodes cookei 661 897
Ixodes dentatus 115 120
Ixodes marxi 46 48
Ixodes muris 6 6
Ixodes scapularis 1395 1899
Ixodes texanus 16 111
Ixodes sp. 79 80
Rhipicephalus sanguineus 287 332
Rhipicephalus sp. 1 1
Not identified 1 1
(n = 120), and Ixodes texanus (Banks) (n = 111). The remaining ticks had less than 100 specimens/species and included both hard and soft tick species.
Spatial analysis
Ticks were submitted from all 67 counties in Pennsylva-nia (Additional file 4: Figure S2). We hypothesized that more tick submissions would come from areas with higher human populations. As expected, tick submis-sions were heavily clustered around Allegheny and Phila-delphia Counties, where Pittsburgh and PhilaPhila-delphia are located, respectively. When we adjusted the total tick count by county population-decade, we found higher prevalence rates in less populated counties. For example, in 1990–2000, the highest prevalence rates of I. scapula-ris submissions were from Elk County (870 individuals per 100,000 population). Neighboring Forest and Cam-eron counties also had high submissions of I. scapularis
with 116.64 and 589.97 individuals per 100,000 respec-tively (Fig. 2).
Dermacentor variabilis distribution was largely local-ized to the southern parts of the state. From 1990 to 2000, the highest proportion of D. variabilis submis-sions came from Greene County, the most southeastern county of Pennsylvania (865.45 submissions per 100,000). Other southern counties with high tick loads per capita included Fulton County (350.60 per 100,000) and Frank-lin County (117.26 per 100,000). Ixodes cookei was more evenly distributed throughout Pennsylvania, although like I. scapularis, it was more highly abundant in the northern counties. In 1990–2000, Forest County had the highest prevalence rates of Ixodes cookei with 80.87 per 100,000. R. sanguineus and A. americanum had very few submissions and their distribution was mostly scattered across Pennsylvania (Fig. 2).
For the tick species with less than 150 submissions across 1900 to 2017, we aggregated the submissions by
A.amer
icanum
I.coo
ke
i
R.sanguineus
I.scapular
is
D.
va
riabili
s
Prevalence per 100,000 [0,1] (1,10] (10,40] (40,100] (100,200] (200,500] (500,1000]
1960-1970 1990-2000 2000-2010 2010-2020 Cumulative
0 2 4 6
Total individuals (log) Prevalence rates
[image:5.595.57.541.343.685.2]genus. Multiple species within the genera Ixodes and
Dermacentor were widely distributed across Pennsylva-nia (I. scapularis, I. cookei, D. andersoni and D. albipic-tus) (Additional file 4: Figure S2). Other species in the genera Amblyomma, Argas, Carios (Ornithodoros) and
Haemaphysalis were not as widely distributed, possibly because these species are not commonly encountered or because the specimens were introduced from their native geographical ranges (Additional file 4: Figure S2, Addi-tional file 5: Figure S3).
Temporal shifts in species abundance
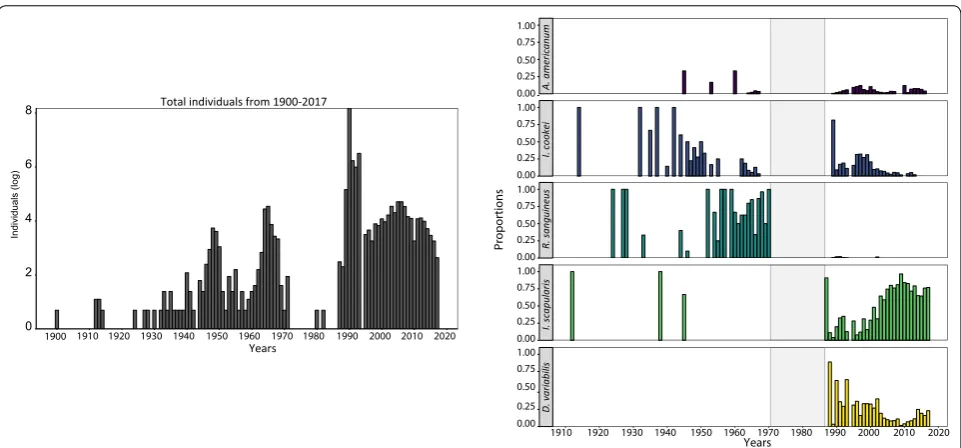
Prior to the 1990s, the majority of the tick submissions were identified as I. cookei and R. sanguineus (Fig. 3). The spike in the number of submissions in 1990 was largely due to D. variabilis, but gradually, I. scapularis
became the dominant taxon submitted. Results from the Mann-Kendall test supports these observations with an upward trend in the I. scapularis counts (tau = 0.288,
P = 0.02) and a significant downward trend in D. vari-abilis (tau = −0.408, P = 0.002). The Mann-Kendall also indicate that the proportional contributions of
I. cookei (tau = −0.607, P < 0.001) and R. sanguineus
(tau = −0.377, P = 0.005) to the total count have also sig-nificantly shifted over a century.
Seasonality
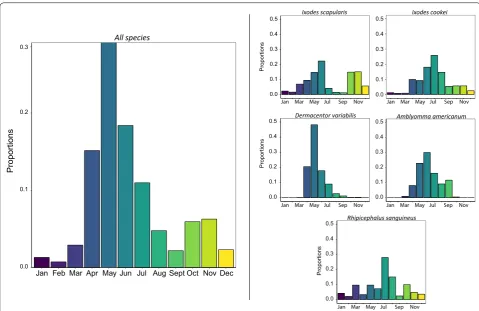
Overall, we find that the majority of tick specimens were received in the months between April and July
with the highest proportion of tick submissions in May (Fig. 4). Submissions of D. variabilis, A. americanum,
I. cookei and R. sanguineus were most abundant during the period between May and July. Dermacentor
vari-abilis and A. americanum were most abundant from
March to October. Ixodes cookei and R. sanguineus
samples were submitted throughout the year, with peak abundance in June. Samples of I. scapularis were also submitted year-round, but the peak abundances were bimodally distributed with a large peak between May-June and a second peak between October-November.
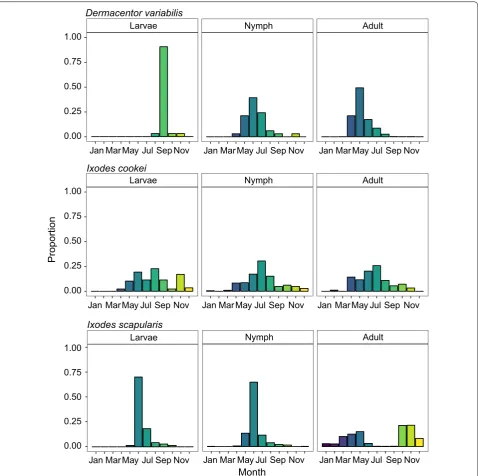
We compared seasonal distribution by lifestage for 6233 of the 7132 total of tick specimens (Fig. 5). Four percent of total submissions were larvae (n = 237), 20% were nymphs (n = 1271), and 75% of the submis-sions were adults (n = 4725). Of the D. variabilis sub-missions, there was a total of 32 larvae, 33 nymphs and 3059 adults from 1960 to 2017 (Fig. 5), with a unimodal distribution peaking around June.
Prior to 1990 I. scapularis were very rare so we have only shown their lifestage-specific seasonal abundance since 1990. Overall, the nymphal and larval submis-sions showed a unimodal pattern with the highest pro-portion of submissions received in June. For the adult submissions, there were prominent bimodal peaks in May and October with similar proportions of submis-sions received in both seasons.
The majority of I. cookei submissions were nymphs (n = 521), followed by adults (n = 182) and larvae (n = 88).
R.sanguineus
0.00 0.25 0.50 0.75 1.00
0.00 0.25 0.50 0.75 1.00
0.00 0.25 0.50 0.75 1.00
0.00 0.25 0.50 0.75 1.00
0.00 0.25 0.50 0.75 1.00
1910 1920 1930 1940 1950 1960 1970 1980 1990 2000 2010 2020
Years
Proportions
A. americanum
I. cookei
R. sanguineus
I. scapularis
D. variabilis
0 2 4 6 8
Individuals (log)
1910 1920 1930 1940 1950 1960 1970 1980 1990 2000 2010 2020 1900
Years Total individuals from 1900-2017
[image:6.595.58.539.463.687.2]The submission patterns indicate that I. cookei specimens can be encountered year-round, but that nymphs were the most commonly encountered lifestage. Across all life-stages, we see that the distributions are unimodal with peaks in early summer between May and June.
There were too few lifestage submissions for A. ameri-canum and R. sanguineus to make sufficient comparisons with the seasonality of these species.
Host association
One of the assumptions about passive surveillance is that there is an inherent bias toward humans as the hosts, par-ticularly since most specimens submitted by the humans from themselves, their pets, or other domestic animals. By far the majority of submissions were associated with humans and their domestic animals and this reflects the fact that many of the specimens in our collection were submitted by people on themselves or their pets (Fig. 6). Of 4491 submissions from PA, there were 2662 attached to humans, 666 associated with cats or dogs, 20 from other domestic animals, and 168 submissions pooled from multiple hosts (mixed). There were 11 additional submissions found on various exotic animals. There were
689 submissions for which there was no host record or the ticks were not attached to a host. The remaining 275 were found on various wildlife.
Discussion
Our data is unique in that it contains details about tick community composition and spatio-temporal dynamics from Pennsylvania over a 117-year period. Subsets of our data had been reported as percentages or combined with data from other museums and literature reviews to esti-mate the distribution of one or more tick species across the state of Pennsylvania [7, 23]. To our knowledge, this is the first time that these data have been compiled in their entirety and analyzed in this format. We were able to detect seasonality, shifts in tick community composi-tion, and host associations that have not been well-docu-mented in a quantitative manner. The seasonality data for the five most abundant tick species inferred by our pas-sive surveillance data is consistent with previous records of seasonality described by other researchers [24–27], demonstrating that these types of passive data contain biologically meaningful signal.
0.0 0.1 0.2 0.3 0.4 0.5
Proportions
0.0 0.1 0.2 0.3 0.4 0.5
0.0 0.1 0.2 0.3 0.4 0.5
Proportions
0.0 0.1 0.2 0.3 0.4 0.5
0.0 0.1 0.2 0.3 0.4 0.5
Ixodes scapularis Ixodes cookei
Dermacentor variabilis Amblyomma americanum
Rhipicephalus sanguineus
Proportions
0.0 0.1 0.2
Jan Mar May Jul Sep Nov Jan Mar May Jul Sep Nov
Jan Mar May Jul Sep Nov Jan Mar May Jul Sep Nov
Jan Mar May Jul Sep Nov
Jan Feb Mar Apr May Jun Jul Aug Sept Oct Nov Dec
All species 0.3
Proportions
[image:7.595.57.537.86.397.2]Shifts in tick community composition
In the 1960s, PA tick communities consisted predomi-nantly of three species: I. cookei, D. variabilis, and R. sanguineus (Fig. 2). The most abundant species at that time, I. cookei, often referred to as a groundhog tick, is actually a broad- host tick feeding principally on medium mammals, although humans and dogs will also be para-sitized [28]. The second most abundant species, D. vari-abilis, was widely distributed and eventually became the
dominant species submitted over I. cookei in the 1990s. By 1991 D. variabilis had been identified from all but 4 counties (Fig. 2) [23]. After 1995, D. variabilis annual submission rates declined as I. scapularis submission rates increased (Fig. 2). Because there were gaps in sub-mission numbers for certain years, we cannot say for certain why there were shifts in the abundance of these species.
Adult
0.00 0.25 0.50 0.75 1.00
Dermacentor variabilis
Adult Nymph
0.00 0.25 0.50 0.75 1.00
Ixodes cookei
Adult
0.00 0.25 0.50 0.75 1.00
Month
Proportio
n
Ixodes scapularis
Larvae
v o N p e S l u J y a M r a M n a J v
o N p e S l u J y a M r a M n a J
Nymph Larvae
Jan MarMay Jul Sep Nov
Jan MarMay Jul Sep Nov Jan MarMay Jul Sep Nov
Nymph Larvae
Jan MarMay Jul Sep Nov
Jan Mar May Jul Sep Nov
Jan MarMay Jul Sep Nov Jan Mar May Jul Sep Nov
[image:8.595.60.539.87.563.2]CatCosws
Dogs
Horses
Human s
Other
Rhipicepha lus sanguineu
s
Ixodes sc apularis Ixodes marxi Ixodes dentatus Ixodes cookei Dermac
entor variabilis
Am blyomma
ame
ricanu
m
Domestic
Bats BearsBirds Cervi
ds
Mustelid s
Wild Cani ds
Opossums
Leporids
Raccoons
Rodent s
Shre ws Skunk
s Groundhog
s
Othe r
Rhipicephalus sa nguineus Ixodes scapularis Ixodes marxi Ixodes dentatus
Ixodes cookei
De rmacentor
va riabilis
Wildlife
Bats BearsBirdsCervids Mustelids
Wild Canids
Opossums
Leporids Raccoons
Rodent s
Shrews Skunks
Groundhog s
Cats Cows
Dogs
Horses
Humans
Reptil
es Other
Rhipicep halus sang
uineus Ixodes scapularis Ixodes marxi Ixodes dentatus
Ixodes cookei Dermacentor variabilis
Amblyomma americanu
m
[image:9.595.57.540.84.682.2]Although we cannot directly infer a causal negative relationship between D. variabilis and I. cookei with I. scapularis, this pattern was also observed in neighboring Ohio. The passive surveillance programme run by Ohio Department of Health (started in 1978) did not detect
I. scapularis (=formerly I. dammini) until 1989 [29]. At that time, the dominant species were D. variabilis (~97% of submissions) and I. cookei (1.2%) [24]. Between 1989 until 2008, I. scapularis accounted for less than 1% of the total submissions, but after 2009, the abundance began to increase. By 2012 they accounted for 24.8% of ticks sub-mitted to the Ohio Department of Health [30].
Ixodes cookei abundance was highest prior to 1990 but has since become very rare in our dataset. Yet, we know that the abundance of I. cookei in the Maine passive sur-veillance programme has been constant, even as I. scapu-laris submissions have increased [5]. It is possible that I. cookei abundance in PA has also remained relatively sta-ble, but that we lack sufficient power to detect I. cookei. This inconsistency in submission rates may be due to the shift from free to per-submission charges for tick identifi-cations that occurred in the mid-late 1990s.
The fourth and fifth most abundant tick species in our database were R. sanguineus, the brown dog tick (287 submission lots consisting of 332 specimens) and
A. americanum (183 submission lots consisting of 196
specimens) (Table 1). Although R. sanguineus originated in Africa, it is a cosmopolitan urban pest species found worldwide in association with humans and their canine companions [31]. Snetsinger [7] suggested in 1968 that
R. sanguineus had established breeding populations in
Pennsylvania, but the abundance tapered off after 1968 and none exist in our database since 2002. In contrast, the submission rates of A. americanum increased and then leveled off from 1960 to 2000. Although not com-monly encountered, we have specimens from as recent as 2016.
Host associations
Vector-host associations (including host specificity) are important for predicting the risk of pathogen transmis-sion and identifying key players in a sylvatic disease cycle. The specificity to host varies with the tick species. In our dataset generalist tick species (e.g. D. variabilis, I. scapu-laris, I. cookei) were found parasitizing a wide range of vertebrate hosts, while specialist species (e.g. I. dentatus,
I. marxi, I. muris) were associated with a single host or limited to host size (e.g. small mammals or birds). This was consistent with other data in the literature.
Less commonly encountered tick species can some-times lead to incorrect assumptions about host prefer-ences and subsequent risk of pathogen transmission. While some tick species may be presumed to hold
strict host preferences, they may bite humans if given the opportunity. For instance, I. dentatus bit humans in cabins that had been inhabited by their squirrel hosts in Maine and Vermont, and I. cookei was found on humans in West Virginia [32, 33]. Ixodes texanus was only found from raccoons in our dataset, but this species is known to feed on several mammalian hosts [24, 34, 35]. Commonly held misconceptions about host associa-tions of certain tick species (e.g. I. cookei as “groundhog ticks”) based on lack of encounter may result in ignoring a potentially epidemiologically important vector (e.g. I. cookei is a vector of Powassan encephalitis virus and may potentially be another vector of Ehrlichia muris [36]).
Multi‑faceted approach to tick surveillance
Surveillance can be a powerful tool for the detection of introduced species (transient or established), emergent arthropod-borne pathogens, and disease risks due to increases or changes in vector community composition. Both passive and active surveillance strategies have their strengths and weaknesses but combined, they provide a more complete picture of tick community dynamics. Active tick surveillance approaches such as dragging, flagging, CO2-trapping, or live animal capture, can be
very effective for assessing tick load by habitat [7, 24, 34, 37]. It can, however, be labor-intensive, costly, and diffi-cult to implement over a wide geographical area. Passive surveillance is more cost-effective and less labor-inten-sive and can provide insight into ectoparasite abundance, host associations, or habitat associations across a wider geographical area [38]. Passive surveillance (particularly based on submissions by citizens) may run the risk of under-representing certain taxa or reflect a bias toward certain host associations. However, citizen-submitted tick collections can provide valuable baseline data on prevalence and likelihood of tick encounters and may be more strongly correlated with reported human cases of tick-borne diseases than active surveillance alone [39– 42]. A community engagement programme that actively recruits ticks submitted by citizens should be coupled with support for a rigorously curated database of tick submissions.
population structure that can be used for modeling dis-ease risk. Archival tick samples (or their DNA) can be useful for retrospective mining for research on the popu-lation genetics of ticks to detect gene flow, host shifts, or on their microbial inhabitants.
Implicit in any tick surveillance strategy is having trained tick biologists who can readily distinguish spe-cies by morphological and molecular characteristics. In the last 20 years, I. scapularis has become the most abun-dant tick species in Pennsylvania. While distinguishing
Ixodes from other genera of ticks is fairly simple, species-level identification requires more detailed morphologi-cal examination, since there are six endemic species of
Ixodes and three exotic species that could potentially be misidentified as I. scapularis. More generally, although many tick species are incompetent vectors of B. burgdor-feri, they may be vectors and/or reservoirs of other path-ogens/parasites, or acquire pathogens during co-feeding [24, 43–46]. It is therefore important to correctly identify tick species, not only for the determination of disease risk but also because the treatments for the pathogens they transmit may differ significantly.
Conclusions
An ideal tick surveillance programme would not only utilize multiple approaches and have a dedicated tick biologist proficient at species identification on staff, but it would also take a proactive stance that is not limited strictly to immediate threats. Since 1993 (~25 years) there have been 28 publications on ticks from Pennsyl-vania, and 22 of them were focused on I. scapularis and/ or the microbiota (mostly on pathogens) [23, 25, 46–71]. While I. scapularis is an important vector that warrants this attention, other tick species are being ignored. The consequences of neglecting other potential ticks of epi-demiological significance include missing shifts in tick biodiversity, not identifying the potential causes of said shifts, not monitoring changes in range expansions of vectors, and not detecting the presence of introduced or established species. Recently, the presence of H. longi-cornis was reported in Pennsylvania, but we have no data on whether it has been introduced previously, or whether it has established populations. Given the potential risks that this parthenogenic tick poses (wide host range, pos-sible vector of multiple pathogens, may induce meat allergies), this example highlights the potential dangers of focusing on only one vector-pathogen system [70– 73]. Hybrid datasets from tick collections derived from multiple sources represent a powerful tool for mining past ecological and epidemiological events. Many states maintain county records on passive tick submissions to veterinary or medical health officials, but there may be other cryptic collections (and associated data) housed in
museums, universities, government institutions, or with private individuals. Combining these data with other ectoparasite databases and currently unexplored col-lections will provide ectoparasite researchers the robust dataset needed for a massive meta-analysis. These cryptic ectoparasite collections will provide the basis for explor-ing hypotheses such as: (i) are shifts in tick populations correlated with increasing human encroachment on natural habitats; (ii) what are some phenological reasons for the increase in I. scapularis abundance; or (iii) if dis-placement of a dominant tick community species occurs, what are the implications for tick-borne disease risk? We anticipate that participating in such a study will fill in the gaps of knowledge about less-studied tick species as well as highlight the intrinsic value of museum collections of ectoparasites.
Additional files
Additional file 1: Figure S1. Total population of Pennsylvania counties over time. Data were taken from the US Census for 1960, 1990, 2000, and 2010.
Additional file 2: Table S1. Specimens submitted from outside of the state of Pennsylvania.
Additional file 3: Table S2. Exotic specimens from known ranges outside PA, the continental USA, or North America.
Additional file 4: Figure S2. Dot-density map of all individual tick speci-mens across Pennsylvania from 1900 to 2017. Each point represents an individual tick specimen with its placement randomized within the county and each colored dot represents a different tick species.
Additional file 5: Figure S3. Presence or absence map of species with less than 150. Counties with zero submissions are dark, while the light areas represent the presence of one or more specimens for each genus.
Acknowledgments
The authors would like to thank Dr István Mikó for critical manuscript review, citizens and researchers who have contributed ticks to PSU, The Frost Ento-mological Museum for access to the collection, and critical suggestions from reviewers.
Funding
This work was supported by the USDA National Institute of Food and Agri-culture and Hatch Appropriations under Project #PEN04691 and Accession #1018545. Additional support came from NSF GRFP DGE1255832 (to DP), and start-up funds from the Huck Institutes of Life Sciences, and the Penn State College of Agriculture to JMS.
Availability of data and materials
Data supporting the conclusions of this article are provided within the article and its additional files. The datasets supporting the conclusions of this article are available at GitHub in the passive_tick_surveillance_2018repository, https ://githu b.com/pakda mie/passi ve_surve illan ce_tick_2018/tree/maste r/MAIN_ DAT, and at Zenodo (https ://zenod o.org/recor d/14760 91).
Authorsʼ contributions
analyses, and contributed literature review, manuscript writing, and revisions. All authors read and approved the final manuscript.
Ethics approval and consent to participate
Not applicable as these specimens were in a museum collection without any identifying information beyond host, date of collection, and collection location.
Consent for publication
Not applicable.
Competing interests
The authors declare that they have no competing interests.
Publisher’s Note
Springer Nature remains neutral with regard to jurisdictional claims in pub-lished maps and institutional affiliations.
Author details
1 Department of Biology, Pennsylvania State University, W-234A, Millennium Science Complex, University Park, PA 16802, USA. 2 Department of Entomol-ogy, Pennsylvania State University, 501 ASI Building, University Park, PA 16802, USA. 3 Department of Entomology, Pennsylvania State University, W-104 Mil-lennium Science Complex, University Park, PA 16802, USA.
Received: 12 November 2018 Accepted: 20 April 2019
References
1. Rosenberg R, Lindsey NP, Fischer M, Gregory CJ, Hinckley AF, Mead PS, et al. Vital Signs: Trends in reported vectorborne disease cases— United States and Territories, 2004–2016. Morb Mortal Wkly Rep. 2018;67:496–501.
2. Sonenshine DE. Range expansion of tick disease vectors in North America: implications for spread of tick-borne disease. Int J Environ Res Public Health. 2018;15(3):478.
3. Simon JA, Marrotte RR, Desrosiers N, Fiset J, Gaitan J, Gonzalez A, et al. Climate change and habitat fragmentation drive the occurrence of Bor-relia burgdorferi, the agent of Lyme disease, at the northeastern limit of its distribution. Evol Appl. 2014;7:750–64.
4. Eisen RJ, Kugeler KJ, Eisen L, Beard CB, Paddock CD. Tick-borne zoonoses in the United States: persistent and emerging threats to human health. ILAR J. 2017;58:319–35.
5. Rand PW, Lacombe EH, Dearborn R, Cahill B, Elias S, Lubelczyk CB, et al. Passive surveillance in Maine, an area emergent for tick-borne diseases. J Med Entomol. 2007;44:1118–29.
6. Brownstein JS, Skelly DK, Holford TR, Fish D. Forest fragmentation predicts local scale heterogeneity of Lyme disease risk. Oecologia. 2005;146:469–75.
7. Snetsinger RJ. Distribution of ticks and tick-borne diseases in Pennsylva-nia. University Park, PA: Pennsylvania State University; 1968 June p. 1–8 Report No.: 288.
8. Node: Pennsylvania (316987717). OpenStreetMap. https ://www.opens treet map.org/node/31698 7717
9. Pennsylvania State Climatologist. http://clima te.met.psu.edu/data/state / 10. Land Use | NRCS Pennsylvania. https ://www.nrcs.usda.gov/wps/porta l/
nrcs/main/pa/techn ical/landu se/
11. Keirans JE, Litwak TR. Pictorial key to the adults of hard ticks, family Ixodidae (Ixodida: Ixodoidea), east of the Mississippi River. J Med Entomol. 1989;26:435–48.
12. Cooley RA, Kohls GM. The genus Amblyomma (Ixodidae) in the United States. J Parasitol. 1944;30:77.
13. Keirans JE, Clifford CM. The genus Ixodes in the United States: a scan-ning electron microscope study and key to the adults. J Med Entomol. 1978;15:1–38.
14. Yunker CE, Keirans JE, Clifford CM, Easton EA. Dermacentor ticks (Acari: Ixodoidea: Ixodidae) of the New World: a scanning electron microscope atlas. Proc Entomol Soc Wash. 1986;88:609–27.
15. Durden LA, Keirans JE. Nymphs of the genus Ixodes of the United States. Lanham, Maryland, USA: Entomological Society of America; 1996. 16. Keirans JE, Durden LA. Illustrated key to nymphs of the tick genus
Amblyomma (Acari: Ixodidae) found in the United States. J Med Entomol. 1998;35:489–95.
17. Cooley RA, Kohls GM. The Argasidae of North America, Central America and Cuba. Notre Dame, USA: The University Press; 1944. http://www.biodi versi tylib rary.org/bibli ograp hy/4511
18. U.S. Census data from 1960 to 1990. https ://www.censu s.gov/popul ation /cenco unts/pa190 090.txt
19. U.S. Census data: U.S. Census Bureau; Table DP-1, Census 2000, Profile of General Demographic Characteristics Summary File 1, https ://factfi nder .censu s.gov/bkmk/table /1.0/en/DEC/10_DP/DPDP1 /04000 00US4 2 20. US Census data: U.S. Census Bureau; Table DP-1, Census 2010, Profile of
General Demographic Characteristics Summary File 1, https ://factfi nder .censu s.gov/bkmk/table /1.0/en/DEC/00_SF1/DP1/04000 00US4 2 21. McLeod AI. Kendall: Kendall rank correlation and Mann-Kendall trend test.
2011. https ://CRAN.R-proje ct.org/packa ge=Kenda ll
22. Gu Z, Gu L, Eils R, Schlesner M, Brors B. circlize implements and enhances circular visualization in R. Bioinforma Oxf Engl. 2014;30:2811–2. 23. Snetsinger R, Jacobs SB, Kim KC, Tavris D. Extension of the range of
Dermacentor variabilis (Acari: Ixodidae) in Pennsylvania. J Med Entomol. 1993;30:795–8.
24. Kollars TM, Oliver JH. Host associations and seasonal occurrence of Haemaphysalis leporispalustris, Ixodes brunneus, I. cookei, I. dentatus, and I. texanus (Acari: Ixodidae) in southeastern Missouri. J Med Entomol. 2003;40:103–7.
25. Simmons TW, Shea J, Myers-Claypole MA, Kruise R, Hutchinson ML. Sea-sonal activity, density, and collection efficiency of the blacklegged tick (Ixodes scapularis) (Acari: Ixodidae) in mid-western Pennsylvania. J Med Entomol. 2015;52:1260–9.
26. Burg JG. Seasonal activity and spatial distribution of host-seeking adults of the tick Dermacentor variabilis. Med Vet Entomol. 2001;15:413–21. 27. Kollars TM, Oliver JH, Durden LA, Kollars PG. Host associations and
sea-sonal activity of Amblyomma americanum (Acari: Ixodidae) in Missouri. J Parasitol. 2000;86:1156–9.
28. Bishopp FC, Trembley HL. Distribution and hosts of certain North Ameri-can ticks. J Parasitol. 1945;31:1–54.
29. Pretzman C, Daugherty N, Poetter K, Ralph D. The distribution and dynamics of Rickettsia in the tick population of Ohio. Ann N Y Acad Sci. 1990;590:227–36.
30. Wang P, Glowacki MN, Hoet AE, Needham GR, Smith KA, Gary RE, et al. Emergence of Ixodes scapularis and Borrelia burgdorferi, the Lyme disease vector and agent, in Ohio. Front Cell Infect Microbiol. 2014;4:70. 31. Brites-Neto J, Duarte KMR, Martins TF. Tick-borne infections in human and
animal population worldwide. Vet World. 2015;8:301–15.
32. Hall JE, Amrine JW, Gais RD, Kolanko VP, Hagenbuch BE, Gerencser VF, et al. Parasitization of humans in West Virginia by Ixodes cookei (Acari: Ixodidae), a potential vector of Lyme borreliosis. J Med Entomol. 1991;28:186–9.
33. Lubelczyk C, Cahill BK, Hanson T, Turmel J, Lacombe E, Rand PW, et al. Tick (Acari: Ixodidae) infestation at two rural, seasonal camps in Maine and Vermont. J Parasitol. 2010;96:442–3.
34. Brillhart DB, Fox LB, Upton SJ. Ticks (Acari: Ixodidae) collected from small and medium-sized Kansas mammals. J Med Entomol. 1994;31:500–4. 35. Cohen SB, Freye JD, Dunlap BG, Dunn JR, Jones TF, Moncayo AC. Host
associations of Dermacentor, Amblyomma, and Ixodes (Acari: Ixodidae) ticks in Tennessee. J Med Entomol. 2010;47:415–20.
36. Xu G, Pearson P, Rich SM. Ehrlichia muris in Ixodes cookei ticks, northeast-ern United States, 2016–2017. Emerg Infect Dis. 2018;24:1143–4. 37. Bouchard C, Leighton PA, Beauchamp G, Nguon S, Trudel L, Milord F, et al.
Harvested white-tailed deer as sentinel hosts for early establishing Ixodes scapularis populations and risk from vector-borne zoonoses in southeast-ern Canada. J Med Entomol. 2013;50:384–93.
38. Oliver JD, Bennett SW, Beati L, Bartholomay LC. Range expansion and increasing Borrelia burgdorferi infection of the tick Ixodes scapularis (Acari: Ixodidae) in Iowa, 1990–2013. J Med Entomol. 2017;54:1727–34. 39. Ripoche M, Gasmi S, Adam-Poupart A, Koffi JK, Lindsay LR, Ludwig A, et al.
40. Cortinas R, Spomer SM. Occurrence and county-level distribution of ticks (Acari: Ixodoidea) in Nebraska using passive surveillance. J Med Entomol. 2014;51:352–9.
41. Barrett AW, Noden BH, Gruntmeir JM, Holland T, Mitcham JR, Martin JE, et al. County scale distribution of Amblyomma americanum (Ixodida: Ixodidae) in Oklahoma: addressing local deficits in tick maps based on passive reporting. J Med Entomol. 2015;52:269–73.
42. Xu G, Mather TN, Hollingsworth CS, Rich SM. Passive surveillance of Ixodes scapularis (Say), their biting activity, and associated pathogens in Mas-sachusetts. Vector Borne Zoonotic Dis. 2016;16:520–7.
43. Baer-Lehman ML, Light T, Fuller NW, Barry-Landis KD, Kindlin CM, Stewart RL. Evidence for competition between Ixodes scapularis and Dermacentor albipictus feeding concurrently on white-tailed deer. Exp Appl Acarol. 2012;58:301–14.
44. Brown SM, Lehman PM, Kern RA, Henning JD. Detection of Borrelia burg-dorferi and Anaplasma phagocytophilum in the black-legged tick, Ixodes scapularis, within southwestern Pennsylvania. J Vector Ecol J Soc Vector Ecol. 2015;40:180–3.
45. Campagnolo ER, Tewari D, Farone TS, Livengood JL, Mason KL. Evidence of Powassan/deer tick virus in adult black-legged ticks (Ixodes scapu-laris) recovered from hunter-harvested white-tailed deer (Odocoileus virginianus) in Pennsylvania: a public health perspective. Zoonoses Public Health. 2018;65:589–94.
46. Courtney JW, Dryden RL, Montgomery J, Schneider BS, Smith G, Massung RF. Molecular characterization of Anaplasma phagocytophilum and Borre-lia burgdorferi in Ixodes scapularis ticks from Pennsylvania. J Clin Microbiol. 2003;41:1569–73.
47. Anderson JF, Duray PH, Magnarelli LA. Borrelia burgdorferi and Ixodes dammini prevalent in the greater Philadelphia area. J Infect Dis. 1990;161:811–2.
48. Crowder CD, Carolan HE, Rounds MA, Honig V, Mothes B, Haag H, et al. Prevalence of Borrelia miyamotoi in Ixodes ticks in Europe and the United States. Emerg Infect Dis. 2014;20:1678–82.
49. Daniels TJ, Fish D, Levine JF, Greco MA, Eaton AT, Padgett PJ, et al. Canine exposure to Borrelia burgdorferi and prevalence of Ixodes dammini (Acari: Ixodidae) on deer as a measure of Lyme disease risk in the northeastern United States. J Med Entomol. 1993;30:171–8.
50. Devevey G, Brisson D. The effect of spatial heterogeneity on the aggrega-tion of ticks on white-footed mice. Parasitology. 2012;139:915–25. 51. Dick CW, Gannon MR, Little WE, Patrick MJ. Ectoparasite associations of
bats from central Pennsylvania. J Med Entomol. 2003;40:813–9. 52. Edwards MJ, Barbalato LA, Makkapati A, Pham KD, Bugbee LM. Relatively
low prevalence of Babesia microti and Anaplasma phagocytophilum in Ixodes scapularis ticks collected in the Lehigh Valley region of eastern Pennsylvania. Ticks Tick-Borne Dis. 2015;6:812–9.
53. Han GS, Stromdahl EY, Wong D, Weltman AC. Exposure to Borrelia burg-dorferi and other tick-borne pathogens in Gettysburg National Military Park, South-Central Pennsylvania, 2009. Vector Borne Zoonotic Dis. 2014;14:227–33.
54. Hutchinson ML, Strohecker MD, Simmons TW, Kyle AD, Helwig MW. Prevalence rates of Borrelia burgdorferi (Spirochaetales: Spirochaetaceae), Anaplasma phagocytophilum (Rickettsiales: Anaplasmataceae), and Babe-sia microti (Piroplasmida: Babesiidae) in host-seeking Ixodes scapularis (Acari: Ixodidae) from Pennsylvania. J Med Entomol. 2015;52:693–8. 55. Lo Re V, Occi JL, MacGregor RR. Identifying the vector of Lyme disease.
Am Fam Phys. 2004;69:1935–7.
56. Lord RD, Lord VR, Humphreys JG, McLean RG. Distribution of Borrelia burgdorferi in host mice in Pennsylvania. J Clin Microbiol. 1994;32:2501–4.
57. Magnarelli LA, Stafford KC, Mather TN, Yeh MT, Horn KD, Dumler JS. Hemocytic rickettsia-like organisms in ticks: serologic reactivity with anti-sera to ehrlichiae and detection of DNA of agent of human granulocytic ehrlichiosis by PCR. J Clin Microbiol. 1995;33:2710–4.
58. Miller MJ, Esser HJ, Loaiza JR, Herre EA, Aguilar C, Quintero D, et al. Molecular ecological insights into Neotropical bird-tick interactions. PloS One. 2016;11:e0155989.
59. Rogers MB, Cui L, Fitch A, Popov V, Travassos APA, Vasilakis N, et al. Whole genome analysis of Sierra Nevada virus, a novel mononegavirus in the family nyamiviridae. Am J Trop Med Hyg. 2014;91:159–64.
60. Sakamoto JM, Ng TFF, Suzuki Y, Tsujimoto H, Deng X, Delwart E, et al. Bunyaviruses are common in male and female Ixodes scapularis ticks in central Pennsylvania. PeerJ. 2016;4:e2324.
61. Sakamoto JM, Goddard J, Rasgon JL. Population and demographic structure of Ixodes scapularis Say in the eastern United States. PloS One. 2014;9:e101389.
62. Schoelkopf L, Hutchinson CE, Bendele KG, Goff WL, Willette M, Rasmussen JM, et al. New ruminant hosts and wider geographic range identified for Babesia odocoilei (Emerson & Wright 1970). J Wildl Dis. 2005;41:683–90. 63. Serfass TL, Rymon LM, Brooks RP. Ectoparasites from river otters in
Penn-sylvania. J Wildl Dis. 1992;28:138–40.
64. Shock BC, Moncayo A, Cohen S, Mitchell EA, Williamson PC, Lopez G, et al. Diversity of piroplasms detected in blood-fed and questing ticks from several states in the United States. Ticks Tick Borne Dis. 2014;5:373–80. 65. Springer YP, Jarnevich CS, Barnett DT, Monaghan AJ, Eisen RJ. Modeling
the present and future geographic distribution of the lone star tick, Amblyomma americanum (Ixodida: Ixodidae), in the continental United States. Am J Trop Med Hyg. 2015;93:875–90.
66. Steiner FE, Pinger RR, Vann CN, Grindle N, Civitello D, Clay K, et al. Infec-tion and co-infecInfec-tion rates of Anaplasma phagocytophilum variants, Babe-sia spp., Borrelia burgdorferi, and the rickettBabe-sial endosymbiont in Ixodes scapularis (Acari: Ixodidae) from sites in Indiana, Maine, Pennsylvania, and Wisconsin. J Med Entomol. 2008;45:289–97.
67. Stromdahl E, Hamer S, Jenkins S, Sloan L, Williamson P, Foster E, et al. Comparison of phenology and pathogen prevalence, including infection with the Ehrlichia muris-like (EML) agent, of Ixodes scapularis removed from soldiers in the midwestern and the northeastern United States over a 15-year period (1997–2012). Parasit Vectors. 2014;7:553.
68. Waits K, Edwards MJ, Cobb IN, Fontenele RS, Varsani A. Identifica-tion of an anellovirus and genomoviruses in ixodid ticks. Virus Genes. 2018;54:155–9.
69. Yeh MT, Bak JM, Hu R, Nicholson MC, Kelly C, Mather TN. Determining the duration of Ixodes scapularis (Acari: Ixodidae) attachment to tick-bite victims. J Med Entomol. 1995;32:853–8.
70. Chen X, Xu S, Yu Z, Guo L, Yang S, Liu L, et al. Multiple lines of evidence on the genetic relatedness of the parthenogenetic and bisexual Haema-physalis longicornis (Acari: Ixodidae). Infect Genet Evol J Mol Epidemiol Evol Genet Infect Dis. 2014;21:308–14.
71. Chinuki Y, Ishiwata K, Yamaji K, Takahashi H, Morita E. Haemaphysalis longi-cornis tick bites are a possible cause of red meat allergy in Japan. Allergy. 2016;71:421–5.
72. Rainey T, Occi JL, Robbins RG, Egizi A. Discovery of Haemaphysalis longicornis (Ixodida: Ixodidae) parasitizing a sheep in New Jersey, United States. J Med Entomol. 2018;55:757–9.