R E S E A R C H
Open Access
Environmental risk factors and changing
spatial patterns of human seropositivity for
Echinococcus
spp. in Xiji County, Ningxia
Hui Autonomous Region, China
Angela M. Cadavid Restrepo
1*, Yu Rong Yang
2,3, Donald P. McManus
3, Darren J. Gray
1,3, Tamsin S. Barnes
4,5,
Gail M. Williams
6, Ricardo J. Soares Magalhães
4,7and Archie C. A. Clements
1Abstract
Background:Human echinococcoses are parasitic helminth infections that constitute a serious public health concern in several regions across the world. Cystic (CE) and alveolar echinococcosis (AE) in China represent a high proportion of the total global burden of these infections. This study was conducted to predict the spatial distribution of human seropositivity forEchinococcusspecies in Xiji County, Ningxia Hui Autonomous Region (NHAR), with the aim of identifying communities where targeted prevention and control efforts are required.
Methods:Bayesian geostatistical models with environmental and demographic covariates were developed to predict spatial variation in the risk of human seropositivity forEchinococcus granulosus(the cause of CE) andE. multilocularis (the cause of AE). Data were collected from three cross-sectional surveys of school children conducted in Xiji County in 2002–2003, 2006–2007 and 2012–2013. Environmental data were derived from high-resolution satellite images and meteorological data.
Results:The overall seroprevalence ofE. granulosusandE. multiloculariswas 33.4 and 12.2%, respectively, across the three surveys. Seropositivity forE. granulosuswas significantly associated with summer and winter precipitation, landscape fragmentation variables and the extent of areas covered by forest, shrubland, water and bareland/ artificial surfaces. Seropositivity forE. multiloculariswas significantly associated with summer and winter precipitations, landscape fragmentation variables and the extent of shrubland and water bodies. Spatial correlation occurred over greater distances forE. granulosusthan forE. multilocularis.The predictive maps showed that the risk of seropositivity for E. granulosusexpanded across Xiji during the three surveys, while the risk of seropositivity forE. multilocularisbecame more confined in communities located in the south.
Conclusions:The identification of high-risk areas for seropositivity for these parasites, and a better understanding of the role of the environment in determining the transmission dynamics ofEchinococcusspp. may help to guide and monitor improvements in human echinococcosis control strategies by allowing targeted allocation of resources.
Keywords:Human echinococcoses,Echinococcus granulosus,Echinococcus multilocularis, Environment, Geographical information systems, Remote sensing, Xiji County, Ningxia Hui Autonomous Region
* Correspondence:[email protected]
1Research School of Population Health, The Australian National University,
Canberra, Australian Capital Territory 0200, Australia
Full list of author information is available at the end of the article
Background
Cystic echinococcosis (CE), caused mainly by infection withEchinococcus granulosus, and alveolar echinococco-sis (AE), caused by infection with E. multilocularis, are chronic and potentially fatal diseases that have a wide geographical distribution across the world.
According to global estimates, the number of new cases of CE is 188,000 every year, which represents a human health burden of 184,000 disability adjusted life years (DALYs) [1]. There are 18,235 new AE cases annually, which result in approximately 666,433 DALYs lost [2].
China is a country affected heavily by human echinococ-coses [3]. In China, the nationally estimated numbers of CE and AE cases explain 40 and 95% of the total global burden of the infections, respectively [2, 4]. The second survey of parasitic diseases conducted in China in 2001– 2004 found that approximately 380,000 people were af-fected by these two types of echinococcoses, and 50 mil-lion were at risk of infection nationwide [5]. Prevalence of CE and AE was particularly high in seven provinces/au-tonomous regions located in Western China: Qinghai, Gansu, Sichuan, Xinjiang Uighur Autonomous Region (AR), Tibet AR, Ningxia Hui AR and Inner Mongolia AR [6,7]. However, regional and local variation in echinococ-cosis risk is high, with the diseases being particularly prevalent among poor pastoral minority groups [2,8,9].
The National Control Programme to prevent and cure echinococcoses in China was developed by the National Health and Family Planning Commission (formerly the Ministry of Health) in 2005 [6]. To date, applying and sustaining the programme has proven difficult in most endemic regions due to the lack of effective surveillance data, dispersed populations and movement of people and livestock to summer pastures [10]. Screening surveys to detect early cases are primarily conducted in the most-affected regions of China [6, 11]. Therefore, the national prevalence reports may be biased [10,11]. Because human echinococcoses are characterised by long incubation pe-riods that precede clinical diagnoses, current epidemio-logical estimates may be overlooking the relative contribution of asymptomatic or undiagnosed/untreated CE and AE cases [10]. Consequently, better surveillance and response tools are required to estimate and predict the real impact of these two diseases in China, and to strengthen the implementation of prevention and control interventions in targeted high-risk areas [12].
Echinococcus granulosus is primarily maintained in life-cycles that involve domestic animals, whileE. multi-locularisis typically a wildlife parasite [13]. Both species are transmitted in multi-host systems that are determined by factors that govern the presence/absence and infectivity of the parasites and also the population dynamics and in-teractions of the hosts [13]. Thus, special emphasis is cur-rently being placed on identifying the role of environment
factors in influencing the transmission patterns ofE. gran-ulosus and E. multilocularisand explaining the apparent emergence and re-emergence of human infections in sev-eral regions of the world [14–18]. The Chinese govern-ment is implegovern-menting a series of extensive landscape regeneration projects to restore the country’s degraded ecological landscape [19,20]. Studies conducted in various echinococcosis-endemic regions have documented that land cover transformations are related to higher popula-tion densities of key intermediate hosts for E. multilocu-laris, which has increased the risk of human AE infection [21–28]. Hence, research also needs to be conducted to better describe the ecological processes that may lead to variations in the transmission patterns of E. granulosus
and E. multilocularis based on shifting environmental factors [29]. This information will be essential to monitor emergence or re-emergence of the transmission of both parasites [29].
Bayesian model-based geostatistical approaches have been increasingly used in research focused on character-ising the geographical patterns of infectious diseases and quantifying their associations with potential risk factors [1, 30–33]. Model-based geostatistics incorporates a model of the spatial correlation structure of the data with the effect of covariates to predict a variable of interest (e.g. seropositivity for Echinococcus spp.) in unsampled locations, and to quantify the associated uncertainty in the estimated parameter values [34]. These methods provide a valuable and flexible framework that can be used to support the process of decision-making during the imple-mentation of a control programme [34].
Using Bayesian model-based geostatistics, we aimed to explain the spatiotemporal distribution of human sero-positivity for E. granulosus and E. multilocularis in Xiji County, Ningxia Hui Autonomous Region (NHAR), China, based on selected environmental factors. In the study, the term human seropositivity was meant to signify that children harboured possibly the metacestode stage of
E. granulosus and/or E. multilocularis, whether or not they had evidence of active cyst(s) in the abdominal ultra-sound or any manifestation of disease (following the description of a possible echinococcosis case suggested elsewhere [35]. Also, we aimed to produce spatial predic-tion maps to show the evolving geographical distribupredic-tion of seropositivity for these parasites species at three differ-ent time points during the last decade. These maps will be useful to inform decisions on where communities at high risk of echinococcoses are located in China, and to help prioritise and target resources for prevention and control.
Methods Study area
105°20' and 106°4'E. Xiji covers an area of approximately 3985 km2 and shares borders with Haiyuan County to the north, Guyuan County to the east, Longde County to the south, and Huining and Jinning Counties that belong to Gansu Province, to the west. Administratively, Xiji is divided into 3 towns and 16 townships, which are then subdivided into 306 villages. In 2015, the total population was 344,045 inhabitants, of whom 58% were of the Hui Islamic ethnic minority and 42% were Han Chinese [36] (Fig.1).
Xiji lies in a temperate continental monsoon climate zone that is characterized by four distinct seasons. The annual average temperature is 5.37 °C and the average annual precipitation is 418.2 mm. Elevation ranges from 1688 to 2633 m.
Xiji County was selected as the study area because a previous retrospective survey of hospital records con-ducted in NHAR indicated that high prevalences of hu-man echinococcoses, particularly AE, were concentrated mainly in the southern part of the Autonomous Region, where Xiji is located [37].
Data on human seropositivity forE. granulosusandE.
multilocularis
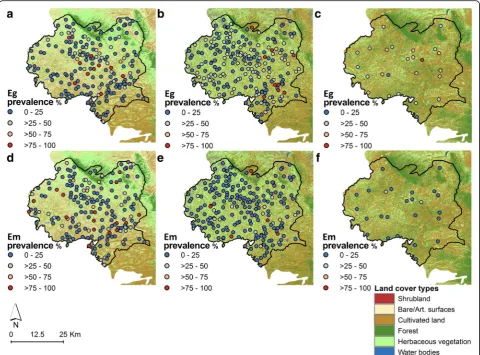
Data were obtained from cross-sectional school-based surveys conducted across Xiji County during three dis-tinct time periods: 2002–2003, 2006–2007 and 2012– 2013. Surveys were carried out at 190, 219 and 25 loca-tions for each time period, respectively, and included all children aged 6–18 years who agreed to participate (Fig. 2). This age-group was selected in order to ensure that the collected data were representative of recent cases of human exposure.
Exposure information and demographic data were collected with standardised questionnaires that were administered to the students by school teachers. Partici-pants were also asked to provide a small blood sample from the ear lobe for specific antibody testing by enzyme linked immunosorbent assay (ELISA) usingE. granulosus
cyst fluid antigen B (EgB) and E. multilocularis crude protoscolex extract (EmP) [38]. Sensitivity of EgB and EmP ELISA is > 85% for CE and > 90% for AE, respect-ively [23, 38, 39]. Specificity ranges from 70 to 100% for CE [40] and 87% for AE [39]. Finally, abdominal ultra-sound was used to screen schoolchildren and detect and classify early CE and/or AE cysts. The World Health Organization classification scheme of CE and AE was used to categorise the hepatic lesions [41–43]. Due to the young age of the study population and the slow rate of growth of the echinococcosis cysts, a very limited of number of ultrasounds showed undefined hepatic changes. Therefore, the results were not included in the statistical models. Participants who were found to be positive forE. granulosus,E. multilocularisor both were
referred to the local health centre for adequate follow-up. Full details of the survey design from 2002 to 2003, data collection and acquisition of ethical approval are reported elsewhere [44]. The survey conducted in 2006– 2007 followed the same protocol. A geostatistical design was used to select the schools for the survey in 2012– 2013 [45]. A 15 × 15 km grid was created in a geograph-ical information system, and overlaid on the county terri-tory, noting that this survey also covered three other counties (data not presented here). The schools lying in closest proximity to the grid nodes were selected. A secondary set of school located in near proximity to a ran-dom subset of those selected at the nodes of the grid (the close pairs) were also selected. This approach has been identified as the most efficient survey design for estimat-ing spatial variability in environmental variables [45].
The geographical coordinates of each school were collected using a hand-held global positioning system. The locations of surveyed schools are shown in Fig. 2. Data collected from the three surveys were combined into a single database.
Environmental and remotely sensed data
The independent variables included in the analysis were derived from the following data sets: monthly mean temperature and precipitation, elevation, enhanced vege-tation index (EVI) and land cover class.
Monthly mean temperature and precipitation data re-cords for the period January 1 1998 to December 31 2013 were provided by the Chinese Academy of Sciences in a raster format at the spatial resolution of 1 km. Data were first collected from 16 local weather stations and interpolated using the Inverse Distance Weighting (IDW) method, but the original weather station data were not available.
Estimates of elevation were obtained from the Advanced Spaceborne Thermal Emission and Reflection Radiometer (ASTER) Global Digital Elevation Model (GDEM) version 2 [46]. The ASTER GDEM is available in the USGS Earth Explorer website in GeoTIFF format at the resolution of 1 arcsecond (approximately 30 m).
Land cover maps for the years 1996, 2000, 2005, 2010 and 2015 were produced using time-series images re-trieved from the Landsat Surface Reflectance Climate Data Record available in Earth Explorer [48]. Six land cover classes were identified: water bodies, artificial surfaces, bare or sparsely vegetated areas, herbaceous vegetation,
cultivated land, shrubland and forest (Table 1). Artificial surfaces and bare or sparsely vegetated areas were merged and represented as a single category in the maps and ana-lyses due to significant spectral confusion between them. Details of the original images and the process of land cover classification are provided elsewhere [49].
[image:4.595.58.541.88.635.2]Fig. 2Distribution of school surveys and observed seropositivity forEchinococcus granulosusandE. multilocularisin 2002–2003 (a,d), 2006–2007 (b,e) and 2012–2013 (c,f) in Xiji County, NHAR, China. A surface of the different land cover types in 2000, 2005 and 2010, respectively, is also presented
Table 1Land cover classification scheme and definitions
Land cover type Description Content
Water bodies All areas of water Streams and canals, lakes, reservoirs, bays and estuaries
Artificial surfaces Land modified by human activities Residential areas, industrial and commercial complexes,
transport infrastructure, communications and utilities, mixed urban or built-up land and other built-up land
Bare or sparsely vegetated areas
Areas with little or no“green”vegetation present Dry salt flats, sandy areas, bared exposed rock and mixed barren land
Herbaceous vegetation Areas characterized by natural or semi-natural vegetation Grasses and forbs
Cultivated land Areas where the natural vegetation has been removed/modified and replaced by other types of vegetative cover that have been planted for specific purposes such as food, feed and gardening
Cropland and pasture, orchards, groves, vineyards, nurseries and ornamental horticultural, other cultivated land
Shrubland Natural or semi-natural woody vegetation with aerial stems less than 6 m tall
Evergreen and deciduous species of true shrubs and trees or shrubs that are small or stunted
Forest Areas characterized by tree cover or semi-natural woody
vegetation greater than 6 m tall
[image:5.595.55.545.556.734.2]An administrative boundary map of Xiji was down-loaded from the DIVA-GIS website [50]. School survey locations were imported into ArcGIS software version 10.3.1 [51] and projected to the Universal Transverse Mercator (UTM) coordinate system zone 48N. Buffer zones of 1 km and 5 km centred on the survey site loca-tions were created using ArcGIS software. All data sets were imported into ArcGIS and linked spatially to the surveyed schools to extract and summarise the environ-mental data by buffer area.
Data analysis
Summary statistics were calculated at each location at the time of the survey and at a 5-year lag. A moving 5-year average (MA) was also generated to smooth the estimates of the independent variables. The incorporation of a MA into the analyses allowed assessment of associations over an extended period of time rather than at a single point in time, accounting for the variable latency period of infec-tion. For each location, the summary statistics computed were: (i) annual, summer (June, July and August) and win-ter (December, January and February) weighted mean series of temperature and precipitation, (ii) spatial mean values of elevation and EVI. The spatial extents (as a per-centage of buffer areas) of each land cover category for the years 1996, 2000, 2005, 2010 and 2015 were extracted and used to calculate change rates by buffer area for the periods 1996–2000, 2000–2005, 2005–2010, and 2010– 2015. In this way, it was possible to estimate the spatial extent of all land cover classes by buffer area for all years between 1998 and 2012.
The land reform policies and incentive programs to recover degraded land in China might have impacted on landscape fragmentation [52], which could impact on habitat availability for Echinococcus spp. intermediate hosts. The five landscape fragmentation metrics that were selected for the analyses were: number of patches (NumP), patch density (PD), mean patch size (MPS), mean shape index (MSI) and edge density (ED) (Table 2). These fragmentation metrics were selected because they provide
information about landscape composition, shape, and con-figuration [53]. These metrics were computed using the Patch Analyst extension of ArcGIS [13].
Variable selection
In order to examine separately the association of E. granulosusand E. multilocularisseropositivities with the environmental factors, univariate logistic regression models were implemented for each parasite exposure using R software version 3.2.2. [54]. Collinearity among all independent variables was assessed using Spearman correlation analyses. If a pair of covariates had a correl-ation coefficient > 0.9, the variable with the highest value of Akaike Information Criterion (AIC) in the univariate regression models was discarded. Multivariate logistic regression models were developed and the models with the lowest values of AIC were used to select the vari-ables for the final, spatial models. Nonlinear associations between covariates and E. granulosus and E. multilocu-laris seropositivities were modelled using quadratic terms, and no interactions were considered.
Bayesian geostatistical models
Model-based geostatistics was implemented in a Bayes-ian framework [55] using the OpenBUGS software 3.2.3 rev 1012 [56].
[image:6.595.57.538.594.730.2]Two distinct models for each of E. granulosus and E. multilocularisserological status, including parameters for the environmental variables were constructed. The first model (Model I) was developed including the selected explanatory variables for each seropositivity, but without considering the spatial dependence structure of the data; the second model (Model II) assumed that spatial auto-correlation is present in the relative risk of seropositivity. Hence, Model II included the explanatory variables as fixed-effects and a spatially structured random effect. Model fit was compared using the deviance information criterion (DIC), where low DIC values indicate a better model fit. In all analyses, statistical significance was
Table 2Description of the landscape fragmentation metrics that were included in the analyses of human seropositivity forE. granulosusandE. multilocularisin Xiji County
Metric Description Units
Composition
Number of patches (NumP)
Total number of patches within a buffer –
Patch density (PD) Total number of patches per buffer area /km2
Mean patch size (MPS) Average patch size within a buffer km
Shape
Mean shape index (MSI) Ratio of perimeter to area adjusted by a constant to account for a particular patch shape –
Configuration
determined with α-levels of 0.05 [as indicated by 95% credible intervals (95% CrI) for odds ratios (OR) that ex-cluded 1].
The complete model, Model II, assumed thatYi (Yi= 1 for seropositive schoolchildren and 0 for seronegative schoolchildren) followed a Bernoulli distribution whereYij
was the serological status of theith child (i= 1…5,110) in thejth location (j= 1…434), andpijwas the probability an individualibeing exposed in locationj, that is,
YijBern pij
logit pij ¼αεþγxageiþδxfemaleiþ
Xz
z¼1
βzxλzjþsj
whereαεis the survey specific intercept, γandδ are the coefficients for age and females respectively, β is a matrix of z coefficients,λis a matrix of z environmental covariates, and sj a geostatistical random effect. The
spatial correlation structure of the geostatistical random effect was defined by an exponential function of the dis-tance between points:
f dð ab;ϕÞ ¼ exp½–ϕdab
where dab are the distances between pairs of points a
and b, and ϕ is the rate of decline of spatial correlation per unit of distance. A normal distribution was specified for the intercept and the coefficients (normal prior with mean = 0 and precision, the inverse of variance, = 1 × 10⁻³). The priors distribution of ϕ was uniform with upper and lower bounds set at 0.09 and 100 (the lower bound set to ensure spatial correlation at the maximum separating distance between survey locations was < 0.5). The priors for the precision (1/σt2) were specified using a
non-informative gamma distribution (with shape and scale parameter values of 0.001 and 0.001, respectively).
A burn-in of 1000 iterations was run and discarded. Subsequent sets of 10,000 iterations were run and exam-ined for convergence. Convergence was determexam-ined by visual inspection of history and density plots. The runs were also examined for autocorrelation by visual inspec-tion of the autocorrelainspec-tion plots. Because autocorrelainspec-tion was observed for all variables, thinning was applied for subsequent sampling by storing every 10th iteration. Convergence was achieved successfully for all variables in each model at approximately 100,000 iterations. The last 10,000 values from the posterior distributions of each model parameters were stored for the analysis. The rate of decay of correlation between locations (ϕ) with distance and the variance of the spatial component (σ2) were also recorded.
Thespatial.unipredfunction in OpenBUGS was used for spatial prediction at non-sample locations (defined using a regular 1 × 1 grid overlying the entire Xiji territory). This
function applies the model equation at each prediction location using the covariates values extracted for prediction locations and an interpolated value for the geostatistical random effects.
ArcGIS was used to generate maps that represent the posterior distributions of predicted seropositivity for E. granulosusandE. multilocularisin Xiji County.
Results
Sample description
The final data set consisted of 434 school locations and a total of 5110 schoolchildren aged 6–18 years who were screened for human echinococcoses. The surveys involved 845 students in 2002–2003, 2588 in 2006–2007 and 1677 in 2012–2013. The overall seroprevalences ofE. granulo-sus and E. multilocularis were 33.4 and 12.2%, respect-ively, ranging from 0 to 100% by school for both parasites. In the first survey, the seroprevalence ofE. multilocularis
[image:7.595.306.539.631.730.2]among schoolchildren was higher (18.1%) than the sero-prevalence ofE. granulosus(16.8%). However, seropositiv-ity forE. granulosusbecame more common in the second and third survey with seroprevalences of 30.9 and 45.6% compared to seroprevalences ofE. multilocularisof 12.8% and 8.4%, respectively (Table 3). An abnormal hepatic image compatible with a CE case (0.02% of the total num-ber of schoolchildren in the study) and a query lesion (0.02%) were observed in two different participants in the first survey. Both cases were seropositive forE. granulosus. Calcified lesions were also observed in 8 (0.1%) partici-pants in the first survey and 14 (0.3%) participartici-pants in the second survey. Among participants with calcifications, 4 (0.01%) were seropositive forE. granulosus and 2 (0.03%) were seropositive for E. multilocularis. Other asymptom-atic liver abnormalities were reported in 4 (0.01%) partici-pants, who were seronegative for both parasite species, in the second survey. The mean age of participants with seropositivity forE. granulosuswas 12.9 years [median: 13; standard deviation (SD): 2.9], and the mean age for those with seropositivity for E. multilocularis was 13.3 years (median: 14; SD: 2.9).
Table 3Human seroprevalence ofEchinococcus granulosusand
E. multilocularisinfection stratified by gender from three school-based surveys conducted in Xiji County in 2002–2003 (survey 1), 2006–2007 (survey 2) and 2012–2013 (survey 3)
E. granulosus E. multilocularis Total
n(%)
Positive
n(%)
Negative
n(%)
Positive
n(%)
Negative
n(%)
Survey 1 142 (16.8) 703 (83.2) 153 (18.1) 692 (81.9) 845 (100)
Survey 2 799 (30.9) 1789 (69.1) 331 (12.8) 2257 (87.2) 2588 (100)
Survey 3 765 (45.6) 912 (54.4) 141 (8.4) 1536 (91.5) 1677 (100)
Figure 2 displays the observed spatial distributions of the seroprevalence ofE. granulosusandE. multilocularis
by schools for the three surveys. The maps confirm that seropositivity forE. granulosusbecame more widespread in Xiji County over time, while the distribution of E. multilocularisseropositivity became more confined.
Bayesian geostatistical models
Based on DIC estimates, the Bayesian spatial models (Models II) of seropositivities for E. granulosus and E. multilocularis were the best-fitting models (Tables 4
and 5). In Model II of E. granulosus, girls had a 15.0% (95% CrI: 1.7–29.8%) higher risk of exposure than boys. Also, within the 1 km buffers, there was a 0.7% increase in the odds of seropositivity (95% CrI: 0.4–0.9%) for an increase of 1 mm in summer mean precipitation at the
time of the survey, and 6.5% increase (95% CrI: 2.0– 10.9%) with 1% increase in water extent at the five-year lag. Forest, shrubland and water coverage in the 5 km buffers were also positively associated with the risk of
E. granulosus. There were estimated increases of 2.2% (95% CrI: 0.5–3.9%), 194.3% (95% CrI: 44.7–523.1%) and 18.8% (95% CrI: 1.4–38.5%) in the odds of seropositiv-ity forE. granulosusfor a 1% increase in the extent of for-est at the time of the survey, and the extent of shrubland and water at five-year lags. There was a decrease of 2.8% (95% CrI: 0.4–4.8%) in the odds of seropositivity for every year of age. The odds of seropositivity for E. granulosus
[image:8.595.65.538.309.716.2]decreased 1.6% (95% CrI: 0.8–2.6%) with a unit increase in NumP, 64.7% (95% CrI: 26.1–82.8%), with 1 km increase in MPS, 6.8% (95% CrI: 4.3–9.3%) with a 1 mm increase in winter mean precipitation and 1.7% (95% CrI: 0.2–
Table 4Regression coefficients, ORs and 95% CrI from the Bayesian spatial model (Model II) for human seropositivity for
Echinococcus granulosusin three school-based surveys conducted in Xiji County in 2002–2003, 2006–2007 and 2012–2013
Model Coefficient, posterior mean (95% CrI) OR, posterior mean (95% CrI)
α1(Intercept study 1) -0.23 (-1.79–1.27) –
α2(Intercept study2) 0.94 (-0.74–2.56) –
α3(Intercept study 3) 0.38 (-1.10–1.76) –
Femalea 0.14 (0.02–0.26) 1.15 (1.01–1.29)
Age -0.03 (-0.05–-0.01) 0.97 (0.95–0.99)
Summer precipitation same year (1 km) 0.01 (0.00–0.01) 1.01 (1.01–1.02)
EVI same year (1 km) -5.12 × 10⁴(-5.10 × 10⁴–4.91 × 10⁴) 0.99 (0.99–1.00)
Cultivated land same year (1 km) 3.24 × 10³(-3.22 × 10³–9.94 × 10³) 1.00 (0.99–1.01)
Water bodies 5 years prior (1 km) 0.06 (0.02–0.10) 1.06 (1.02–1.10)
Forest same year (1 km) 0.01 (-6.95 × 10⁴–0.02) 1.00 (0.99–1.01)
NumP 5-year average (1 km) -0.01 (-0.02–-0.01) 0.98 (0.97–0.99)
PD 5-year average (1 km) 1.08 (-0.23–2.83) 2.95 (0.79–16.89)
MPS 5-year average (1 km) -1.04 (-1.76–-0.30) 0.35 (0.17–0.73)
Winter precipitation same year (5 km) -0.07 (-0.09–-0.04) 0.93 (0.91–0.95)
Bareland/art surfaces same year (5 km) -0.02 (-0.03–-0.01) 0.98 (0.96–0.99)
Forest same year (5 km) 0.02 (0.01–0.03) 1.02 (1.01–1.03)
Water bodies 5 years prior (5 km) 0.17 (0.01–0.32) 1.18 (1.01–1.38)
Herbaceous vegetation 5 years prior (1 km) 0.01 (-0.01–0.02) 1.01 (0.99–1.02)
Shrubland 5 years prior (5 km) 1.08 (0.36–1.82) 2.94 (1.44–6.23)
Cultivated land 5 years prior (5 km) -0.01 (-0.02–0.01) 0.98 (0.97–1.10)
MPS 5 years prior (5 km) -0.14 (-0.54–0.17) 0.86 (0.58–1.19)
Heterogeneity structured (survey 1) 8.40 × 10⁴(1.63 × 10⁴–4.12 × 10³) –
Heterogeneity structured (survey 2) 1.18 × 10³(2.42 × 10⁴–4.42 × 10³) –
Heterogeneity structured (survey 3) 7.18 × 10⁴(1.75 × 10⁴–2.79 × 10³) –
ϕ1(Decay of spatial correlation survey 1) 0.61 (0.04–1.31) –
ϕ2(Decay of spatial correlation survey 2) 0.19 (0.03–0.56) –
ϕ3(Decay of spatial correlation survey 3) 0.17 (0.02–0.50) –
DIC 6197 –
Abbreviations: ORodds ratio,95% CrI95% credible interval,DICdeviance information criterion a
3.2%) with a 1% increase in the coverage of bareland/arti-ficial surfaces. In Model II, the variance of the spatially structured random effect increased from 8.4 × 10⁴(1.6 × 10⁴to 4.1 × 10³) in the first survey to 1.2 × 10³(2.4 × 10⁴ to 4.4 ×10³) in the second survey. From this value, the variance decreased to 7.2 × 10⁴(1.7 × 10⁴to 2.8 × 10³) in the final survey. These findings imply that the amount of spatial variability in the data changed over time with the distribution of seropositive cases becoming more homoge-neous at the end of the study period (Table4).
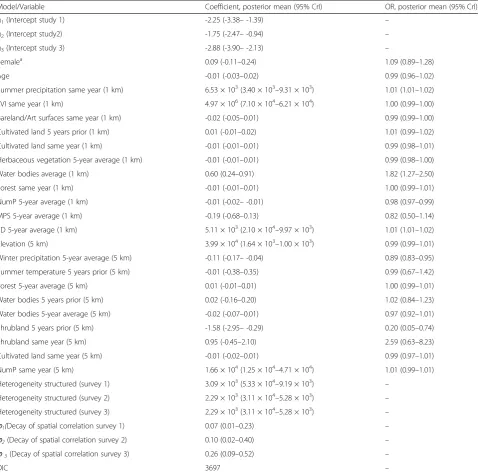
[image:9.595.60.539.110.584.2]Model II ofE. multilocularisseropositivity showed that, within the 1 km buffers, there was an increase of 0.6% (95% CrI: 0.3–0.9%) in the odds of seropositivity for a 1 mm increase in summer mean precipitation. Also, 82.6% (95% CrI: 27.4–150.5%) and 0.5% (95% CrI: 0.02–1.00%) increases in the odds of seropositivity for increases of 1% in the 5-year average of water coverage and 1 km/km2of ED, respectively. The odds of seropositivity forE. multilo-cularis decreased 1.5% (95% CrI: 0.7–2.2%) with a unit increase in NumP, and by 10.6% (95% CrI: 4.6–16.1%) with
Table 5Regression coefficients, ORs and 95% CrI from Bayesian spatial model (Model II) for human seropositivity forEchinococcus multilocularisin three school-based surveys conducted in Xiji County in 2002–2003, 2006–2007 and 2012–2013
Model/Variable Coefficient, posterior mean (95% CrI) OR, posterior mean (95% CrI)
α1(Intercept study 1) -2.25 (-3.38–-1.39) –
α2(Intercept study2) -1.75 (-2.47–-0.94) –
α3(Intercept study 3) -2.88 (-3.90–-2.13) –
Femalea 0.09 (-0.11–0.24) 1.09 (0.89–1.28)
Age -0.01 (-0.03–0.02) 0.99 (0.96–1.02)
Summer precipitation same year (1 km) 6.53 × 10³(3.40 × 10³–9.31 × 10³) 1.01 (1.01–1.02)
EVI same year (1 km) 4.97 × 10⁶(7.10 × 10⁴–6.21 × 10⁴) 1.00 (0.99–1.00)
Bareland/Art surfaces same year (1 km) -0.02 (-0.05–0.01) 0.99 (0.99–1.00)
Cultivated land 5 years prior (1 km) 0.01 (-0.01–0.02) 1.01 (0.99–1.02)
Cultivated land same year (1 km) -0.01 (-0.01–0.01) 0.99 (0.98–1.01)
Herbaceous vegetation 5-year average (1 km) -0.01 (-0.01–0.01) 0.99 (0.98–1.00)
Water bodies average (1 km) 0.60 (0.24–0.91) 1.82 (1.27–2.50)
Forest same year (1 km) -0.01 (-0.01–0.01) 1.00 (0.99–1.01)
NumP 5-year average (1 km) -0.01 (-0.02–-0.01) 0.98 (0.97–0.99)
MPS 5-year average (1 km) -0.19 (-0.68–0.13) 0.82 (0.50–1.14)
ED 5-year average (1 km) 5.11 × 10³(2.10 × 10⁴–9.97 × 10³) 1.01 (1.01–1.02)
Elevation (5 km) 3.99 × 10⁴(1.64 × 10³–1.00 × 10³) 0.99 (0.99–1.01)
Winter precipitation 5-year average (5 km) -0.11 (-0.17–-0.04) 0.89 (0.83–0.95)
Summer temperature 5 years prior (5 km) -0.01 (-0.38–0.35) 0.99 (0.67–1.42)
Forest 5-year average (5 km) 0.01 (-0.01–0.01) 1.00 (0.99–1.01)
Water bodies 5 years prior (5 km) 0.02 (-0.16–0.20) 1.02 (0.84–1.23)
Water bodies 5-year average (5 km) -0.02 (-0.07–0.01) 0.97 (0.92–1.01)
Shrubland 5 years prior (5 km) -1.58 (-2.95–-0.29) 0.20 (0.05–0.74)
Shrubland same year (5 km) 0.95 (-0.45–2.10) 2.59 (0.63–8.23)
Cultivated land same year (5 km) -0.01 (-0.02–0.01) 0.99 (0.97–1.01)
NumP same year (5 km) 1.66 × 10⁴(1.25 × 10⁴–4.71 × 10⁴) 1.01 (0.99–1.01)
Heterogeneity structured (survey 1) 3.09 × 10³(5.33 × 10⁴–9.19 × 10³) –
Heterogeneity structured (survey 2) 2.29 × 10³(3.11 × 10⁴–5.28 × 10³) –
Heterogeneity structured (survey 3) 2.29 × 10³(3.11 × 10⁴–5.28 × 10³) –
ϕ1(Decay of spatial correlation survey 1) 0.07 (0.01–0.23) –
ϕ2(Decay of spatial correlation survey 2) 0.10 (0.02–0.40) –
ϕ3(Decay of spatial correlation survey 3) 0.26 (0.09–0.52) –
DIC 3697 –
Abbreviations: ORodds ratio,95% CrI95% credible interval,DICdeviance information criterion a
a 1 mm increase in winter mean precipitation. The odds of seropositivity also decreased 79.4% (95% CrI: 25.8– 94.8%) with a 1% increase in the coverage of shrubland. The variance of the spatial random effects decreased from 3.1 × 10³(5.3 × 10⁴to 9.2 × 10³) in survey 1 to 2.3 × 10³ (3.1 × 10⁴to 5.3 × 10³) in survey 2 and to 2.3 × 10³(3.1 × 10⁴to 5.3 × 10³) in survey 3.
The values of the decay parameter for spatial correl-ation (ϕ) in the model of E. granulosus seropositivity were 0.6 in the first survey, 0.2 in the second survey and 0.2 in the third survey. These estimates indicate that after accounting for the effect of covariates, the radii of the clusters were approximately 555, 1752 and 1959 km, respectively (ϕ is measured in decimal degrees, there-fore, the cluster size is calculated dividing 3 by ϕ; at the equator, one decimal degree is approximately 111 km). The same values in the model of seropositivity for E. multilocularis were 0.07, 0.10 and 0.26, for surveys 1, 2 and 3, with cluster sizes of 4757, 3330 and 1280 km, respectively. These results imply that spatial correlation in the risk of seropositivities for E. granulosus and E. multilocularis was evident between schools with rela-tively large distances separating them.
Spatial predictions
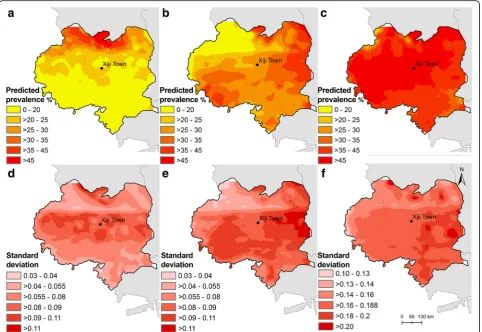
Maps of the median and SD of the posterior distribu-tions of predicted seroprevalence ofE. granulosusfor the years 2002–2003, 2006–2007 and 2012–2013 are shown in Fig. 3. The north-central part of the county was an area with persistent high predicted seroprevalence dur-ing the surveys, with the range of high seroprevalence areas expanding to cover the entire county by the time of the third survey. Prediction uncertainty was generally higher in the central and eastern parts of the county.
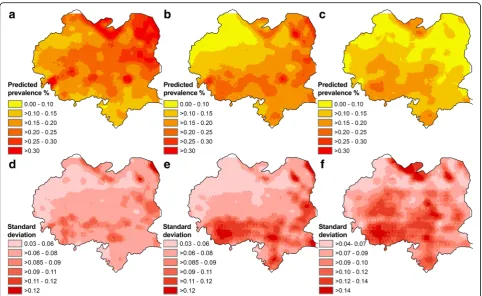
Maps of the median and SD of the posterior distribu-tions of predicted seroprevalence ofE. multilocularisare presented in Fig. 4. Areas of high predicted seropreva-lence in the north, northeast and centre of the county gradually decreased from survey 1 to survey 3, leaving some residual foci of high seroprevalence in the central north and southwest parts of the county. Maps of the posterior SDs demonstrate that the level of uncertainty increased over time.
Discussion
In this study, we present model-based predictive risk maps of human seropositivities for E. granulosusand E. multilocularis for Xiji County, for the years 2002–2003, 2006–2007 and 2012–2013. Previous epidemiological reports on CE and AE infections in NHAR were mostly descriptive, reporting prevalence estimates at specific locations [44, 57,58]. Spatially explicit statistical models were constructed previously to predict the spatial distri-bution of infection with E. multilocularis among the
non-student population in Xiji County in 2002–2003 [27]. That model showed that the landscape features associated with an increased AE risk in Xiji County differed from previous observations in Zhang County in the neighbouring Gansu Province [21, 23]. Unlike the findings in Zhang County, where grassland/shrubland favoured the creation of optimal peri-domestic habitats for E. multilocularis intermediate host species, and the development of a peri-domestic cycles involving dogs [21,23], in Xiji County, abundance of reforested lowland pastures was correlated with higher prevalence of hu-man AE risk. This finding supports the hypothesis that the transmission of E. multilocularismay occur through a diversity of host communities in China [27]. Therefore, extended monitoring of the seroprevalence of both, CE and AE, in the context of landscape transformation was suggested for Xiji County to assess the potential impact of local environmental factors on the transmission dynam-ics of E. granulosusandE. multilocularis [27]. Also, pre-dictive estimates of the prevalence of infections in humans over time are currently required to inform and support the ongoing implementation process for prevention and control [10,29].
In general, the risk of seropositivity for E. granulosus
goats, 19% of camels and 24% of pigs were infected with
E. granulosusin 2008 [69].
The land cover in NHAR has been modified consider-ably in recent decades [49,70]. Because landscape charac-teristics may determine directly or indirectly the feeding behaviour, growth rates, reproductive efficiency and im-munological mechanisms of domestic animals [71], it was not surprising to find that the extent of various vegetation types were associated with the risk of seropositivity forE. granulosus. A reduction of bareland and the increases of woody vegetation types such as forest and shrubland may have sustained the E. granulosus life-cycle by facilitating the geographical expansion and interactions of competent hosts that move in response to available food sources [8,
72]. The movement of domestic animals and changes in their feeding practices can also be explained by land cover changes that contributed to loss or fragmentation of nat-ural habitats indicated by metrics such as, NumP and MPS, that were significantly associated with the risk of seropositivity forE. granulosus[73–75]. The positive asso-ciation between the seroprevalence of E. granulosus and the extent of area covered by water was unexpected and
deserves further investigation. However, this relationship may be explained partially by the same mechanism that associates positively and negativelyE. granulosusrisk with summer and winter precipitation, respectively, at the time of the survey. Sufficient ground moisture is an important determinant of the survival and infectivity ofEchinococcus
spp. eggs in the external environment [76, 77]. Also, due to the lack of piped water in some areas in the south of NHAR in past decades, the inhabitants had to rely mainly on natural drinking water supplies such as seasonal rivu-lets and temporary wells dug in dry-river beds [78]. Do-mestic dogs had also free access to these water supplies, which may have led to water contamination with the para-site eggs and increased risk ofEchinococcusspp. transmis-sion to the human population [78].
Increased annual rainfall has been shown to be associ-ated with high infection rates of E. granulosus in live-stock from hyperendemic regions for CE in Ethiopia and north-central Chile [79, 80]. Also, studies conducted in Iran and Saudi Arabia reported seasonal variations in the prevalence ofE. granulosusinfection during abattoir meat inspections [81,82].
[image:11.595.58.541.88.420.2]The observed differences ofE. granulosus risk among females and males and the negative association with age may be exposure-related [44, 83, 84]. However, it has also been suggested that immunological and hormonal gender differences may account for higher infection rates in females than males [44].
In contrast to the high seroprevalence and geographical expansion of the seropositivity forE. granulosus, the sero-positivity for E. multilocularis was lower and decreased during the three surveys. In 2002–2003, most areas in the county had estimated seroprevalences ofE. multilocularis
between 10 and 30%, with higher risk in those communi-ties located in the north-east and central part. An import-ant reduction was observed in the north-western area of Xiji in 2006–2007, and in north-eastern Xiji in 2012– 2013. Seroprevalences ofE. multilocularisremained high-est in the south-whigh-est throughout the surveys. Overall, the findings of this study do not support the evidence from Europe and other regions in Asia that indicates the spreading ofE. multilocularis[2,85,86]. This discrepancy could be due to different local transmission dynamics of the parasite in Xiji County and to novel interactions be-tween the recently transformed local landscape, the para-site and its hosts [27]. However, issues related to the inherent limitations of sampling variation and different methodological approaches should also be considered.
[image:12.595.57.540.86.382.2]not provide an optimal habitat for the transmission of E. multilocularis. Because different classification methods and definitions were used in relation to the previous study in Xiji County, the results need to be interpreted with caution. However, the results support the hypothesis that the land cover characteristics facilitatingE. multilocularis transmis-sion in Xiji County are different from those favouring the transmission of the parasite in the south of Gansu Province [27]. Despite many epidemiological differences betweenE. granulosusandE. multilocularis, the significant positive as-sociations between E. granulosus risk and the extent of water and summer precipitation, and the negative associ-ation with winter precipitassoci-ation, were also found forE. mul-tilocularisrisk in Xiji County. Examination of the viability ofE. multiloculariseggs particularly, has revealed that the eggs are sensitive to microclimatic conditions such as moisture levels or humidity [76]. Laboratory studies indicated that E. multilocularis eggs are more resist-ant to heat if suspended in water [94].
Interventions to reduce the risk of human infection in NHAR are in line with the guidelines of the National Con-trol Programme [6]. Mass-community screening surveys, health education campaigns, regular dog treatment with praziquantel, patient treatment and animal offal inspec-tion and control in slaughterhouses have been taking place across the NHAR since 2005 [6, 7]. Due to the lack of surveillance data and an incomplete understanding of the factors influencing parasite transmission, it has been diffi-cult to forecast the impacts of the control measures [10]. The results of the current study are important for estimat-ing the burden of CE and AE in Xiji County. In addition, considerable small-scale spatial variation in seropositivities for E. granulosus and E. multilocularis was observed which indicates that there is scope for predictive risk maps to help inform spatially targeted control measures in Xiji County. Areas of priority for AE control include the north and south-western part of the county, whereas CE control is required throughout.
Important limitations of the study were the different survey designs used between periods, affecting compar-ability of the data, and the use of schools to geolocate chil-dren, which might not reflect where exposure occurred. Also, children seropositivity for E. granulosus and/or E. multiloculariswas defined using specific antibody testing by ELISA using EgB and EmP. The poor diagnostic per-formance of these current serological tests and cross-reaction with other helminthic infections, including other types of human echinococcoses [95], and gastrointestinal malignancies remain a critical issue for the diagnosis of CE and AE and represent a source of misinterpretation in areas where both infections co-exist [35,90]. Nevertheless, the analyses revealed thatE. granulosusrisk has increased and become more widespread across Xiji County during the study period. The patterns ofE. multilocularisrisk did
not concur with the reported expansion of E. multilocu-laris in other regions. Clearly, control of CE is a public health priority in Xiji County, whereas further research is required to explore in more detail the potential factors that may be influencing the changing burden of AE.
Conclusions
This work provides detailed geographical information regarding the changes in the predicted prevalence of human seropositivities forE. granulosusandE. multilocu-laris in Xiji County, a highly endemic area for human echinococcoses. The study period was from 2002 to 2013, during which extensive landscape restoration projects were implemented in NHAR and other parts of China. The different models developed in this study indicate that the human seropositivity for E. granulosus expanded across Xiji during the study period, while seropositivity for
E. multilocularis became more confined in communities located in the south of the county. These results help to identify priority areas where targeted prevention and con-trol efforts are most required.
Abbreviations
95% CrI:95% credible intervals; AE: Alveolar echinococcosis; AIC: Akaike information criterion; ASTER: Advanced Spaceborne Thermal Emission and Reflection Radiometer; CE: Cystic echinococcosis; DALYs: Disability-adjusted life years; DIC: Deviance information criterion; ED: Edge density; EgB: Cyst fluid antigen B; EmP:E. multiloculariscrude protoscolex extract; ELISA: Enzyme-linked immunosorbent assay; EROS: Earth Resources Observation and Science; ESPA: Center Science Processing Architecture; EVI: Enhanced vegetation index; GDEM: Global digital elevation model; IDW: Inverse distance weighting; MA: Moving average; MPI: Mean shape index; MPS: Mean patch size; NHAR: Ningxia Hui Autonomous Region; NUMP: Number of patches; OR: Odds ratio; PD: Patch density; SD: Standard deviation; USGS: United States Geological Survey; UTM: Universal Transverse Mercator
Acknowledgements
The authors are grateful to the Chinese Academy of Sciences for providing us with the climate data from 1980 to 2013. We acknowledge financial support by the National Health and Medical Research Council (NHMRC) of Australia of a NHMRC Project Grant (APP1009539). AMCR is a PhD Candidate supported by a Postgraduate Award from The Australian National University, ACAC is a NHMRC Senior Research Fellow, DPM is a NHMRC Senior Principal Research Fellow and DJG is a NHMRC Career Development Fellow. The funders had no role in study design, data collection and analysis, decision to publish, or preparation of the manuscript.
Funding
We acknowledge financial support by the National Health and Medical Research Council (NHMRC) of Australia (APP1009539). AMCR is a PhD Candidate supported by a Postgraduate Award from The Australian National University and ACAC is a NHMRC Senior Research Fellow. DPM is a NHMRC Senior Principal Research Fellow and DJG is a NHMRC Career Development Fellow. The funders had no role in study design, data collection and analysis, decision to publish, or preparation of the manuscript.
Availability of data and materials
The data used in the present study are available from the corresponding author upon reasonable request.
Authors’contributions
manuscript. AMCR and ACAC finalised the manuscript. All authors read and approved the final manuscript.
Ethics approval and consent to participate
The protocol for this study was reviewed and approved by the Human Research Ethics Committees of Ningxia Medical University, QIMR Berghofer Medical Research Institute and The Australian National University.
Consent for publication Not applicable.
Competing interests
The authors declare that they have no competing interests.
Publisher’s Note
Springer Nature remains neutral with regard to jurisdictional claims in published maps and institutional affiliations.
Author details
1Research School of Population Health, The Australian National University,
Canberra, Australian Capital Territory 0200, Australia.2Ningxia Medical
University, 692 Shengli St, Xingqing, Yinchuan, Ningxia Hui Autonomous Region, China.3Molecular Parasitology Laboratory, QIMR Berghofer Medical Research Institute, Brisbane, Queensland 4006, Australia.4The University of
Queensland, School of Veterinary Science, Gatton, Queensland, Australia.
5The University of Queensland, Queensland Alliance for Agriculture and Food
Innovation, Gatton, Queensland 4343, Australia.6The University of Queensland, School of Public Health, Brisbane, Queensland 4006, Australia.
7Children’s Health and Environment Programme, Queensland Children’s
Medical Research Institute, The University of Queensland, Brisbane, Queensland 4101, Australia.
Received: 8 November 2017 Accepted: 4 March 2018
References
1. Johnson LR, Ben-Horin T, Lafferty KD, McNally A, Mordecai E, Paaijmans KP, et al. Understanding uncertainty in temperature effects on vector-borne disease: a Bayesian approach. Ecology. 2015;96(1):203–13.
2. Torgerson PR, Keller K, Magnotta M, Ragland N. The global burden of alveolar echinococcosis. PLoS Negl Trop Dis. 2010;4(6):e722.
3. Torgerson PR, Devleesschauwer B, Praet N, Speybroeck N, Willingham AL, Kasuga F, et al. World Health Organization estimates of the global and regional disease burden of 11 foodborne parasitic diseases, 2010: a data synthesis. PLoS Med. 2015;12(12):e1001920.
4. Budke CM, Deplazes P, Torgerson PR. Global socioeconomic impact of cystic echinococcosis. Emerg Infect Dis. 2006;12(2):296–303.
5. Coordinating Office of the National Survey on the Important Human Parasitic Diseases. A national survey on current status of the important parasitic diseases in human population. Zhongguo Ji Sheng Chong Xue Yu Ji Sheng Chong Bing Za Zhi. 2005;23(5):332–40.
6. Zhang W, Zhang Z, Wu W, Shi B, Li J, Zhou X, et al. Epidemiology and control of echinococcosis in Central Asia, with particular reference to the People’s Republic of China. Acta Trop. 2015;141:235–43.
7. World Health Organization and World Organisation for Animal Health. Report of the WHO informal working group on cystic and alveolar echinococcosis surveillance, prevention and control, with the participation of the Food and Agriculture Organization of the United Nations and the World Organisation for Animal Health. 2011.http://apps.who.int/iris/ bitstream/10665/44785/1/9789241502924_eng.pdf. Accessed 15 Dec 2014. 8. Peringer A, Schulze KA, Stupariu I, Stupariu M-S, Rosenthal G, Buttler A, et al.
Multi-scale feedbacks between tree regeneration traits and herbivore behavior explain the structure of pasture-woodland mosaics. Landsc Ecol. 2016;31(4):913–27.
9. Li T, Chen X, Zhen R, Qiu J, Qiu D, Xiao N, et al. Widespread co-endemicity of human cystic and alveolar echinococcosis on the eastern Tibetan Plateau, northwest Sichuan/southeast Qinghai, China. Acta Trop. 2010; 113(3):248–56.
10. Craig P, Hegglin D, Lightowlers M, Torgerson P, Wang Q. Chapter two. Echinococcosis: Control and prevention. Adv Parasitol. 2017;96:55–158.
11. Ito A, Urbani C, Jiamin Q, Vuitton DA, Dongchuan Q, Heath DD, et al. Control of echinococcosis and cysticercosis: a public health challenge to international cooperation in China. Acta Trop. 2003;86(1):3–17. 12. Xu J, Xu J-F, Li S-Z, Zhang L-J, Wang Q, Zhu H-H, et al. Integrated control
programmes for schistosomiasis and other helminth infections in PR China. Acta Trop. 2015;141:332–41.
13. Romig T, Deplazes P, Jenkins D, Giraudoux P, Massolo A, Craig PS, et al. Chapter five. Ecology and life cycle patterns ofEchinococcusspecies. Adv Parasitol. 2017;95:213–314.
14. Umhang G, Knapp J, Hormaz V, Raoul F, Boué F. Using the genetics of
Echinococcus multilocularisto trace the history of expansion from an endemic area. Infect Genet Evol. 2014;22:142–9.
15. Torgerson P. The emergence of echinococcosis in central Asia. Parasitology. 2013;140(13):1667–73.
16. Yang D, Zhang T, Zeng Z, Zhao W, Zhang W, Liu A. The first report of human-derived G10 genotype ofEchinococcus canadensisin China and possible sources and routes of transmission. Parasitol Int. 2015;64(5):330–3. 17. Davidson RK, Romig T, Jenkins E, Tryland M, Robertson LJ. The impact of
globalisation on the distribution ofEchinococcus multilocularis. Trends Parasitol. 2012;28(6):239–47.
18. Deplazes P, Rinaldi L, Rojas CA, Torgerson P, Harandi M, Romig T, et al. Chapter six. Global distribution of alveolar and cystic echinococcosis. Adv Parasitol. 2017;95:315–493.
19. Fan X, Ma Z, Yang Q, Han Y, Mahmood R, Zheng Z. Land use/land cover changes and regional climate over the Loess Plateau during 2001–2009. Part I: observational evidence. Clim Chang. 2015;129(3–4):427–40. 20. The University of Nottingham. China Policy Institute:“Grain for Green
Programme”in China: policy making and implementation? Briefing series. Issue 60. 2010.https://www.nottingham.ac.uk/iaps/documents/cpi/briefings/ briefing-60-reforestation.pdf. Accessed 2 June 2016.
21. Giraudoux P, Craig P, Delattre P, Bao G, Bartholomot B, Harraga S, et al. Interactions between landscape changes and host communities can regulateEchinococcus multilocularistransmission. Parasitology. 2003; 127(Suppl 1):S121–S31.
22. Giraudoux P, Delattre P, Habert M, Quéré JP, Deblay S, Defaut R, et al. Population dynamics of fossorial water vole (Arvicola terrestrisScherman): a land use and landscape perspective. Agric Ecosyst Environ. 1997;66(1):47–60. 23. Craig P, Giraudoux P, Shi D, Bartholomot B, Barnish G, Delattre P, et al. An
epidemiological and ecological study of human alveolar echinococcosis transmission in South Gansu, China. Acta Trop. 2000;77(2):167–77. 24. Wang Q, Vuitton DA, Qiu J, Giraudoux P, Xiao Y, Schantz PM, et al. Fenced
pasture: a possible risk factor for human alveolar echinococcosis in Tibetan pastoralist communities of Sichuan, China. Acta Trop. 2004;90(3):285–93. 25. Wang Q, Xiao Y-f, Vuitton DA, Schantz PM, Raoul F, Budke C, et al.
Impact of overgrazing on the transmission ofEchinococcus multilocularis
in Tibetan pastoral communities of Sichuan Province, China. Chin Med J. 2007;120(3):237.
26. Wang Q, Raoul F, Budke C, Craig PS, Xiao Y-f, Vuitton DA, et al. Grass height and transmission ecology ofEchinococcus multilocularisin Tibetan communities, China. Chin Med J. 2010;123(1):61.
27. Pleydell DR, Yang YR, Danson FM, Raoul F, Craig PS, McManus DP, et al. Landscape composition and spatial prediction of alveolar echinococcosis in southern Ningxia, China. PLoS Negl Trop Dis. 2008;2(9):e287.
28. Marston CG, Giraudoux P, Armitage RP, Danson FM, Reynolds SC, Wang Q, et al. Vegetation phenology and habitat discrimination: Impacts forE. multilocularis
transmission host modelling. Remote Sens Environ. 2016;176:320–7. 29. Atkinson JAM, Gray DJ, Clements AC, Barnes TS, McManus DP, Yang YR.
Environmental changes impactingEchinococcustransmission: research to support predictive surveillance and control. Glob Chang Biol. 2013;19(3):677–88. 30. Magalhães RJS, Salamat MS, Leonardo L, Gray DJ, Carabin H, Halton K, et al.
Mapping the risk of soil-transmitted helminthic infections in the Philippines. PLoS Negl Trop Dis. 2015;9(9):e0003915.
31. Diggle PJ, Giorgi E. Geostatistical mapping of helminth infection rates. Lancet Infect Dis. 2015;15(1):9–11.
32. Hamm NA, Magalhaes RJS, Clements AC. Earth observation, spatial data quality, and neglected tropical diseases. PLoS Negl Trop Dis. 2015;9(12):e0004164. 33. Scholte RG, Gosoniu L, Malone JB, Chammartin F, Utzinger J, Vounatsou P.
Predictive risk mapping of schistosomiasis in Brazil using Bayesian geostatistical models. Acta Trop. 2014;132:57–63.
35. Brunetti E, Kern P, Vuitton DA. Expert consensus for the diagnosis and treatment of cystic and alveolar echinococcosis in humans. Acta Trop. 2010; 114(1):1–16.
36. Feng Y, Wu X, Ma R, Duan M, Yang J. Retrospective survey and analysis on hospitalized hydatid cases between 1991 and 2010 in Ningxia. Ningxia Med J. 2012;7:021.
37. Yang YR, Craig PS, Sun T, Vuitton DA, Giraudoux P, Jones MK, et al. Echinococcosis in Ningxia Hui Autonomous Region, northwest China. Trans R Soc Trop Med Hyg. 2008;102(4):319–28.
38. Craig P, Liu D, Shi D, Macpherson C, Barnish G, Reynolds D, et al. A large focus of alveolar echinococcosis in central China. Lancet. 1992;340(8823):826–31. 39. Bartholomot G, Vuitton DA, Harraga S, Shi DZ, Giraudoux P, Barnish G, et al.
Combined ultrasound and serologic screening for hepatic alveolar echinococcosis in central China. Am J Trop Med Hyg. 2002;66(1):23–9. 40. Carmena D, Benito A, Eraso E. Antigens for the immunodiagnosis of
Echinococcus granulosusinfection: An update. Acta Trop. 2006;98(1):74–86. 41. WHO Informal Working Group. International classification of ultrasound
images in cystic echinococcosis for application in clinical and field epidemiological settings. Acta Trop. 2003;85(2):253–61.
42. Kern P, Wen H, Sato N, Vuitton DA, Gruener B, Shao Y, et al. WHO classification of alveolar echinococcosis: principles and application. Parasitol Int. 2006;55:S283–S7.
43. WHO Informal Working Group on Echinococcosis. PAIR: Puncture, Aspiration, Injection, Re-Aspiration. An option for the treatment of cystic echinococcosis. 2001.http://apps.who.int/iris/bitstream/10665/67207/1/ WHO_CDS_CSR_APH_2001.6.pdf. Accessed 15 Mar 2015.
44. Yang YR, Sun T, Li Z, Zhang J, Teng J, Liu X, et al. Community surveys and risk factor analysis of human alveolar and cystic echinococcosis in Ningxia Hui Autonomous Region, China. Bull World Health Organ. 2006;84(9):714–21. 45. Diggle P, Ribeiro PJ. Model-based geostatistics. New York: Springer; 2007. p.
199–212.
46. The National Aeronautics and Space Administration (NASA) and Ministry of Economy Trade and Industry (METI): The Advanced Spaceborne Thermal Emission and Reflection Radiometer (ASTER) Global Digital Elevation Model (GDEM). Version 2. ASTER GDEM is a product of NASA and METI. 2011.
https://asterweb.jpl.nasa.gov/gdem.asp. Accessed 16 Nov 2015. 47. Department of the Interior - The United States Geological Survey (USGS).
Landsat 4-7 Climate Data Record (CDR) surface reflectance, Version 6.4. Product Guide. 2016.https://landsat.usgs.gov/cdr. Accessed 2 May 2016. 48. The United States Geological Survey (USGS). EarthExplorer. 2016.http://
earthexplorer.usgs.gov. Accessed 21 Oct 2016.
49. Cadavid Restrepo AM, Yang YR, Hamm NA, Gray DJ, Barnes TS, Williams GM, et al. Land cover change during a period of extensive landscape restoration in Ningxia Hui Autonomous Region, China. Sci Total Environ. 2017;598:669–79.
50. DIVA GIS. DIVA-GIS: Free, simple & effective. 2001.http://www.diva-gis.org/. Accessed 25 Nov 2015.
51. ESRI: Environmental Systems Research Institute. ArcGIS Software version 10. 3.1. Redlands. California. 2015.
52. Nagendra H, Munroe DK, Southworth J. From pattern to process: landscape fragmentation and the analysis of land use/land cover change. Agric Ecosyst Environ. 2004;101(2):111–5.
53. van Kesteren F, Qi X, Tao J, Feng X, Mastin A, Craig PS, et al. Independent evaluation of a canine echinococcosis control programme in Hobukesar County, Xinjiang, China. Acta Trop. 2015;145:1–7.
54. R Core Team. R. A language and environment for statistical computing. Vienna: R Foundation for Statistical Computing; 2015.
55. Diggle PJ, Tawn J, Moyeed R. Model-based geostatistics. J Roy Stat Soc Ser C (Appl Stat). 1998;47(3):299–350.
56. Members of OpenBUGS Project Management Group. OpenBUGS software version 3.2.2 rev 1012. 2014.https://www.mrc-bsu.cam.ac.uk/software/bugs/. 57. Yang YR, Cheng L, Yang SK, Pan X, Sun T, Li X, et al. A hospital-based
retrospective survey of human cystic and alveolar echinococcosis in Ningxia Hui Autonomous Region, PR China. Acta Trop. 2006;97(3):284–91. 58. Yang YR, Craig PS, Vuitton DA, Williams GM, Sun T, Liu TX, et al. Serological
prevalence of echinococcosis and risk factors for infection among children in rural communities of southern Ningxia, China. Tropical Med Int Health. 2008;13(8):1086–94.
59. Laurimaa L, Davison J, Süld K, Plumer L, Oja R, Moks E, et al. First report of highly pathogenicEchinococcus granulosusgenotype G1 in dogs in a European urban environment. Parasit Vectors. 2015;8:182.
60. Boufana B, Lett WS, Lahmar S, Buishi I, Bodell AJ, Varcasia A, et al.
Echinococcus equinusandEchinococcus granulosus sensu strictofrom the United Kingdom: genetic diversity and haplotypic variation. Int J Parasitol. 2015;45(2–3):161–6.
61. Schweiger A, Ammann RW, Candinas D, Clavien P-A, Eckert J, Gottstein B, et al. Human alveolar echinococcosis after fox population increase, Switzerland. Emerg Infect Dis. 2007;13(6):878–82.
62. Usubalieva J, Minbaeva G, Ziadinov I, Deplazes P, Torgerson PR. Human alveolar echinococcosis in Kyrgyzstan. Emerg Infect Dis. 2013;19(7): 1095–7.
63. Lind EO, Juremalm M, Christensson D, Widgren S, Hallgren G, Ågren E, et al. First detection ofEchinococcus multilocularisin Sweden, February to March 2011. Euro Surveill. 2011;16(14):19836.
64. Jenkins EJ, Peregrine AS, Hill JE, Somers C, Gesy K, Barnes B, et al. Detection of European strain ofEchinococcus multilocularisin North America. Emerg Infect Dis. 2012;18(6):1010.
65. Robinson TP, Wint GW, Conchedda G, Van Boeckel TP, Ercoli V, Palamara E, et al. Mapping the global distribution of livestock. PLoS One. 2014;9(5):e96084. 66. Cleary E, Barnes TS, Xu Y, Zhao H, Clements AC, Gray DJ, et al. Impact of
“Grain to Green”Programme on echinococcosis infection in Ningxia Hui Autonomous Region of China. Vet Parasitol. 2014;205(3):523–31. 67. Ma T, Wu X, Marvin F, Yun L. Infection prevalence study of the main hosts
ofEchinococcusin Ningxia. Ningxia Med J. 2014;4:376e8. (In Chinese) 68. Wu X. Investigation of Ningxia livestock hydatid infection status in 2012.
Ningxia Med J. 2015;37:277–8.
69. Zhenghuan W, Xiaoming W, Xiaoqing L. Echinococcosis in China, a review of the epidemiology ofEchinococcusspp. EcoHealth. 2008;5(2):115–26. 70. Zhang L, Tu Q, Mol AP. Payment for environmental services: The sloping
land conversion program in Ningxia autonomous region of China. Chin World Econ. 2008;16(2):66–81.
71. Thornton PK, van de Steeg J, Notenbaert A, Herrero M. The impacts of climate change on livestock and livestock systems in developing countries: a review of what we know and what we need to know. Agric Syst. 2009; 101(3):113–27.
72. Samuels I, Cupido C, Swarts MB, Palmer AR, Paulse JW. Feeding ecology of four livestock species under different management in a semi-arid pastoral system in South Africa. Afr J Range Forage Sci. 2016;33(1):1–9.
73. Blaikie P, Brookfield H. Land degradation and society. New York: Routledge; 2015.
74. Bommarco R, Kleijn D, Potts SG. Ecological intensification: harnessing ecosystem services for food security. Trends Ecol Evol. 2013;28(4):230–8. 75. Beasley JC, Olson ZH, DeVault TL. Ecological role of vertebrate scavengers.
In: Benbow ME, Tomberlin JK, Tarone AM, editors. Carrion ecology, evolution and their applications. Boca Raton: CRC Press; 2015. p. 107–27. 76. Veit P, Bilger B, Schad V, Schäfer J, Frank W, Lucius R. Influence of
environmental factors on the infectivity ofEchinococcus multiloculariseggs. Parasitology. 1995;110:79–86.
77. Thevenet PS, Jensen O, Drut R, Cerrone GE, Grenóvero MS, Alvarez HM, et al. Viability and infectiousness of eggs ofEchinococcus granulosusaged under natural conditions of inferior arid climate. Vet Parasitol. 2005;133(1):71–7. 78. Yang YR, Clements AC, Gray DJ, Atkinson J-AM, Williams GM, Barnes TS,
et al. Impact of anthropogenic and natural environmental changes on
Echinococcustransmission in Ningxia Hui Autonomous Region, the People’s Republic of China. Parasit Vectors. 2012;5:146.
79. Acosta-Jamett G, Cleaveland S, Cunningham AA, Barend M, Craig PS.
Echinococcus granulosusinfection in humans and livestock in the Coquimbo region, north-central Chile. Vet Parasitol. 2010;169(1):102–10.
80. Fromsa A, Jobre Y. Infection prevalence of hydatidosis (Echinococcus granulosus, Batsch, 1786) in domestic animals in Ethiopia: A synthesis report of previous surveys. Ethiop Vet J. 2011;15(2):11–33.
81. Ansari-Lari M. A retrospective survey of hydatidosis in livestock in Shiraz, Iran, based on abattoir data during 1999–2004. Vet Parasitol. 2005;133(1):119–23. 82. Ibrahim MM. Study of cystic echinococcosis in slaughtered animals in Al Baha region, Saudi Arabia: Interaction between some biotic and abiotic factors. Acta Trop. 2010;113(1):26–33.
83. Tiaoying L, Jiamin Q, Wen Y, Craig PS, Xingwang C, Ning X, et al. Echinococcosis in Tibetan populations, western Sichuan Province, China. Emerg Infect Dis. 2005;11(12):1866–73.
85. Gottstein B, Stojkovic M, Vuitton DA, Millon L, Marcinkute A, Deplazes P. Threat of alveolar echinococcosis to public health - a challenge for Europe. Trends Parasitol. 2015;31(9):407–12.
86. Eckert J. WHO/OIE manual on echinococcosis in humans and animals: a public health problem of global concern 2001.http://apps.who.int/iris/ bitstream/10665/42427/1/929044522X.pdf. Accessed 2 June 2015. 87. Lidicker WZ. Landscape approaches in mammalian ecology and
conservation. Minneapolis: University of Minnesota Press; 1995. 88. Pardini R, de Souza SM, Braga-Neto R, Metzger JP. The role of forest
structure, fragment size and corridors in maintaining small mammal abundance and diversity in an Atlantic forest landscape. Biol Conserv. 2005; 124(2):253–66.
89. Silva M, Hartling L, Opps SB. Small mammals in agricultural landscapes of Prince Edward Island (Canada): effects of habitat characteristics at three different spatial scales. Biol Conserv. 2005;126(4):556–68.
90. Marston CG, Danson FM, Armitage RP, Giraudoux P, Pleydell DR, Wang Q, et al. A random forest approach for predicting the presence ofEchinococcus multilocularisintermediate hostOchotonaspp. presence in relation to landscape characteristics in western China. Appl Geogr. 2014;55:176–83. 91. Viel J-F, Giraudoux P, Abrial V, Bresson-Hadni S. Water vole (Arvicola terrestris
Scherman) density as risk factor for human alveolar echinococcosis. Am J Trop Med Hyg. 1999;61(4):559–65.
92. Raoul F, Deplazes P, Nonaka N, Piarroux R, Vuitton DA, Giraudoux P. Assessment of the epidemiological status ofEchinococcus multilocularisin foxes in France using ELISA coprotests on fox faeces collected in the field. Int J Parasitol. 2001;31(14):1579–88.
93. Raoul F, Pleydell D, Quere J-P, Vaniscotte A, Rieffel D, Takahashi K, et al. Small-mammal assemblage response to deforestation and afforestation in central China. Mammalia. 2008;72(4):320–32.
94. Federer K, Armua-Fernandez MT, Hoby S, Wenker C, Deplazes P. In vivo viability ofEchinococcus multiloculariseggs in a rodent model after different thermo-treatments. Exp Parasitol. 2015;154:14–9.
95. Mário L, Yamano K, Almeida CE, Iesbich MP, Fernandes CD, Goto A, et al. Serological reactivity of patients withEchinococcusinfections (E. granulosus,
E. vogeli, andE. multilocularis) against three antigen B subunits. Parasitol Res. 2010;106(3):741–5.
• We accept pre-submission inquiries
• Our selector tool helps you to find the most relevant journal
• We provide round the clock customer support
• Convenient online submission
• Thorough peer review
• Inclusion in PubMed and all major indexing services
• Maximum visibility for your research
Submit your manuscript at www.biomedcentral.com/submit