This is the Accepted Version of a paper published in the
journal: National Academy of Sciences
Saunderson, Emily A., Spiers, Helen, Mifsud, Karen R., Gutierrez-Mecinas,
Maria, Trollope, Alexandra F., Shaikh, Abeera, Mill, Jonathan, and Reul,
Johannes M.H.M. (2016) Stress-induced gene expression and behavior are
controlled by DNA methylation and methyl donor availability in the dentate
gyrus. Proceedings of the National Academy of Sciences of the United States of
America, 113 (17). pp. 4830-4835.
http://dx.doi.org/
10.1073/pnas.1524857113
! ! ! ! ! ! ! ! ! PNAS%2015*09213R%
!
!
Stress&induced,gene,expression,and,behavior,are,controlled,by,DNA,methylation,and,methyl,
donor,availability,in,the,dentate,gyrus,
!
Emily!A.!Saunderson1,!Helen!Spiers3,!Karen!R.!Mifsud1,!Maria!Gutierrez>Mecinas1,!Alexandra!F.!
Trollope1,!Abeera!Shaikh1,!Jonathan!Mill2,!3,!Johannes!M.H.M.!Reul1*!
!
1Neuro>Epigenetics!Research!Group,!University!of!Bristol,!Bristol!BS1!3NY,!UK! 2University!of!Exeter!Medical!School,!University!of!Exeter,!Exeter!EX2!5DW,!UK!
3Institute!of!Psychiatry,!King’s!College!London,!London!SE5!8AF,!UK! !
Correspondence:!
Professor!Johannes!M.H.M.!Reul! Mail:[email protected]! Phone:!+44!117!331!3137!
Running!title:!DNA!methylation!and!stress>induced!IEGs!and!behavior!
Classification:!Biological!Sciences!(Major);!Neuroscience!(Minor)!
Present!addresses:!A.F.T.:!James!Cook!University,!Townsville,!QLD!4811,!Australia;!M.G.>M.:!
University!of!Glasgow,!Glasgow!G12!8QQ,!UK!
Abstract
!
!Stressful!events!evoke!long>term!changes!in!behavioral!responses;!however!the!underlying!
mechanisms!in!the!brain!are!not!well!understood.!Previous!work!has!shown!that!epigenetic!changes! and!immediate>early!gene!(IEG)!induction!in!stress>activated!dentate!gyrus!(DG)!granule!neurons! play!a!crucial!role!in!these!behavioral!responses.!Here!we!show!that!an!acute!stressful!challenge,!i.e.! forced!swimming,!results!in!DNA!demethylation!at!specific!CpG!sites!close!to!the!c>Fos!
transcriptional!start!site!and!within!the!gene!promoter!region!of!Egr*1!specifically!in!the!DG.! Administration!of!the!(endogenous)!methyl!donor!s>adenosyl!methionine!(SAM)!did!not!affect!CpG! methylation!and!IEG!gene!expression!at!baseline.!However,!administration!of!SAM!before!the!forced! swim!challenge!resulted!in!an!enhanced!CpG!methylation!at!the!IEG!loci!and!suppression!of!IEG! induction!specifically!in!the!DG!and!an!impaired!behavioral!immobility!response!24!h!later.!The! stressor!also!specifically!increased!the!expression!of!the!de%novo!DNA!methyltransferase!Dnmt3a!in! this!hippocampus!region.!Moreover,!stress!resulted!in!an!increased!association!of!Dnmt3a!enzyme! with!the!affected!CpG!loci!within!the!IEG!genes.!No!effects!of!SAM!were!observed!on!stress>evoked! histone!modifications!including!H3S10p>K14ac,!H3K4me3,!H3K9me3!and!H3K27me3.!We!conclude! that!the!DNA!methylation!status!of!IEGs!plays!a!crucial!role!in!FS>induced!IEG!induction!in!DG! granule!neurons!and!associated!behavioral!responses.!In!addition,!the!concentration!of!available! methyl!donor,!possibly!in!conjunction!with!Dnmt3a,!is!critical!for!the!responsiveness!of!dentate! neurons!to!environmental!stimuli!in!terms!of!gene!expression!and!behavior.!!
!
!
Keywords:!Stress,!behavior,!c>Fos,!Egr>1,!DNA!methylation,!epigenetics,!hippocampus!
Significance,statement,
!
Appropriate!behavioral!responses!to!psychologically!stressful!events!are!important!for!maintaining! mental!health!and!wellbeing.!The!consolidation!of!these!behavioral!responses!critically!depends!on! the!induction!of!the!immediate>early!gene!products!c>Fos!and!Egr>1!in!dentate!gyrus!neurons.!In!this! report,!we!found!that!an!intricate!balance!between!DNA!methylation,!DNA!demethylation!and! availability!of!the!methyl!donor!SAM!governs!the!induction!of!these!genes!as!well!as!the!behavioral! responses!after!stress.!These!findings!provide!new!insights!into!the!epigenetic!control!of!gene! expression!underlying!stress>induced!behavioral!adaptation.!!
!
!
!
!
\body,
Introduction,
!
Adaptation!to!stressful!challenges!is!crucial!for!maintaining!health!and!wellbeing.!These!events! induce!physiological!and!behavioral!responses!that!enable!the!individual!to!cope!with!the!challenge.! In!the!brain,!molecular!mechanisms!are!initiated!that!facilitate!learning!of!adaptive!behavioral! responses!and!the!consolidation!of!memories!of!the!event.!Inappropriate!responses!to!stress!have! been!linked!with!psychiatric!disorders!such!as!major!depression!and!anxiety!(1>3).!!
!
Glucocorticoid!hormones,!secreted!in!response!to!a!stressful!challenge,!in!conjunction!with!activated! intracellular!signaling!pathways!in!neurons!of!the!hippocampus!play!a!key!role!in!consolidating! behavioral!responses!to!stress!(4,!5).!The!hippocampal!extracellular!signal>regulated!kinase!mitogen> activated!protein!kinase!(ERK!MAPK)!pathway,!activated!through!N>methyl!D>aspartate!receptors! (NMDA>Rs)!and!other!membrane!receptors,!is!involved!in!behavioral!responses!seen!in!Morris!water! maze!learning,!contextual!fear!conditioning!and!the!forced!swim!test.!In!these!behavioral!paradigms,! phosphorylated!ERK1/2!in!hippocampal!neurons!activate!the!chromatin>modifying!enzymes!MSK1! (mitogen>!and!stress>activated!kinase!1)!and!Elk>1!(ETS!domain!protein!1)!resulting!in!changes!in! gene!transcription!(5-7).!Glucocorticoid!hormones,!via!the!glucocorticoid!receptor!(GR),!facilitate!the! activation!(phosphorylation)!of!MSK1!and!Elk>1!by!ERK1/2.!MSK1!and!Elk>1!activation!lead!to!
phosphorylation!of!serine>10!and!acetylation!of!lysine>14,!respectively,!in!histone!H3!in!multiple! gene!promoters,!such!as!c*Fos!and!Egr*1!(early!growth!response!protein!1),!resulting!in!
forced!swim!test,!the!dentate!gyrus!(DG)!was!identified!as!the!hippocampal!region!conferring!these! molecular!and!behavioral!responses!(4,5,11).!!
!
In!addition!to!histone!H3!phosphorylation!and!acetylation!other!epigenetic!mechanisms!including! histone!methylation!and!DNA!methylation!are!thought!to!be!involved!in!behavioral!responses!to! stress.!Acute!and!chronic!restraint!stress!evokes!distinct!effects!in!histone!H3!methylation!in!various! sub>regions!of!the!hippocampus!(13).!Contextual!fear!conditioning!results!in!histone!H3!methylation! (e.g.!di>methylation!of!lysine>9!(K9)!or!tri>methylation!of!K4!in!histone!H3)!and!DNA!methylation! changes!in!the!hippocampus!(13-16).!Although!c>Fos!and!Egr>1!gene!induction!have!been!shown!to! be!of!critical!importance!for!the!consolidation!of!behavioral!responses!in!the!Morris!water!maze,! fear!conditioning!and!forced!swimming!(FS)!(5,9,17),!the!role!of!histone!and!DNA!methylation! changes!at!these!immediate>early!genes!is!still!unclear.!Interestingly,!administration!of!the! endogenous!methyl!donor!S>adenosyl!methionine!(SAM)!disrupts!the!consolidation!of!behavioral! responses!in!the!forced!swim!test!(18)!suggesting!a!requirement!of!methylation>dependent! epigenetic!mechanisms.!Therefore,!we!postulated!that!in!addition!to!histone!H3!phosphorylation!
and!acetylation,!histone!H3!methylation!and/or!DNA!methylation!changes!may!represent!a! prerequisite!for!FS>induced!c>Fos!and!Egr>1!induction!in!DG!neurons!and!subsequent!behavioral! responses.!!
!
This!study!shows!that!FS!results!in!reduced!DNA!methylation!at!specific!CpGs!within!c>Fos!and!Egr*1! gene!promoters!and!untranslated!regions!in!DG!neurons.!Furthermore,!our!data!show!that!
Results,
!
SAM,impairs,consolidation,of,the,FS&induced,behavioral,responses,,
To!investigate!the!role!of!methylation>dependent!epigenetic!mechanisms!in!stress>induced! behavioral!responses,!we!treated!rats!with!the!endogenous!methyl!donor!SAM!and!measured! changes!in!FS>induced!behavior!(Fig.!1).!As!endogenous!SAM!is!produced!by!the!liver,!we!choose!to! administer!the!methyl!donor!systemically.!In!the!initial!forced!swim!session,!no!(acute)!effect!of!SAM! on!behavior!was!found!(Fig.!1A).!In!the!retest,!however,!animals!treated!with!the!methyl!donor! showed!significantly!less!immobility!behavior!than!the!vehicle>injected!controls!(Fig.!1B),!indicating! that!SAM!treatment!disrupted!consolidation!of!this!behavioral!response!after!the!initial!forced!swim! session.!
!
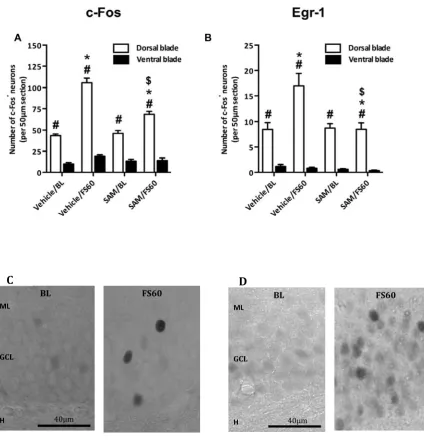
SAM,attenuates,FS&induced,c&Fos,and,Egr&1,induction,in,DG,neurons,,
Previously,!we!have!shown!that!the!induction!of!the!IEG!products!c>Fos!and!Egr>1!in!dentate!granule! neurons!is!required!for!the!behavioral!immobility!response!observed!after!FS!(5,11).!Therefore,!as! SAM!impaired!this!behavioral!response!we!determined!whether!the!methyl!donor!disrupted!c>Fos! and!Egr>1!induction.!Rats!received!a!single!injection!of!SAM!30!minutes!before!FS!and!were!killed!60! minutes!after!the!start!of!the!challenge;!a!time!point!when!the!numbers!of!c>Fos>positive!(c>Fos+)!
and!Egr>1+!DG!granule!neurons!have!reached!peak!levels!after!stress!(5).!SAM!significantly!
DG!as!stress>induced!c>Fos!and!Egr>1!expression!in!the!CA1!and!CA3!regions!of!the!hippocampus!was! unaffected!by!the!injected!methyl!donor!(Fig.!S3).!!!
!
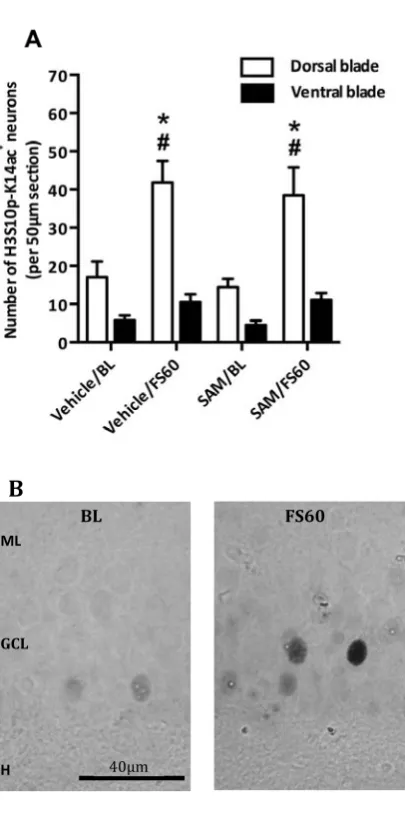
FS&induced,H3S10p&K14ac,formation,is,not,affected,by,SAM,,
FS>evoked!induction!of!IEG!products!c>Fos!and!Egr>1!in!DG!granule!neurons!critically!requires!
H3S10p>K14ac!formation!(5,10,11,21).!Therefore,!we!investigated!whether!the!inhibitory!action!of! SAM!on!c>Fos!and!Egr>1!induction!was!due!to!an!effect!on!H3S10p>K14ac!formation.!For!instance,! SAM!has!been!shown!to!increase!protein!phosphatase!activity!via!methylation!(22).!Treating!rats! with!SAM!before!FS!however!did!not!affect!the!formation!of!H3S10p>K14ac!in!DG!granule!neurons! (Fig.!3).!Furthermore,!no!effect!was!seen!when!immuno>positive!neurons!in!the!dorsal!and!ventral! blades!were!analyzed!separately!(Fig.!S4A).!These!observations!indicate!that!the!methyl!donor!may! attenuate!the!stress>evoked!c>Fos!and!Egr>1!induction!through!a!mechanism!down>stream!from! H3S10p>K14ac!and/or!via!an!alternative,!most!likely!methylation>associated,!epigenetic!mechanism.! Therefore,!the!role!of!histone!and!DNA!methylation!processes!in!FS>induced!c>Fos!and!Egr>1!
expression!was!investigated.!!!
!
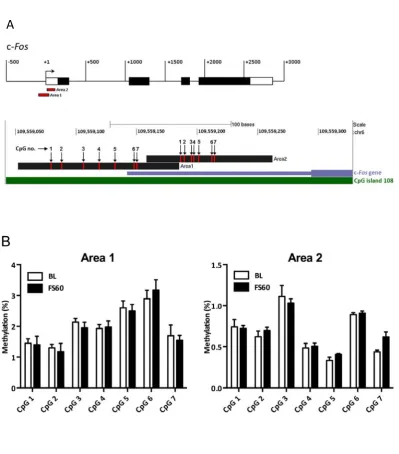
FS,evokes,CpG&specific,demethylation,at,the,c&Fos,and,Egr'1,gene,promoters,specifically,in,the,DG,
Next,!we!asked!whether!the!effect!of!FS!on!c>Fos!and!Egr>1!involved!changes!in!DNA!methylation!at! specific!CpG!dinucleotides!in!the!gene!promoter!and!in!an!area!coding!for!the!mRNA’s!5’!
stress!were!observed!in!Areas!1!and!2!within!the!c>Fos!gene!promoter!and!UTR!(Fig.!S5B)!indicating! neuroanatomical!specificity!of!stress>induced!CpG!methylation!changes.!!
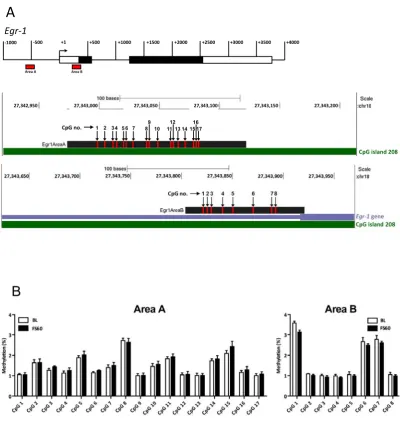
FS!resulted!in!significantly!reduced!DNA!methylation!at!CpGs!5,!11,!13!and!15!in!Area!A!of!the!Egr*1! gene!promoter!in!the!DG,!with!near>significant!differences!at!CpGs!7,!8,!14,!16!and!17!(Fig.!5).!In! Area!B,!we!found!a!trend!of!a!forced!swim!effect!on!the!methylation!of!CpGs!6!and!8!(Fig.!5).!In!the! CA!regions,!however,!CpG!methylation!in!Areas!A!and!B!was!not!affected!by!the!stressor!(Fig.!S6B).!!
!
SAM,treatment,before,forced,swim,stress,increases,DNA,methylation,at,specific,CpG,sites,in,the,c&
Fos,UTR,and,the,Egr'1,gene,promoter,in,the,DG,
Given!the!reduction!of!DNA!methylation!observed!within!the!UTR/promoter!region!of!the!IEGs!in!the! DG!after!FS,!we!examined!whether!SAM!treatment!inhibited!c>Fos!and!Egr>1!induction!by!preventing! the!stress>evoked!CpG!demethylation.!Our!analyses!focused!on!Area!2!in!the!c>Fos!UTR!(Fig.!S5A)! and!Area!A!in!the!Egr*1!gene!promoter!(Fig.!S6A)!as!these!regions!showed!the!largest!stress>induced! CpG!demethylation.!!
SAM!treatment!followed!by!FS!significantly!increased!methylation!of!CpGs!1!and!2!in!the!c>Fos%UTR! (Fig.!6)!and!CpGs!4>8!and!13!in!the!Egr*1!gene!promoter!(Fig.!7).!!CpG!methylation!did!not!increase!in! the!SAM>injected!animals!killed!under!baseline!conditions,!indicating!that!increased!availability!of! the!methyl!donor,!in!the!absence!of!a!stressful!challenge,!is!insufficient!to!increase!CpG!methylation! in!these!DG!neurons.!Furthermore,!except!for!an!increase!in!CpG!1!methylation!in!the!baseline!group! and!a!decrease!in!CpG!1!and!2!methylation!in!the!stressed!group!in!c>Fos!Area!2,!SAM!administration! did!not!change!CpG!methylation!at!either!IEG!gene!promoter/UTR!in!the!CA!regions!(Fig.!S7).!!
Although!we!observed!a!significant!main!effect!of!stress!on!DNA!methylation!levels,!post>hoc!
apparent!stress!sensitivity!of!CpG!methylation!levels!in!the!UTR/promoters!of!IEGs!it!is!likely!that!the! psychological!stress!associated!with!the!injection!has!masked!the!effect!of!FS!in!the!vehicle>treated! groups.!
As!SAM!is!the!universal!methyl!donor,!we!checked!whether!FS!and!SAM!would!affect!histone! methylation!processes!within!the!IEG!gene!loci!under!study.!We!studied!histone!H3!methylation! changes!known!to!be!involved!in!either!gene!activity!(H3K4me3;!histone!H3!tri>methylated!at!lysine> 4))!or!gene!suppression!(H3K9me3,!H3K27me3).!Figure!S8!shows!that!SAM!and!FS!did!not!alter!these! methylated!histone!marks!within!the!c*Fos!UTR!and!the!Egr*1!gene!promoter.!
)
FS,increases)Dnmt3a,mRNA,expression,in,the,DG,
As!FS!in!conjunction!with!SAM!treatment!resulted!in!increased!DNA!methylation!at!specific!CpG!sites! in!the!c>Fos!and!Egr*1!genes,!we!investigated!the!effect!of!FS!on!mRNA!expression!of!several!
members!of!the%Dnmt!family,!as!possible!mediators!of!the!observed!increase!in!DNA!methylation,!as! well!as!mRNA!expression!of!Tet1,!a!key!enzyme!in!DNA!demethylation.!In!the!DG,!Dnmt3a%
expression!was!significantly!increased!immediately!after!the!15!min!FS!session!(Fig.!8A)!whereas!no! forced!swim!effect!on!Dnmt3a!expression!was!found!in!the!CA!regions!of!the!hippocampus!(Fig.!8B).! The!expression!of!Dnmt3b,!Dnmt1%and%Tet1!mRNA!remained!unchanged!after!FS!in!both!the!DG!and! CA!regions!(Fig.!S9).!!
!
Increased,association,of,Dnmt3a,with,the,c'Fos,UTR,and,Egr'1,gene,promoter,after,FS!
To!investigate!whether!the!increased!Dnmt3a!mRNA!results!in!increased!association!of!this!Dnmt! with!the!c*Fos!UTR!and!Egr*1!gene!promoter!regions,!we!conducted!ChIP!assays!for!Dnmt3a.!We!also! conducted!Dnmt3b!and!Tet1!ChIP!assays!to!check!whether!FS!might!induce!enrolment!of!(de>
Discussion!
!
A!sole!traumatic!event!has!long>term!implications!for!future!behavioral!responses!to!similar! incidents.!Here!we!show!that!the!DNA!methylation!status!at!the!c>Fos!and!Egr*1!gene!promoters,! specifically!in!sparsely!activated!DG!neurons,!plays!a!crucial!role!in!the!consolidation!of!immobility! behavior!after!FS.!The!stressful!event!evoked!the!demethylation!of!distinct!CpGs!within!the! promoter!and!UTR!of!these!IEGS.!Conversely,!elevation!of!methyl!donor!availability!led,!in!the! stressed!animals,!to!markedly!elevated!CpG!methylation,!inhibition!of!IEG!expression!and!impaired! immobility!behavior.!The!observed!changes!in!DNA!methylation!may!be!due!to!the!increased!
Dnmt3a!expression!and!the!increased!association!of!this!Dnmt!with!the!IEG!loci!in!these!DG!neurons.!!
!
FS!evoked!CpG>specific!demethylation!events!in!the!DG!but!not!in!the!hippocampal!CA!region.! Region>specific!active!DNA!demethylation!has!been!shown!to!play!a!role!in!activity>induced!gene! expression!in!DG!granule!neurons,!likely!mediated!by!Tet1!and/or!Gadd45b!(23-25).!Furthermore,! DNA!demethylation!in!the!DG!also!occurred!after!voluntary!running!(24).!Thus,!DG!neurons!have! been!found!to!be!rather!susceptible!to!DNA!methylation!changes!in!response!to!environmental! stimuli.!The!gene!expression!changes!in!the!DG!after!such!stimuli!are!known!to!occur!in!sparsely! distributed!neurons!(5,10,11)!suggesting!that!the!observed!DNA!demethylation!events!are!also! occurring!in!these!neurons.!!
!
the!methyl!donor!was!observed!on!IEGs!in!CA1!and!CA3!regions!of!the!hippocampus.!Furthermore,! there!was!no!effect!of!SAM!and!FS!on!histone!methylation!at!these!genes.!Previously,!we!have! shown!that!FS>induced!c>Fos!and!Egr>1!in!DG!neurons!are!critically!involved!in!the!consolidation!of! the!behavioral!immobility!response!(5).!The!neuroanatomically!selective!effect!of!SAM!further! underscores!the!importance!of!IEG!expression!in!DG!neurons!for!this!stress>induced!behavioral! response.!Furthermore,!the!induction!of!these!IEGs!in!DG!neurons!requires!the!formation!of!the!dual! histone!mark!H3S10p>K14ac!within!the!promoter!regions!of!these!genes.!The!formation!of!this! epigenetic!mark!is!the!result!of!concomitant!GR!and!NMDA>ERK>MSK1>Elk>1!signaling!in!these!DG! neurons!(5).!Clearly,!SAM!had!no!effect!on!the!formation!of!this!dual!histone!mark!indicating!that! the!methyl!donor!did!not!produce!its!effects!on!gene!expression!and!behavior!through!interference! with!these!signaling!pathways.!Therefore,!the!methyl!donor!appears!to!act!via!a!
methylation/demethylation!mechanism!down>stream!of!the!dual!histone!modifications.!
!
In!our!studies,!SAM!affected!DNA!methylation!only!under!stress!conditions.!Administration!of!SAM! before!FS!resulted!in!significant!increases!in!DNA!methylation!within!areas!of!the!c>Fos!5’>UTR!and!
Egr*1!promoter!in!the!DG!that!had!previously!shown!demethylation!after!the!stressor!only.!In!
Possibly,!the!mammalian!brain!also!has!a!mechanism!for!monitoring!SAM!levels!that!determines!the! neuronal!response!to!environmental!stimuli.!!
!
The!exact!mechanism!through!which!FS!in!the!presence!of!elevated!SAM!levels!inhibit!IEG!expression! still!needs!to!be!clarified.!Within!the!c>Fos!gene,!SAM>!and!stress>evoked!CpG!methylation!changes! occurred!mainly!within!Area!2,!which!is!located!down>stream!from!the!TSS!in!a!region!that!codes!for! the!5’!UTR!of!the!mRNA!molecule.!RNA>polymerase!II!and!associated!factors!assemble!upstream!of! the!TSS!and!produce!short!RNA!fragments;!however,!additional!mechanisms!are!required!before!full> length!transcripts!can!be!produced.!This!poised!state!of!gene!transcription!allows!a!rapid!induction! of!c>Fos!in!response!to!stimuli!(26).!The!CpGs!within!Area!2!of!the!c>Fos%gene!reside!within!the! window!of!elongation!termination,!which!is!between!+30!and!+60!bps!after!the!TSS!(27).!Therefore,! as!DNA!methylation!can!prevent!transcriptional!elongation!(28),!the!SAM!and!FS>induced!CpG! methylation!increases!may!result!in!premature!termination!of!the!c>Fos!transcript!in!the!DG! neurons.!Area!A!within!the!Egr*1%promoter!is!approximately!500!bps!upstream!from!the!TSS.! Increased!DNA!methylation!in!this!region!could!influence!transcription!factor!binding!and!disrupt! chromatin!remodeling!and/or!assembly!of!transcriptional!machinery.!For!instance,!in%silico!analysis! of!transcription!factor!binding!sites!presented!Sp1!(specificity!protein!1)!and!Klf9!(Krüppel>like!factor! 9)!sites!within!the!DNA!sequence!of!Area!A.!The!Klf9!gene!contains!glucocorticoid!response!elements! (GREs)!and!expression!is!induced!in!response!to!elevated!corticosterone!levels!(29),!which!are! known!to!occur!after!FS!(30).!Thus,!the!SAM!and!FS>induced!increases!in!CpG!methylation!in!this! region!of!the!Egr*1!gene!may!have!disrupted!Klf9>mediated!(and!possibly!Sp1>mediated)!
transcriptional!activation!but!confirmation!of!this!postulate!requires!further!investigation.!! !
FS!resulted!in!an!increased!expression!of!the!de%novo!DNA!methyltransferase!Dnmt3a!(but!not!
Dnmt3b,!Dnmt1%and%Tet1)!specifically!in!the!DG.!This!enhanced!expression!after!stress,!in!the!
UTR!and!Egr*1!gene!promoter!resulting!in!inhibition!of!gene!expression!and!impaired!behavioral! responses.!The!increased!recruitment!of!Dnmt3a!at!these!IEG!loci!after!FS!supports!this!notion;! however,!in!the!context!of!normal!SAM!levels!this!observation!appears!to!be!contradictory!as!FS! results!in!DNA!demethylation!at!the!IEG!loci!and!increased!expression!of!c>Fos!and!Egr>1.!
Observations!made!in%vitro!may!explain!this!apparent!paradox.!Dnmt3a!has!been!shown!to!function! as!a!DNA!demethylase!under!conditions!of!elevated!Ca2+!levels,!whereas!the!methyltransferase!
activity!was!reinstated!after!raising!SAM!levels!(31-33).!Induction!of!IEGs!in!DG!neurons!in%vivo! requires!the!opening!of!NMDA!receptors!allowing!a!sustained!rise!in!intracellular!Ca2+!levels!(11).!In! view!of!the!findings!of!Chen!et!al.!(33),!it!may!be!expected!that!the!risen!Ca2+!levels!favor!the!DNA! demethylase!activity!of!the!recruited!Dnmt3a!enzyme!resulting!in!the!demethylation!at!the!IEG!loci!
that!we!observed.!When!SAM!levels!were!elevated!in!our!study!apparently!the!enzyme!activity!of!
the!recruited!Dnmt3a!shifted!to!a!methyltransferase!activity!resulting!in!DNA!methylation!of!the!IEG!
loci.!Together,!these!data!suggest!that!the!DNA!methylation!status!is!not!only!governed!by!the!
recruitment!(and!expression!levels)!of!DNA!methylating/demethylating!enzymes!but!also!by!the!
concentration!of!SAM!and!other!physiological!factors!(e.g.!Ca2+).!!
!
!
Our!work!shows!that,!after!FS,!not!only!is!Dnmt3a!expression!increased!in!the!DG!but!so!is!its! association!with!IEG!loci;!nevertheless,!the!levels!of!SAM!determine!the!impact!on!IEG!induction!and! the!consolidation!of!the!behavioral!immobility!response.!Presently,!it!is!unknown!to!what!extent! SAM!levels!determine!responses!in!other!hippocampus>dependent!behavioral!models!like!Morris! water!maze!learning!and!contextual!fear!condition.!Our!results!indicate!that!the!neuronal!
concentration!of!SAM!is!a!key!factor!in!the!molecular!and!behavioral!responses!evoked!by! environmental!challenges.!This!notion!is!supported!by!work!in%vitro!which!demonstrates!that! inhibition!of!Dnmts!disrupts!hippocampal!neuron!function,!but!this!is!rescuable!by!elevating!SAM! levels!(37),!indicating!that!a!tightly!controlled!balance!between!Dnmt!activity!and!SAM!is!important! for!normal!hippocampal!neuron!function.!Accordingly,!it!seems!that!a!tight!control!of!SAM!synthesis! (and!Dnmt!function)!is!of!pivotal!physiological!importance.!!
!
In!summary,!the!induction!of!IEGs!in!DG!granule!neurons!is!highly!complex.!Neuronal!activation!due! to!stressful!stimuli!is!regulated!by!NMDA,!GABA>A!and!glucocorticoid!receptors,!ERK!MAPK!signaling,! H3S10p>K14ac!formation!(5,11,21),!and,!as!shown!in!the!present!study,!by!distinct!CpG!
methylation!events.!It!appears!that!IEG!induction!is!checked!by!multi>level!control!mechanisms! whereby!the!CpG!methylation!status!plays!a!go/no>go!role.!The!control!of!IEG!induction!in!DG! neurons!is!reflected!in!the!(long>term)!consolidation!of!the!behavioral!response!after!FS.!The! stressful!challenge!also!resulted!in!increased!expression!of!the!de%novo!methyltransferase!Dnmt3a,! which!may!act!as!a!DNA!demethylase!in!the!context!of!normal!SAM!levels!and!elevated!Ca2+!in!
in!the!responsiveness!of!DG!neurons!to!environmental!stimuli!with!significant!consequences!for!the! organism!in!terms!of!gene!expression!and!behavior.!!
!!!! !
!
!
Materials,and,Methods,
,
Animals,and,Drug,Treatment.!Male!Wistar!rats!(150>175!g)!were!purchased!form!Harlan!and!group!
housed.!Rats!were!forced!to!swim!for!15min!in!25!°C!water!or!left!undisturbed!(refs!11,!19!in!MGM).! Some!animals!received!pretreatment!with!a!drug!or!the!vehicle!30min!before!FS.!Rats!were!killed!at! the!indicated!times!(see!legends)!after!FS!or!were!kept!until!24h!later!to!undergo!another!FS!test! (retest)!for!5min.!Behavior!was!scored!every!10!s!during!the!first!5!min!of!the!test!and!retest.!The! drug!used!was!SAM!(100!mg/kg!body!weight)!to!raise!levels!of!the!endogenous!methyl!donor.!For! more!information,!see!SI%Materials%and%Methods.!
!
Tissue,preparation.!For!immunohistochemistry!rats!were!perfused!with!saline!and!4%!
paraformaldehyde!and!inhibitors.!Brains!were!cut!into!50>μm!coronal!sections!and!kept!at!4!°C.!For! other!studies,!after!decapitation!the!entire!hippocampus!was!dissected!or!the!DG!and!CA!regions! were!micro>dissected!from!the!dorsal!hippocampus!in!1>mm!coronal!brain!slices.!Tissues!were!snap! frozen!in!liquid!N2!and!stored!at!>80!°C.!For!more!information,!see!SI%Materials%and%Methods.!
!
Immunohistochemistry.
!Immunohistochemistry!was!conducted!using!published!methods!
(5).!For!more!information,!see!
SI%Materials%and%Methods
.!
!
Bisulfite,pyrosequencing.
!Genomic!DNA!from!DG!and!CA!regions!was!subjected!to!bisulfite!
conversion!and!pyrosequenced!as!described!in!the!
SI%Materials%and%Methods
.!!
ChIP,,RNA,analysis,and,qPCR.
!ChIP!and!RNA!extraction!was!performed!using!published!
methods!(7, 38, 39).!For!a!complete!description,!see!
SI%Materials%and%Methods
.!!
!
Statistical,analysis.
!Data!were!analysed!by!ANOVA,!Student’s!t>test!and!appropriate!post>
hoc!tests.!For!more!information,!see!
SI%Materials%and%Methods
.!!
!
!
Acknowledgments,
!
This!research!was!supported!by!grants!from!the!Biotechnology!and!Biological!Sciences!
Research!Council!(BBSRC),!Medical!Research!Council!(MRC)!and!the!British!Pharmacological!
References,
!
! 1.!! De!Kloet!ER,!Oitzl!MS,!&!Joels!M!(1999)!Stress!and!cognition:!are!corticosteroids!good!or!bad! guys?%Trends%Neurosci.%22(10):422>426.!
! 2.!! Caamano!CA,!Morano!MI,!&!Akil!H!(2001)!Corticosteroid!receptors:!a!dynamic!interplay! between!protein!folding!and!homeostatic!control.!Possible!implications!in!psychiatric! disorders.%Psychopharmacol.Bull.%35(1):6>23.!
! 3.!! Reul!JMHM!(2014)!Making!memories!of!stressful!events:!a!journey!along!epigenetic,!gene! transcription,!and!signaling!pathways.%Front%Psychiatry%5(:5.!
! 4.!! De!Kloet!ER,!De!Kock!S,!Schild!V,!&!Veldhuis!HD!(1988)!Antiglucocorticoid!RU!38486!attenuates! retention!of!a!behaviour!and!disinhibits!the!hypothalamic>pituitary!adrenal!axis!at!different! brain!sites.%Neuroendocrinology%47(:109>115.!
! 5.!! Gutierrez>Mecinas!M!et!al.!!(2011)!Long>lasting!behavioral!responses!to!stress!involve!a!direct! interaction!of!glucocorticoid!receptors!with!ERK1/2>MSK1>Elk>1!signaling.%
Proc.Natl.Acad.Sci.U.S.A%108(33):13806>13811.!
! 6.!! Chwang!WB,!O'Riordan!KJ,!Levenson!JM,!&!Sweatt!JD!(2006)!ERK/MAPK!regulates!
hippocampal!histone!phosphorylation!following!contextual!fear!conditioning.%Learn.Mem.% 13(3):322>328.!
! 7.!! Carter!SD,!Mifsud!KR,!&!Reul!JMHM!(2015)!Distinct!epigenetic!and!gene!expression!changes!in! rat!hippocampal!neurons!after!Morris!water!maze!training.%Front%Behav.Neurosci%9(:156.! ! 8.!! Oitzl!MS,!De!Kloet!ER,!Joels!M,!Schmid!W,!&!Cole!TJ!(1997)!Spatial!learning!deficits!in!mice!with!
a!targeted!glucocorticoid!receptor!gene!disruption.%Eur.J.Neurosci.%9(11):2284>2296.! ! 9.!! Jones!MW!et!al.!!(2001)!A!requirement!for!the!immediate!early!gene!Zif268!in!the!expression!
! 10.!! Bilang>Bleuel!A!et!al.!!(2005)!Psychological!stress!increases!histone!H3!phosphorylation!in!adult! dentate!gyrus!granule!neurons:!involvement!in!a!glucocorticoid!receptor>dependent! behavioural!response.%Eur.J.Neurosci.%22(7):1691>1700.!
! 11.!! Chandramohan!Y,!Droste!SK,!Arthur!JS,!&!Reul!JMHM!(2008)!The!forced!swimming>induced! behavioural!immobility!response!involves!histone!H3!phospho>acetylation!and!c>Fos! induction!in!dentate!gyrus!granule!neurons!via!activation!of!the!N>methyl>D>
aspartate/extracellular!signal>regulated!kinase/mitogen>!and!stress>activated!kinase! signalling!pathway.%Eur.J.Neurosci.%27(10):2701>2713.!
! 12.!! Liu!X!et!al.!!(2012)!Optogenetic!stimulation!of!a!hippocampal!engram!activates!fear!memory! recall.%Nature%484(7394):381>385.!
! 13.!! Hunter!RG,!McCarthy!KJ,!Milne!TA,!Pfaff!DW,!&!McEwen!BS!(2009)!Regulation!of!hippocampal! H3!histone!methylation!by!acute!and!chronic!stress.%Proc.Natl.Acad.Sci.U.S.A.!
! 14.!! Miller!CA!&!Sweatt!JD!(2007)!Covalent!modification!of!DNA!regulates!memory!formation.% Neuron%53(6):857>869.!
! 15.!! Feng!J!et!al.!!(2010)!Dnmt1!and!Dnmt3a!maintain!DNA!methylation!and!regulate!synaptic! function!in!adult!forebrain!neurons.%Nat.Neurosci.%
! 16.!! Gupta!S!et!al.!!(2010)!Histone!methylation!regulates!memory!formation.%J.Neurosci.% 30(10):3589>3599.!
! 17.!! Fleischmann!A!et!al.!!(2003)!Impaired!long>term!memory!and!NR2A>type!NMDA!receptor> dependent!synaptic!plasticity!in!mice!lacking!c>Fos!in!the!CNS.%J.Neurosci.%23(27):9116> 9122.!
! 18.!! Czyrak!A,!Rogoz!Z,!Skuza!G,!Zajaczkowski!W,!&!Maj!J!(1992)!Antidepressant!activity!of!S> adenosyl>L>methionine!in!mice!and!rats.%J.Basic%Clin.Physiol%Pharmacol.%3(1):1>17.!
methyl>d>aspartate!receptor!and!the!glucocorticoid!receptor:!relevance!for!c>fos!induction.% J.Neurochem.%101(3):815>828.!
! 20.!! Collins!A!et!al.!!(2009)!Exercise!improves!cognitive!responses!to!psychological!stress!through! enhancement!of!epigenetic!mechanisms!and!gene!expression!in!the!dentate!gyrus.%
PLoS.One%4(:e4330.!
! 21.!! Papadopoulos!A!et!al.!!(2010)!GABAergic!control!of!stress>responsive!epigenetic!and!gene! expression!mechanisms!in!the!dentate!gyrus.%Eur.Neuropsychopharmacol.%21(:316>324.! ! 22.!! Sutter!BM,!Wu!X,!Laxman!S,!&!Tu!BP!(2013)!Methionine!inhibits!autophagy!and!promotes!
growth!by!inducing!the!SAM>responsive!methylation!of!PP2A.%Cell%154(2):403>415.! ! 23.!! Ma!DK!et!al.!!(2009)!Neuronal!activity>induced!Gadd45b!promotes!epigenetic!DNA!
demethylation!and!adult!neurogenesis.%Science%323(5917):1074>1077.!
! 24.!! Guo!JU!et!al.!!(2011)!Neuronal!activity!modifies!the!DNA!methylation!landscape!in!the!adult! brain.%Nat.Neurosci.%
! 25.!! Guo!JU,!Su!Y,!Zhong!C,!Ming!GL,!&!Song!H!(2011)!Hydroxylation!of!5>methylcytosine!by!TET1! promotes!active!DNA!demethylation!in!the!adult!brain.%Cell%145(3):423>434.!
! 26.!! Fivaz!J,!Bassi!MC,!Pinaud!S,!&!Mirkovitch!J!(2000)!RNA!polymerase!II!promoter>proximal! pausing!upregulates!c>fos!gene!expression.%Gene%255(2):185>194.!
! 27.!! Levine!M!(2011)!Paused!RNA!polymerase!II!as!a!developmental!checkpoint.%Cell%145(4):502> 511.!
! 28.!! Rountree!MR!&!Selker!EU!(1997)!DNA!methylation!inhibits!elongation!but!not!initiation!of! transcription!in!Neurospora!crassa.%Genes%Dev.%11(18):2383>2395.!
! 29.!! Bagamasbad!P!et!al.!!(2012)!Molecular!basis!for!glucocorticoid!induction!of!the!Kruppel>like! factor!9!gene!in!hippocampal!neurons.%Endocrinology%153(11):5334>5345.!
! 31.!! Metivier!R!et!al.!!(2008)!Cyclical!DNA!methylation!of!a!transcriptionally!active!promoter.% Nature.%452(7183):45>50.!
! 32.!! Chen!CC,!Wang!KY,!&!Shen!CK!(2012)!The!mammalian!de!novo!DNA!methyltransferases! DNMT3A!and!DNMT3B!are!also!DNA!5>hydroxymethylcytosine!dehydroxymethylases.% J.Biol.Chem.%287(40):33116>33121.!
! 33.!! Chen!CC,!Wang!KY,!&!Shen!CK!(2013)!DNA!5>methylcytosine!demethylation!activities!of!the! mammalian!DNA!methyltransferases.%J.Biol.Chem.%288(13):9084>9091.!
! 34.!! Ling!Y!et!al.!!(2004)!Modification!of!de!novo!DNA!methyltransferase!3a!(Dnmt3a)!by!SUMO>1! modulates!its!interaction!with!histone!deacetylases!(HDACs)!and!its!capacity!to!repress! transcription.%Nucleic%Acids%Res.%32(2):598>610.!
! 35.!! Deplus!R!et!al.!!(2014)!Citrullination!of!DNMT3A!by!PADI4!regulates!its!stability!and!controls! DNA!methylation.%Nucleic%Acids%Res.%42(13):8285>8296.!
! 36.!! Feng!J,!Chang!H,!Li!E,!&!Fan!G!(2005)!Dynamic!expression!of!de!novo!DNA!methyltransferases! Dnmt3a!and!Dnmt3b!in!the!central!nervous!system.%J.Neurosci%Res.%79(6):734>746.! ! 37.!! Nelson!ED,!Kavalali!ET,!&!Monteggia!LM!(2008)!Activity>dependent!suppression!of!miniature!
neurotransmission!through!the!regulation!of!DNA!methylation.%J.Neurosci%28(2):395>406.! ! 38.!! Stock!JK!et!al.!!(2007)!Ring1>mediated!ubiquitination!of!H2A!restrains!poised!RNA!polymerase!
II!at!bivalent!genes!in!mouse!ES!cells.%Nat.Cell%Biol.%9(12):1428>1435.!
! 39.!! Chomczynski!P!&!Sacchi!N!(1987)!Single>step!method!of!RNA!isolation!by!acid!guanidinium! thiocyanate>phenol>chloroform!extraction.%Anal.Biochem.%162(1):156>159.!
! 40.!! Paxinos!G!&!Watson!C.!The!rat!brain!in!sterotaxic!coordinates.!2nd!Edition.!1986.!San!Diego,! California,!Academic!!Press!Inc.!!
! 42.!! Leyva>Illades!D,!Cherla!RP,!Galindo!CL,!Chopra!AK,!&!Tesh!VL!(2010)!Global!transcriptional! response!of!macrophage>like!THP>1!cells!to!Shiga!toxin!type!1.%Infect.Immun.%78(6):2454> 2465.!
! 43.!! Kent!WJ!(2002)!BLAT>>the!BLAST>like!alignment!tool.%Genome%Res.%12(4):656>664.! ! 44.!! Gibbs!RA!et!al.!!(2004)!Genome!sequence!of!the!Brown!Norway!rat!yields!insights!into!
mammalian!evolution.%Nature%428(6982):493>521.!
! 45.!! Egelhofer!TA!et!al.!!(2011)!An!assessment!of!histone>modification!antibody!quality.% Nat.Struct.Mol.Biol.%18(1):91>93.!
! 46.!! Pfaffl!MW!(2001)!A!new!mathematical!model!for!relative!quantification!in!real>time!RT>PCR.% Nucleic%Acids%Res.%29(9):e45.!
,
!
Figure,legends,
!
Figure,1.!The,effect,of,SAM,on,FS&induced,behaviour.!Rats!were!given!one!injection!of!vehicle!or!
SAM!(100!mg/kg,!s.c.)!30!min!before!FS!(15!min,!25°C)!and!24!hours!later!were!forced!to!swim!again! under!the!same!conditions.!The!graphs!show!the!climbing,!swimming!and!immobility!behaviour! scored!in!10!s!bins!during!the!first!5!min!of!the!initial!test!(A)!and!retest!(B).!Data!are!shown!as!the! mean!behavioral!score!(mean!±!SEM,!n!=!8>9).!*,!p!<!0.05!compared!with!the!respective!vehicle> treated!group;!&,!p!=!0.072!compared!with!the!respective!vehicle>treated!group.!!For!more!
information!on!statistical!analyses!in!Figures!1>7,!see!Supplemental!Statistics!Information.!!
!
Figure,2.!The,effect,of,SAM,on,FS&evoked,c&Fos,and,Egr&1,induction,in,the,DG.,Rats!were!given!one!
injection!of!vehicle!or!SAM!(100!mg/kg,!s.c.)!30!min!before!FS!(15!min,!25°C)!and!killed!60!min!after! the!start!of!the!challenge!(FS60).!The!baseline!(BL)!groups!were!killed!90!min!after!injection.!The! graphs!show!the!number!of!c>Fos+
!and!Egr>1+!neurons!in!the!whole!DG!within!a!50!µm!section!(A!and!
B!respectively).!Data!are!shown!as!the!average!number!of!c>Fos+!or!Egr>1+!neurons!from!three,!50!
μm>thick!coronal!brain!slices!per!animal!(mean!±!SEM,!n!=!5>6).!*,!p!<!0.05!compared!with!the! respective!BL!group;!$,!p!<!0.05!compared!with!the!respective!vehicle/FS60!group.!
!
Figure,3.!The,effect,of,SAM,on,H3S10p&K14ac,formation,in,the,DG,after,FS.,Rats!were!given!one!
injection!of!vehicle!or!SAM!(100!mg/kg,!s.c.)!30!min!before!FS!(15!min,!25°C)!and!killed!at!FS60.!The! BL!groups!were!killed!90!min!after!the!injection.!The!graphs!show!the!number!of!H3S10p>K14ac+!
neurons!in!the!DG.!Data!are!shown!as!an!average!number!of!H3S10p>K14ac+!neurons!from!three,!50!
!
Figure,4.,FS&induced,CpG&specific,DNA,methylation,changes,in,the,c&Fos,promoter,region.,Rats! were!killed!immediately!(BL!group)!or!subjected!to!FS!(15!min,!25°C)!and!killed!at!FS60.!The!location! of!CpGs!within!Areas!1!and!2!with!respect!to!the!rat!c>Fos!gene!are!shown!in!Fig.!S5.!The!graphs! show!DNA!methylation!changes!at!CpGs!in!Area!1!and!Area!2!in!the!DG!(C).!Data!are!shown!as! percentage!methylation!(mean!±!SEM,!n!=!3>6).!*,!p!<!0.05;!&,!p!<!0.1,!compared!with!the!respective! BL!group!
!
Figure,5.,FS&induced,CpG&specific,DNA,methylation,changes,in,the,Egr'1,promoter,region.,Rats! were!killed!immediately!(BL!group)!or!subjected!to!FS!(15!min,!25°C)!and!killed!at!FS60.!The!location! of!CpGs!within!Areas!A!and!B!with!respect!to!the!rat!Egr*1!gene!are!shown!in!Fig.!S6.!The!graphs! show!DNA!methylation!changes!at!CpGs!in!Area!A!and!Area!B!in!the!DG.!Data!are!shown!as!
percentage!methylation!(mean!±!SEM,!n!=!5>6).,*,!p!<!0.05;!&,!p!<!0.1,!compared!with!the!respective! BL!group,
!
Figure,6.,The,effect,of,SAM,treatment,on,FS&induced,DNA,methylation,changes,at,CpGs,within,the,
c&Fos,UTR,in,the,DG.,Rats!were!given!one!injection!of!vehicle!or!SAM!(100!mg/kg,!s.c.)!30!min!before! FS!(15!min,!25°C)!and!killed!at!FS60.!The!BL!groups!were!killed!90!min!after!the!injection.!The!graph! shows!methylation!of!CpGs!in!Area!2!of!the!c>Fos%UTR!in!the!DG.!Data!are!shown!as!percentage! methylation!(mean!±!SEM,!n!=!4>6).!*,!p!<!0.05!compared!with!the!respective!vehicle/FS60!group;!$,!p!
<!0.05!compared!with!the!respective!SAM/BL!group;!+,!p!=!0.076!compared!with!the!respective!
SAM/BL!group;!&,!p!=!0.076!compared!with!the!respective!vehicle/FS60!group!
Figure,7.,The,effect,of,SAM,treatment,on,FS&induced,DNA,methylation,changes,at,CpGs,within,the,
Egr'1,gene,promoter,in,the,DG.,Rats!were!given!one!injection!of!vehicle!or!SAM!(100!mg/kg,!s.c.)!30! min!before!FS!(15!min,!25°C)!and!killed!at!FS60.!The!BL!groups!were!killed!90!min!after!the!injection.! The!location!of!CpGs!within!Area!A!with!respect!to!the!Egr*1!gene!is!shown!in!Fig.!S6.!The!graph! shows!methylation!of!CpGs!in!Area!A!of!the!Egr*1%gene!promoter!in!the!DG.!Data!are!shown!as! percentage!methylation!(mean!±!SEM,!n!=!4>6).!*,!p!<!0.05!compared!with!the!respective! vehicle/FS60!group;!$,!p!<!0.05!compared!with!the!respective!SAM/BL!group.!
!
Figure,8.,Effect,of,FS,on,Dnmt3a,mRNA,expression,in,the,DG,and,CA,regions,of,the,hippocampus., Rats!were!killed!immediately!(BL!group)!or!subjected!to!FS!(15!min,!25°C)!and!killed!immediately! (FS15),!30!min!(FS30),!60!min!(FS60)!or!180!min!(FS180)!after!the!start!of!the!challenge.!The!graphs! show!Dnmt3a%mRNA!expression!in!the!DG!(A)!and!the!CA!regions!(B)!of!the!hippocampus.!Data!are! shown!as!relative!mRNA!copy!number!standardised!to!the!expression!of!the!house!keeping!genes! Hprt1!and!Ywhaz!(mean!±!SEM,!n!=!8>9).!Statistical!analysis:!one>way!ANOVA;!(A)!F(5,38)!=!3.0,!p!<!
0.05.!(B)!F(5,39)!=!0.97,!p!=!0.43.!Dunnett’s!post>hoc!test:!*,!p!<!0.05!compared!with!the!BL!group.!
!
Figure,9.,Association,of,Dnmt3a,,Dnmt1,and,Tet1,with,c&Fos,and,Egr&1,gene,loci,after,FS.,Rats!were!
killed!under!baseline!conditions!or!at!60!min!after!the!start!of!a!15min!FS!session!(FS60).!ChIP!for! Dnmt3a,!Dnmt3b!and!Tet1!was!conducted!on!hippocampus!tissue!followed!by!qPCR!for!the!c>Fos!(A)! and!Egr>1!(B)!loci!studied!for!DNA!methylation!changes!after!SAM!and!FS.!Data!are!expressed!as!the! enrichment!of!the!respective!enzymes!at!the!loci!at!FS60!relative!to!that!in!the!baseline!situation! (mean!±!SEM,!n!=!4).!*,!P!<!0.01,!Student’s!t>test!
SI Manuscript file
1. SI Materials and Methods: Page 2‐10
2. SI Figure legends: Page 11‐15
(Legends to the SI Figures 1‐9)
3. SI Statistics Information: Pages 16‐18
(Extra information (e.g. ANOVA results) on the statistical analyses conducted on the data in the main
manuscript figures 1‐7)
1. SI Materials and Methods
Animals
Male Wistar rats (150‐175 g; purchased from Harlan (Oxon, UK)) were group housed (two to three
animals per cage) under standard lighting (80‐100 Lux; 14:10 light‐dark cycle; lights on 05:00) and
environmentally controlled conditions (temperature 22 ± 1 °C; relative humidity 50 ± 10%) with food
and water available ad libitum. All rats were handled for at least 5 days (3 min/rat/day) before the
day of the experiment to reduce non‐specific stress. All procedures were approved by the University
of Bristol Ethical Committee and by the Home Office of the United Kingdom (UK Animal Scientific
Procedures Act 1986).
Drug Treatment
S‐adenosyl methionine (SAM; Abbott Laboratories, Maidenhead, UK; 100 mg/kg) was dissolved in
sterile pyrogen‐free phosphate‐buffered saline (PBS) and injected subcutaneously (s.c.). The dose of
the drug was based on a previous study (18). Control animals received a vehicle injection (1 ml/kg,
sterile pyrogen‐free PBS). The injection was given 30 min before the start of the initial forced swim
session. Unless otherwise stated, drugs and chemicals were purchased from Sigma‐Aldrich (Poole,
UK).
Animal Experimentation
Animal experimentation was conducted between 08:00‐13:00. Rats were forced to swim for 15 min
in individual glass beakers (height 35 cm, diameter 21.7 cm) containing water 21 ± 2 cm deep at 25
°C or were left undisturbed in their home cage. For experiments involving SAM treatment, animals
were given a single s.c. injection of SAM or vehicle 30 min before forced swimming and were killed
either at 1 hour after the start of forced swimming or were subjected to a second forced swim
killed at the corresponding time after injection. For experiments without drug treatment, animals
were killed at indicated times (see figure legends) after forced swimming.
Behavioral Scoring
Behavior in the forced swim test and retest was digitally recorded and scored in a blind fashion, as
previously described (5, 11). Behavior (immobility, climbing or swimming) was scored every 10
seconds during the first 5 min of the test and retest, resulting in 30 data bins.
Immunohistochemistry
Brain tissue for immunohistochemistry was collected from rats that were deeply anesthetized with
pentobarbital (1 ml/kg) and trans‐cardially perfused with ice‐cold saline (0.9% w/v sodium chloride
(NaCl)) followed by ice‐cold buffered formaldehyde solution (4% w/v, 0.195% w/v picric acid, 50 mM
sodium fluoride (NaF), 1 mM sodium orthovanadate (Na3VO4), 0.1 M phosphate buffer (PB, pH 7.4)).
Whole brains were removed and transferred to PB (0.1 M, 50 mM NaF, 1 mM Na3VO4, 0.05% w/v
sodium azide (NaN3), pH 7.4) before being cut into 50 µm‐thick coronal sections using a vibratome
(VT 1000S; Leica, Milton Keynes, UK), and stored at 4 °C until use.
Three brain sections containing the dorsal hippocampus were randomly chosen per animal (between
‐2.92 mm and ‐3.96 mm from Bregma; Paxinos and Watson rat brain atlas (40). As described
previously (SI4), the avidin‐biotin‐immuno‐peroxidase (ABC) method was used to detect H3S10p‐
K14ac, c‐Fos and Egr‐1 immunopositive neurons. All solutions contained 0.1 M PB pH 7.4; brain
sections were carefully rinsed between each step with 0.1 M PB and all steps were performed at
room temperature.
After incubation in blocking solution (2% w/v bovine serum albumin (BSA), 50 mM glycine, 0.2% v/v
with one of the following: polyclonal rabbit anti‐ (pRbα) H3S10p (previous work has shown that in
hippocampal neurons the H3S10p mark is actually part of the combinatorial H3S10p‐K14ac mark (10, 19); 1:300 v/v), pRbα c‐Fos (1:10,000 v/v) both from Merck Millipore (Nottingham, UK), pRbα
Egr‐1 (1:1000 v/v; Cell Signalling Technology, MA, USA). The antibody was diluted in incubating
solution (0.8% w/v BSA, 0.1% v/v Triton X‐100, 0.5% w/v NaN3, 50 mM NaF, 1 mM Na3VO4, 0.1 M PB).
All antibodies have been used by us and others in multiple studies (5, 11, 19, 41, 42).
Next, sections were incubated with biotinylated goat αRb IgG (1:350; Vector Laboratories,
Peterborough, UK) and in avidin‐biotinylated horseradish peroxidase complex (1:350; Vector
Laboratories, Peterborough, UK). After incubation with 3,3’‐diaminobenzidine tetrahydrochloride
(DAB 0.8 nM, 7.5 mM ammonium chloride, 0.01% v/v nickel chloride, 0.1 M PB) the peroxidase
reaction was initiated upon addition of hydrogen peroxide to a final concentration of 0.003% w/v.
Sections were mounted on poly‐L‐lysine coated slides, dehydrated and cover slipped.
H3S10p‐K14ac, c‐Fos and Egr‐1 immunopositive granule neurons in the dentate gyrus and Egr‐1 and
c‐Fos immunopositive pyramidal neurons in the CA1 and CA3 were counted in a blind fashion using a
light microscope (Leica, Milton Keynes, UK). For each animal the positively stained neurons in three
brain sections were counted and averaged. The immunopositive granule neurons in the dentate
gyrus were counted discriminating between the dorsal and ventral blade. Data are expressed as the
mean (± SEM) number of immunopositive neurons per dentate gyrus, CA1 or CA3 in a 50 µm‐thick
brain section per animal.
Bisulfite Pyrosequencing
For bisulfite pyrosequencing studies and RNA analysis (see below), rats were rapidly anesthetized
using isoflurane vapor (< 15 s; Meriam Animal Health Ltd., UK) and decapitated. Next, the brain was
removed and immediately cut into 1 mm coronal slices using an ice‐cold brain matrix and the slices
UK) the dentate gyrus and the hippocampal CA regions (CA1‐3) were micro‐dissected from the dorsal
hippocampus region and collected in separate tubes on dry ice and stored at ‐80 °C.
Dentate gyrus and hippocampal CA regions tissue was lysed in 10 volumes of lysis buffer (0.5% w/v
SDS, 0.1 M EDTA, 10 mM Tris HCl pH 8.0), before incubation with RNase A (0.05 µg/µl) and
proteinase K (0.25 µg/µl). Genomic DNA was purified using a standard phenol‐chloroform method
and precipitated. Genomic DNA from dentate gyrus and hippocampal CA regions were subjected to
bisulfite conversion in duplicate using the EZ DNA methylation kit (Zymo Research, CA, USA)
following the manufacturer’s instructions. Fully methylated and unmethylated rat DNA controls
(EpigenDx, MA, USA) were included along with negative water controls in all experimental steps.
The UCSC Genome Browser and BLAT alignment tool (43, 44) were used to identify locations of
interest within the c‐Fos and Egr‐1 genes. Two areas surrounding each gene were selected for
primer design, a region within the CpG island located upstream of the transcriptional start site (TSS),
and within the region coding for the 5’ untranslated region of the mRNA. PCR and sequencing
primers were designed using PyroMarkAssayDesign2.0 (Qiagen). Sequences were as follows: c‐Fos
Area 1, forward primer Bt‐GTAGAGTTGATGATAGGGAGTT, reverse primer
ACTCTATCCAATCTTCTCAATTAC, sequencing primer CTATCCAATCTTCTCAATTACTAA. c‐Fos Area 2,
forward primer GTAGTTAGTAATTGAGAAGATTGGATAGA, reverse primer Bt‐
CCAAAAATAAACACTAATAAAAACTAC, sequencing primer TGAGAAGATTGGATAGAG.
Egr‐1 Area A,
forward primer GGGTTTGGGTTTTTTTAGTTTAG, reverse primer Bt‐CCCTCCCCCTCCTTAATT,
sequencing primer TTTGGGTTTTTTTAGTTTAGT. Egr‐1 Area B, forward primer
GTTAGTTTGGGGGTTTATTTATATTTT, reverse primer Bt‐TCAACAACATCATCTCCTCCAATTTA,
sequencing primer GTTTATTATTTAATATTAGT.
Bisulfite‐treated DNA was added to a mastermix (1x reaction buffer, 25 mM MgCl2, 0.5 units HotStar
Taq (Qiagen, Manchester, UK) 200 nM of each deoxynucleoside triphosphate (dNTP; Fisher
Scientific, Loughborough, UK), 0.25 µM forward and reverse primers) and amplified in duplicate
using a thermo cycler (T‐100, Biorad, UK). Following purification, DNA methylation was quantified by
pyrosequencing using the PyromarkQ24 Pyrosequencer (Qiagen, USA) according to the standard
manufacturer’s protocol. The data show the mean (± SEM) percentage of DNA methylation for each
CpG site per experimental group.
Chromatin preparation and ChIP
For chromatin immuno‐precipitation (ChIP), rats were rapidly anaesthetised using isoflurane vapor
(< 15 s; Meriam Animal Health Ltd., UK) before decapitation and removal of brains for dissection and
processing. To prepare tissue for ChIP, the whole hippocampus was dissected on ice‐cold steel
boxes. Tissue was quickly chopped into ~1 mm3 pieces before cross‐linking. All solutions used during
cross‐linking procedure contained the following inhibitors: 50 mM NaF, 1 mM Na2VO4, 5 ng/ml
aprotinin, 0.1 mM PMSF (phenylmethanesulfonylfluoride), 5 mM NaBut (sodium butyrate; Merck
Millipore, Nottingham, UK). Tissue was cross‐linked in formaldehyde (1% w/v, PBS pH 7.4) for 10 min
at room temperature before quenching with glycine at a final concentration of 125 mM. After two
washes with ice‐cold PBS the tissue was transferred into storage buffer (10 mM Hepes, 10 mM KCl,
1.5 mM MgCl2 (magnesium chloride), 0.1 mM EGTA (ethylene glycol tetra‐acetic acid), 0.5 mM DTT
(dithiothreitol) pH 7.9), snap‐frozen in dry ice and stored at ‐80 °C.
For the preparation of chromatin, if solutions are stated to contain inhibitors, these were as follows:
50 mM NaF, 1 mM Na2VO4, 5 ng/ml aprotinin, 0.1 mM PMSF, 5 mM NaBut (Merck Millipore,
and phosphatase inhibitor cocktail tablet (1 per 10 ml, Roche, Burgess Hill, UK). Buffers were kept
ice‐cold with the exception of the sonication buffer.
Cross‐linked hippocampal tissue was homogenised in ice‐cold homogenisation buffer (10 mM Hepes,
10 mM KCl, 1.5 mM MgCl2, 0.1 mM EGTA, 0.5 mM DTT, with inhibitors, pH 7.9). After centrifuging
(6,000 g, 4 °C, 5 min) the supernatant was discarded and the pellet resuspended in lysis buffer (0.25
M sucrose, 0.5% v/v Igepal, 100 mM NaCl, 6 mM MgCl2, 0.5 mM DTT, 1 mM EGTA, 50 mM Tris,
inhibitors, pH 8.0) and incubated on ice. The samples were mechanically lysed using a 25 gauge
needle (Becton, Dickinson and Company, New Jersey, USA). After centrifugation (2,000 g, 4 °C,
5 min) the top two layers were discarded leaving the pellet, which was resuspended in
homogenisation buffer and layered onto a sucrose cushion (1.2 M sucrose, 100 mM NaCl, 6 mM
MgCl2, 1 mM EGTA, 50 mM Tris, 0.5 mM DTT, inhibitors, pH 8.0) before centrifugation (10,000 g, 4
°C, 30 min). The remaining sample on top of the sucrose cushion was placed on a second cushion
and the centrifugation step repeated. The pellet was resuspended in sonication buffer (1% w/v SDS,
10 mM EDTA, 50 mM Tris, inhibitors, pH 8.0) and sonicated using a water‐cooled (4°C) Bioruptor
(UCD‐300; Diagenode, Liège, Belgium) for 10 cycles (high power, 30 seconds on, 60 seconds off).
Samples were removed from the Bioruptor, briefly vortexed and sonicated for a further 10 cycles.
Small aliquots of all samples were run on an agarose gel to confirm chromatin was sheared to 1‐4
nucleosomes in size (~150‐600 bps).
ChIP was performed using the method of Stock et al. (38) with modifications. 20 µl of chromatin
was diluted in 180 µl of water to be used as the input. For IP, 150 µg of chromatin was mixed with
dilution buffer (50 mM NaCl, 1 mM EDTA, 10 mM Tris, inhibitors, pH 7.4) to a final volume of 1 ml.
One of the following antibodies was added to the chromatin mixture: mRbα H3K4me3, pRbα
H3K9me3, pRbα H3K27me3 (1:50 v/v; Merck Millipore, Nottingham, UK; these antibodies were
the samples rolled overnight at 4 °C. Next, the chromatin/Ab mix was incubated with pre‐blocked
protein A‐coated magnetic beads (30 mg/ml; Life Technologies, Paisley, UK) for 3 hours at 4 °C.
Beads were collected using a magnetic rack (New England Biolabs, Hitchin, UK) and washed several
times to reduce non‐specific binding: 2 x wash buffer 1 (0.1% w/v SDS, 1% v/v Triton X‐100, 2 mM
EDTA, 150 mM NaCl, 20 mM Tris pH 8.0), 2 x wash buffer 2 (0.1% w/v SDS, 1% v/v Triton X‐100, 2
mM EDTA, 500 mM NaCl, 20 mM Tris pH 8.0), 1 x wash buffer 3 (1 mM EDTA, 150 mM LiCl, 0.5% v/v
Igepal, 0.5% w/v sodium deoxycholate, 20 mM Tris pH 8.0) and finally 2 x TE buffer (1 mM EDTA,
10 mM Tris pH 8.0). The pellets were incubated with elution buffer 1 (1.5% w/v SDS, 50 mM NaCl, 10
mM Tris pH 7.4) followed by a second incubation with elution buffer 2 (0.5% w/v SDS, 50 mM NaCl,
10 mM Tris pH 7.4) after which the supernatants (i.e. the bound fractions) were pooled. NaCl was
added to all samples to a final concentration of 150 mM before heating overnight at 65°C to reverse
the cross‐links.
The bound and input fractions were sequentially incubated with RNase A and proteinase K. Next, the
DNA was purified using the phenol‐chloroform method. To precipitate the DNA, glycogen was added
to a final concentration of 0.1 µg/µl as a co‐precipitant before addition of 1/10th the volume of
sodium acetate (3 M, pH 5.2) and 3 volumes of ice‐cold ethanol (EtOH; 100%), then samples were
stored at ‐20 °C overnight. Next, the DNA pellets from the bound and input samples were collected
and washed (70% EtOH) before being resuspended in nuclease‐free water and quantified using a
Qubit 2.0 Fluorometer (Life Technologies, Paisley, UK).
The Dnmt3a, Dnmt3b and Tet1 ChIP were conducted using a slightly different protocol, which was
published recently (7). The following ChIP‐grade antibodies were used: pRbα Tet1 (1:200 v/v;
Merck Millipore), pRbα Dnmt3a (1:200 v/v; Abcam), and mMsα Dnmt3b (1:200 v/v; Abcam).
Bound DNA and input DNA were subjected to quantitative polymerase chain reaction (qPCR) using a
StepOnePlus machine (Life Technologies, Paisley, UK) and each sample was run in triplicate. DNA
mastermix (Life Technologies, Paisley, UK), nuclease‐free water)). Primers and probe sequences
were as follows: c‐Fos, forward primer CGCTCATGACGTAGTAAGCCATT, probe 6FAM‐
CGGCCAGCTGAGGCGCCTACT‐TAMRA, reverse primer CTGCAATCGCGGTTGGA. Egr‐1, forward primer
GACCCGGAAACACCATATAAGG, probe 6FAM‐AAGGATCCCCCGCCGGAACAG‐TAMRA, reverse primer
AAGGCGCTGCCCAAATAAG.
A standard curve was constructed for each amplicon using whole rat brain genomic DNA (100 ng/µl;
BioChain, CA, USA), and run in parallel. The amount of target DNA in the bound and input fractions
was calculated by comparing the Ct (cycle threshold) values of these samples to the standard curve.
The data are expressed as the ratio of [bound fraction / (input fraction / 20)] and the mean (± SEM)
was calculated.
RNA analysis
RNA extraction from dentate gyrus and rest of hippocampus tissue was performed using the
guanidinium thiocyanate‐phenol‐chloroform (TRI) extraction method (39). Tissue was homogenized
in TRI reagent and and centrifuged (12,000 g, 10 min, 4 °C) to remove insoluble material. The
supernatant was removed and samples were allowed to stand at room temperature for 15 min.
Then, 1‐bromo‐3‐chloropropane was added and the sample shaken vigorously. Next, the samples
were centrifuged (12,000 g, 15 min, 4 °C) and the upper phase (RNA) removed. After adding
2‐propanol and centrifuging (12,000 g, RTP) the pellet was washed and resuspended in nuclease‐free
water (Life Technologies, Paisley, UK) before quantification using a NanoPhotometer P300 (Implen,
München, Germany). The RNA integrity was checked using a Bioanalyser (Agilent Technologies, CA,
USA). RNA was converted to cDNA using a thermo cycler (T‐100, Biorad, UK) and a reverse
transcription kit (QuantiTect Reverse Transcription Kit, Qiagen, Manchester, UK) according to the
For qPCR, 2 µl of cDNA was used per reaction in 18 µl of mastermix (900 nM forward and reverse
primers, 200 nM probe, 1X TaqMan fast mastermix (Life Technologies, Paisley, UK), nuclease‐free
water) using a StepOnePlus machine (Life Technologies, Paisley, UK). Primers and probe as follows: Dnmt1, forward primer CAAAGCAAGTGCAATCCCAAA, probe 6FAM‐CAACCCGCCACAGTGCCCTGAG‐
TAMRA, reverse primer TCAGGTCAGGGTCATCTAGGTACTG. Dnmt3a, forward primer
AAGGTCAAGGAGATCATTGATGAAC, probe 6FAM‐TGCGCCAGAAGTGCCGAAACATC‐TAMRA, reverse
primer CATTGAGGCTCCCACATGAGAT. Dnmt3b, forward primer CCTGGCATGTAACCCAGTGA, probe
6FAM‐TCGACGCCATCAAGGTTTCTGCTG‐TAMRA, reverse primer GGCCTGTTCATTCCAGGTAGAT. For
Tet1 mRNA, the AB Taqman gene expression assay Rn01428192 was used.
At least 3 standard curves were run for each primer pair and the average qPCR efficiency was
calculated using the equation: E = (10‐1/slope) – 1) x 100 (where E is qPCR efficiency and the slope is
the gradient of the standard curve). The relative mRNA expression ratio was calculated using the
Pfaffl method of relative quantification (46) and standardized to the housekeeping genes Hprt1 and
Ywhaz. The data was normalized to the baseline group and shown as the mean (± SEM) relative
mRNA expression.
Statistical Analysis
The data was statistically analyzed using analysis of variance (ANOVA) and, and in case of a
significant main effect, differences between individual groups were evaluated with appropriate post‐
hoc tests, adjusting the level of significance according to the Bonferroni procedure to reduce the
probability of a type 1 error. Some data were analyzed using Student’s t‐test. Results shown are
mean ± SEM, with p<0.05 considered statistically significant.
2. SI Figure Legends
Figure S1. Representative images of c‐Fos immuno‐staining in the dentate gyrus of SAM‐treated,
forced swim‐challenged rats. Rats were s.c. injected with vehicle or SAM (100mg/kg) and either
killed under baseline conditions (‘Control’) or 60 min after start of a 15‐min forced swim (FS)
challenge. (a‐d) show representative images of the four treatment conditions with low‐magnification
images shown at the left side and, on the right side, higher magnification images of the indicated
rectangles depicted in the respective left‐sided images. The black arrows indicate examples of
positively stained dentate gyrus neuronal nuclei. GCL, granular cell layer
Figure S2. The effect of SAM on forced swimming‐evoked c‐Fos and Egr‐1 induction in the dentate
gyrus. Rats were given one injection of vehicle or SAM (100 mg/kg, s.c.) 30 min before forced
swimming (15 min, 25°C) and killed 60 min after the start of the challenge (FS60). The baseline (BL)
groups were killed 90 min after injection. The graphs show the number of c‐Fos+ and Egr‐1+ neurons
split between the dorsal and the ventral blade (A and B, respectively). Representative images of c‐
Fos+ (C) and Egr‐1+ (D) neurons in the dorsal blade of the dentate gyrus under baseline (BL) or stress
conditions (FS60)) are shown. ML; molecular layer, GCL; granular cell layer, H; hilus. Data in A‐B are
shown as the average number of c‐Fos+ or Egr‐1+ neurons from three, 50 μm‐thick coronal brain
slices per animal (mean ± SEM, n = 5‐6). (A) Three‐way ANOVA; effect of SAM: F(1,36) = 19, p < 0.0001;
effect of stress: F(1,36) = 130, p < 0.0001; effect of location: F(1,36) = 600, p < 0.0001; interaction SAM x
stress: F(1,36) = 34, p < 0.0001; interaction of SAM x location: F(1,36) = 15, p < 0.0001; interaction stress x
location: F(1,36) = 80, p < 0.0001; interaction SAM x stress x location: F(1,36) = 14, p < 0.01. (B) Three‐
way ANOVA; effect of SAM: F(1,36) = 9.4, p < 0.01; effect of stress: F(1,36) = 6.3, p < 0.05; effect of
location: F(1,36) = 170, p < 0.0001; interaction SAM x stress: F(1,36) = 8.1, p < 0.01; interaction of SAM x
compared with the respective BL group; $, p < 0.05 compared with the respective vehicle/FS60
group; #, p < 0.05 compared with the respective ventral blade group
Figure S3. The effect of SAM on forced swimming‐induced c‐Fos and Egr‐1 induction in the CA1 and
CA3. Rats were given one injection of vehicle or SAM (100 mg/kg, s.c.) 30 min before forced
swimming (15 min, 25°C) and killed 60 min after the start of the challenge (FS60). The baseline (BL)
groups were killed 90 min after the injection. The graphs show the number of c‐Fos+ and Egr‐1+
neurons in the CA1 (A and B, respectively) and the CA3 (C and D, respectively). Data are shown as an
average number of c‐Fos+ or Egr‐1+ neurons from two, 50 μm‐thick coronal brain slices per animal
(mean ± SEM, n = 3‐4). Statistical analysis: two‐way ANOVA; (A) effect of SAM: F(1,12) = 0.91, p = 0.36;
effect of stress: F(1,12) = 43, p < 0.0001; interaction SAM x stress: F(1,12) = 1.1, p = 0.31. (B) Effect of
SAM: F(1,12) = 0.24, p = 0.63; effect of stress: F(1,12) = 5.1, p < 0.05; interaction SAM x stress: F(1,12) =
0.12, p = 0.73. (C) Effect of SAM: F(1,11) = 0.61, p = 0.45; effect of Stress: F(1,11) = 1.6, p = 0.23;
interaction SAM x stress: F(1,11) = 0.042, p = 0.84. (D) Effect of SAM: F(1,14) = 0.082, p = 0.78; effect of
stress: F(1,14) = 2.6, p = 0.13; interaction SAM x stress: F(1,14) = 0.34, p = 0.57. Bonferroni‐corrected
post‐hoc test with contrasts: *, p < 0.05 compared with the respective BL group
Figure S4. The effect of SAM on H3S10p‐K14ac formation in the dentate gyrus after forced
swimming. Rats were given one injection of vehicle or SAM (100 mg/kg, s.c.) 30 min before forced
swimming (15 min, 25°C) and killed at FS60. The BL groups were killed 90 min after the injection. The
graphs show the number of H3S10p‐K14ac+ neurons split between the dorsal and the ventral blade
(A). Representative images of H3S10p‐K14ac+ (B) neurons in the dorsal blade of the dentate gyrus
under baseline (BL) or stress conditions (FS60) are shown. ML; molecular layer, GCL; granular cell
SAM: F(1,32) = 0.33, p = 0.57; effect of stress: F(1,32) = 28, p < 0.0001; effect of location: F(1,32) = 50, p <
0.0001; interaction SAM x stress: F(1,32) = 0.0049, p = 0.95; interaction of SAM x location: F(1,32) = 0.22,
p = 0.65; interaction stress x location: F(1,32) = 11, p < 0.01; interaction SAM x stress x location: F(1,32) =
0.053, p = 0.82. Bonferroni‐corrected post‐hoc test with contrasts: *, p < 0.05 compared with the
respective BL group; #, p < 0.05 compared with the respective ventral blade group
Figure S5. Forced swimming‐induced CpG‐specific DNA methylation changes in the c‐Fos promoter
region in the CA regions of the hippocampus. Rats were killed immediately (BL group) or subjected
to forced swimming (15 min, 25°C) and killed at FS60. The location of CpGs within Areas 1 and 2 with
respect to the rat c‐Fos gene are shown in (A). The graph shows DNA methylation changes at CpGs in
Area 1 and Area 2 in the CA regions of the dorsal hippocampus (B). Data are shown as percentage
methylation (mean ± SEM, n = 3‐6). (B) Area 1; effect of CpG number: F(6,54) = 28, p < 0.0001; effect of
stress: F(1,54) = 0.030, p = 0.87; interaction CpG number x stress: F(6,54) = 0.44, p = 0.85. Area 2; effect
of CpG number: F(6,60) = 43, p < 0.0001; effect of stress: F(1,60) = 0.73, p = 0.41; interaction CpG number
x stress: F(6,60) = 1.2, p = 0.30. Student’s t‐test: *, p < 0.05; &, p < 0.1, compared with the respective BL
group
Figure S6. Forced swimming‐induced CpG‐specific DNA methylation changes in the Egr‐1 promoter
region in the CA regions of the hippocampus. Rats were killed immediately (BL group) or subjected
to forced swimming (15 min, 25°C) and killed at FS60. The location of CpGs within Areas A and B with
respect to the rat Egr‐1 gene is shown in (A). The graphs show DNA methylation changes at CpGs in
Area A and Area B in the CA regions of the dorsal hippocampus (B). Data are shown as percentage
methylation (mean ± SEM, n = 5‐6). *, p < 0.05; &, p < 0.1, compared with the respective BL group.
Statistical analysis: two‐way ANOVA with repeated measures; (B) Area A; effect of CpG number:
2.0, p = 0.20; interaction CpG number x stress: F(7,56) = 1.6, p = 0.16. Student’s t‐test: *, p < 0.05; &, p
< 0.1, compared with the respective BL group
Figure S7. The effect of SAM treatment and forced swimming on CpG methylation in the c‐Fos UTR
and Egr‐1 gene promoter in the CA regions of the hippocampus. Rats were given one injection of
vehicle or SAM (100 mg/kg, s.c.) 30 min before forced swimming (15 min, 25°C) and killed at FS60.
The BL groups were killed 90 min after the injection. The graphs show methylation of CpGs in Area 2
of the c‐Fos gene promoter (A) and Area A of the Egr‐1 gene promoter (B) from the CA regions. Data
are shown as percentage methylation (mean ± SEM, n = 4‐6). Statistical analysis: Three‐way ANOVA;
(A) effect of SAM: F(1,134) = 3.6, p = 0.060; effect of stress: F(1,134) = 18, p < 0.0001; effect of CpG
number: F(6,134) = 150, p < 0.0001; interaction SAM x stress: F(1,134) = 28, p < 0.0001; interaction SAM x
CpG number: F(5,134) = 0.89, p = 0.49; interaction stress x CpG number: F(6,134) = 1.2, p = 0.31;
interaction SAM x stress x CpG number: F(5,134) = 0.42, p = 0.84. (B) Effect of SAM: F(1,280) = 1.9, p =
0.17; effect of stress: F(1,280) = 6.2, p < 0.05; effect of CpG number: F(16,280) = 110, p < 0.0001;
interaction SAM x stress: F(1,280) = 0.0, p = 1.0; interaction SAM x CpG number: F(11,280) = 0.47, p = 0.92;
interaction stress x CpG number: F(16,280) = 0.83, p = 0.66; interaction SAM x stress x CpG number:
F(11,280) = 0.60, p = 0.83. Bonferroni‐corrected post‐hoc test with contrasts: *, p < 0.05 compared with
the respective vehicle/BL group; $, p < 0.05 compared with the respective SAM/BL group
Figure S8. The enrichment of H3K4me3, H3K9me3 and H3K27me3 at the c‐Fos and Egr‐1 promoters
after SAM treatment and forced swimming.