Designing and Initial Testing of a Tyre Strain Sensing System to
Estimate Slip in Robotic Platforms
Ali Farooq Lutfi Lutfi
1,2, Tobias Low
1, Andrew Maxwell
11
Faculty of Health, Engineering and Sciences, University of Southern Queensland,
Toowoomba, Australia
2
Control and Systems Engineering Department, University of Technology, Baghdad, Iraq
{
AliFarooqLutfi.Lutfi, Tobias.Low, Andrew.Maxwell
}
@usq.edu.au
Abstract
Wheel slip estimation is an important element in improving the performance of wheeled mo-bile robots. Conventional wheel slip estima-tion methods relied upon sensors which were far from the tyre-ground interface; hence, they required the use of approximated models and complex transformations. A modern method, which directly measures tyre-ground contact quantities utilising in-tyre sensors, helps de-velop accurate and direct wheel slip estimation techniques. The work presented in this paper represents a first stage towards developing such techniques. An optimum sensing system for a small, non-pressurised robot’s tyre is presented. Experimental work is conducted to determine the possibility of bonding the selected system inside the tyre. Static footprint tests are un-dertaken to derive an optimal design for the sensing system. Image processing is utilised to obtain dimensions of the tyre-ground contact patches provided by these tests. Performance of the produced system design is evaluated with static tests using a custom-built, bench-top rig. Results of these tests demonstrated a sufficient degree of consistency in the measurements of the sensory system. In addition, the strain pro-files extracted from the sensors’ readings agree with key theoretical facts.
1
Introduction
Wheel slip represents a determinant factor in a num-ber of applications for wheeled mobile robots. First, odometric solutions produce false position estimations during wheel slip incidents [Chae and Song, 2013]. In addition, taking wheel slip into consideration is a crucial element in developing efficient path planning algorithms [Ward and Iagnemma, 2008]. Moreover, wheel slip esti-mation is a key component in enhancing various control systems, such as traction control and stability control
[Songet al., 2008]. Also, wheel slip affects the naviga-tion of the mobile robot and hinders its performance in target chasing and obstacle avoidance. Furthermore, as it does not contribute to the desired robot motion in the planned path, wheel slip is regarded as a form of energy loss. Thus, wheel slip estimation results in a reduction of the robot’s energy consumption.
Conventional wheel slip estimation methods based on different sensors such as accelerometers, gyros, IMU, and cameras have been proposed [Yi et al., 2009; Song et al., 2008; Chae and Song, 2013]. These sensors were mounted on different positions on the body of the robot. Hence, to interpret the indirect measurements collected by these sensors about the tyre-ground dynamic events, a number of projections from one coordinate system to another as well as imprecise mathematical models were required [Krier et al., 2014]. Additionally, some of the issues which are encountered with cameras, which are the main competing sensors for slip detection in mobile robots, are the necessity of identifying traceable features as well as the known defects of cameras such as illu-mination problems and images’ disturbances caused by dynamic obstacles in the scene [Chae and Song, 2013; Ward and Iagnemma, 2008]. However, because of devel-oping sensor technologies, it is possible now to embed various types of sensors in the tyre to directly measure different tyre-ground quantities [Palmeret al., 2002].
as close to the tyre contact patch as possible could be collected and deployed for accurate wheel slip detection. This study presents an in-tyre sensing system which can accurately measure tyre-ground interactions for small, non-pressurised robots’ tyres. To develop this system, the knowledge gained from both the automo-tive field and the robotic field will be employed. Experi-mental work is presented to show possible techniques to mount sensors inside a robot’s tyre as well as to study its contact patch. Finally, static tests on a custom-built, bench-top rig are conducted to assess the performance of the implemented sensing system.
2
Identifying Appropriate Sensing
System for Robots’ Tyres
Tyre Sensing systems previously presented in both the automotive and the robotic fields were examined to iden-tify a suitable sensory solution. In these two fields, the sizes and materials of wheels and tyres are different.
2.1
In the Automotive Field
Since equipping car tyres with sensors, to monitor both the road and tyre conditions, can effectively enhance road safety, several in-tyre sensing systems have been presented in the field of intelligent tyres [Matsuzaki and Todoroki, 2008]. These systems can be divided into non-contacting strain sensing, non-contacting strain sensing, ac-celeration sensing, and force sensing systems.
Non-contacting strain sensing systems need no major modifications for the tyre structure. Therefore, they will not affect tyre primary tasks as well as tyre deformation measurements. On the other hand, the most important points to consider are the large sensor size and the need for complex data processing algorithms to model sensor data [Moffittet al., 2009]. In these systems, the sensing element is not mounted on the tyre; instead, the sensor is attached to the wheel rim inside the tyre to contin-uously monitor the tyre inner surface. Nearly all non-contacting strain sensing methods are based on optical sensors; however, the use of an acoustic sensor was also noted.
Developed non-contacting, optical sensing systems utilised a position sensitive diode (PSD) [Tuononen, 2008]; CCD camera [Matsuzakiet al., 2012]; or laser sen-sors [Xiong and Tuononen, 2014]. Clearly, a large space inside the tyre, between the wheel rim and the tyre in-ner surface, is required to build such systems. Therefore, they are not suitable for small robots’ tyres.
It should be mentioned that, non-contacting strain sensing systems based on an ultrasonic sensor has also been used [Magoriet al., 1998]. Nevertheless, measure-ment accuracy was reported to be severely affected by echo attenuations caused by interferences of spurious sig-nals.
With contacting strain sensing systems, direct mea-surements are acquired. In addition, from a signal pro-cessing perspective, strain data are easier to analyse be-cause the strain sensor measures tyre deformations only in its vicinity [Moffitt et al., 2009]. At the same time, these sensors should be flexible enough to follow the tyre rubber elastic characteristics. This ensures that the sensor will capture the local tyre deformations with-out external disturbances. Also, this compatibility is required to avoid adhesion failure [Matsuzaki and Todor-oki, 2008]. Contacting strain sensing depends on a strain sensor mounted on the tyre inner surface [Erdoganet al., 2011; Palmeret al., 2002] or embedded in the tyre rub-ber [Palmer et al., 2002]. Strain sensors can be placed on the tyre inner surface longitudinally or laterally to detect strain changes in the respective direction.
It is worthwhile to mention that a special approach of strain sensing, a self-sensing technique, where the steel wires in the tyre belts serve as electrodes to indicate capacitance variations was introduced [Matsuzaki and Todoroki, 2008]. This approach can not be adopted for robots’ tyres since there are no steel wires integrated into their much simpler structure.
Acceleration sensing systems can provide reliable read-ings since they can endure sudden measurement peaks when passing through the contact patch. However, a number of challenges are visualised for developing these systems [Ergen et al., 2009; Moffittet al., 2009]. First, a sophisticated data processing algorithm is crucial to decouple rotational accelerations, gravitational accelera-tions, and vibration signals.Thus, choosing such sytems to study a dynamic problem as complex as wheel slip will further complicate the matter. Secondly, it was seen that the accelermoeters, used to build these systems by other researchers, are expensive. It is impractical to embed such high-cost components inside the low-cost robots’ tyres.
2.2
In the Robotic Field
For wheeled mobile robots, the few in-wheel sensing sys-tems, which were all dedicated to collect measurements only in the longitudinal direction of motion, can be di-vided into two groups: wheel deflection sensory systems and tyre rubber deformation sensory systems. Designs in the first group aim at developing sensing modules par-ticularly for planetary rovers, which traverse either loose soil or rugged terrains with a very low speed motion [Iizuka et al., 2014]. Regarding wheel type, measured parameters, and service conditions, this group is neither relevant nor applicable for the specifications of the pro-posed research. The second class includes especially de-signed sensors which monitor tyre rubber deformations to extract wheel-ground contact information [Yi, 2008].
In both the automotive and robotic field, it can be cluded that various sensor types, technologies, and con-figurations were presented to develop tyre deformation sensing systems. Taking into account the cost, complex-ity, availabilcomplex-ity, compatibility with tyre material, and size, contacting strain sensing utilising a flexible sensor is suggested for this research. The contacting sensors will be glued on the tyre inner surface as the other op-tion, which is sensors embedded inside the tyre tread, is more difficult to be positioned properly and may not provide useful data due to the relative motion between the sensor and the tyre throughout the contact patch [Zhanget al., 2013].
3
Testing the Possibility of Building a
Strain Sensing System Inside a
Robot’s Tyre
The strain gauges utilised for this research were from Micro-Measurements division (Measurements group, INC.). The gauges type is CEA-06-240UZ-120 Stu-dent Gauges. The resistance of the gauge in ohms is 120.0±0.3% and the gauge factor is 2.070±0.5% at 24◦C. These low-cost, general-purpose, experimentally widely used gauges are extremely thin, 0.056 mm, and flexible. For static strain readings, they operate in a temperature range from−75◦ to +175◦C. For single
cy-cle use, these high-elongation gauges can measure up to 5% elongation. To reduce thermal effects to least pos-sible levels, self-temperature compensation (STC) char-acteristics has been added to the gauges during the pro-duction process. All these features make these sensors an ideal solution for developing a sensing system inside a robot’s tyre. In this context, it should be affirmed that designing a special sensor is out of the scope of this work. However, designing a new tyre sensing system, in terms of sensors type, number, and configuration, is in-dispensable to reach the specific research objectives. In the following, the successive stages to bond these sensors
on the inner surface of a robot’s tyre are described.
Stage 1: Learning how to bond sensors to rubber us-ing a piece of rubber and plastic samples. Many plastic samples were cut to the same size of the strain gauges. The three main steps were surface preparation by clean-ing, abradclean-ing, and marking; plastic samples’ prepara-tion; and bonding operation. The benefit of this stage was choosing appropriate cleaning substances, deciding a suitable grit degree for the abrasive paper, learning how to deal with, transfer, and position the samples, se-lecting a proper marker, determining type and amount of adhesive, and mastering the bonding process.
Stage 2: Gluing a real strain gauge on a rubber strip utilising experience gained inStage 1. After that, wires were soldered to the gauge. A data acquisition system (DAQ) based on National Instruments hardware and LabVIEW software was built to collect the sensor reading. It consists of NI cDAQ-9172, NI 9219, and Lab-VIEW 2014. The built-in quarter-bridge configuration of NI 9219 was used. During this simple test, the belt was manually pulled to apply small amount of force and cor-responding strain changes were indicated by the sensor output.
Stage 3: Gluing strain gauges on different locations on the inner surface of a robot’s tyre. The previously mentioned surface preparation, gauge bonding, and sol-dering operations were performed to install the sensors inside the tyre. The only new factor introduced to these operations was the curved surface of the tyre inner liner. It significantly increased the complexity of these tasks especially when taking into account that more than one sensor was placed across the limited space of the tyre width.
Robots’ tyres are usually fused to the wheel with a very strong adhesive. Since the application of in-tyre sensors requires the ability to easily get the tyres off the wheels, the standard tyres were not helpful and the best solution was to use the so called bead-lock rims. In these wheels, the tyre is fixed to the wheel with a bead-lock ring which is secured using screws to fix the tyre edge to the rim. The tyres are non-pressurised, i.e., they use foam inserts instead of air. This type of tyres is commonly used for robotic platforms. The tyre is about 95 mm in inner diameter, 139 mm in outer diameter, 87 mm in width, and 10 mm in sidewall height.
DAQ system. Wires were used to access the data from inside the tyre during the tests.
Figure 1: Tyre bench-top rig- Setup for initial tests.
4
Footprint Tests to Examine Tyre
Contact Patch
Compression tests were conducted using a compression machine to study the contact patch in terms of its shape (contour) as well as the effect of changing the vertical force on varying its shape and size. Knowing these fea-tures will lead to suggesting an optimum design of the sensory system for the particular tyre used herein. Fig-ure 2 shows the experimental setup of these tests. A u-shaped Aluminium bracket was manufactured to hold the tyre in these tests. The bracket makes use of the small screws in the bead-lock rim to fix the tyre from its two sides. A 3D printed part was designed and screwed to the upper side of the bracket to attach the tyre to the compression machine. To obtain the fooprints of the tyre in the tests, a stamp pad was used to smear the lower half of the tyre outer surface with ink. Af-ter that, the tyre was pressed vertically against a flat wooden board on which a white paper was taped. Dif-ferent values of vertical loads were applied starting from the lowest value, where the tyre just begins to make con-tact with the board, to the maximum value, where it was thought that applying a higher force will damage the tyre or the rim. The range of the vertical loads was between 5N to 100N in increment of 5N.
After completing the tests, the 20 contact patch prints were scanned into computer. The images were processed in Matlab to measure, in pixels, the footprint area, the maximum longitudinal length, and the maximum lateral length. Figure 3 illustrates the steps of the image pro-cessing algorithm used to find the required quantities. A spatial calibration factor was then calculated and used to convert these measurements from pixels to millimetres.
[image:4.595.91.263.91.255.2]Figure 2: Setup of the footprint tests.
Figure 3: Image processing for the tyre footprint.
It can be seen in Figure 4- Figure 6 that as the vertical force increases, the vertical tyre displacement (vertical tyre deformation) and the footprint geometry increases. However, it can be noticed that starting from vertical force= 60N, the curves almost saturate. Also, the in-crease in the longitudinal length is more notable than the increase in the lateral length (Figure 6).
5
Sensor System’s Design and
Placement
5.1
Sensor System’s Design
[image:4.595.325.546.255.476.2]Figure 4: Footprint tests: Vertical displacement versus Vertical force.
Figure 5: Footprint tests: Footprint area versus Vertical force.
Figure 6: Footprint tests: Maximum length versus Ver-tical force.
driven by the fact that this is a reasonable loading for small to medium-sized robots and by the available space inside the tyre. With this placement, it is ensured that all the sensors are located inside the area of the contact patch under all possible loading conditions. Choosing a
smaller area, such as the footprint of 5 N, was not pos-sible due to physical limitations where, in such a small area, the sensors would have to be stacked close to each other. With the used strain gauges, this is not possi-ble since these standard, low-cost sensors require deli-cate operation of gluing and soldering. In addition, this would have resulted in no significant differences in the readings of the sensors since they would be located in the same limited space. Finally, since the sensors are inside the contact patch when 10N vertical load is applied, they will certainly be within the contact patch when bigger loads are exerted.
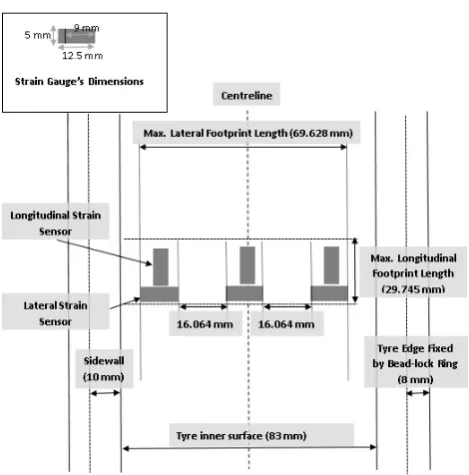
To decide the most appropriate sensor system design for the used tyre, some criteria were placed. Most im-portantly, it must be able to capture measurements re-flecting the strain distribution in both longitudinal and lateral directions. The reason for that was to cover the possible cases of tyre braking, traction, and turning (cor-nering). Other factors which affected the decision were the tyre’s small size, the minimum number of required sensors, and the best locations to position the sensors. Hence, the design explained in this section was judged to be the most promising configuration.
Regardless of the shape of the contact patch, the cir-cumferential (longitudinal) strain can be measured with one sensor placed longitudinally on the centreline, i.e., at the middle of the contact patch. Even under braking or traction, one circumferential sensor placed at the cen-treline is enough to measure the corresponding change in the circumferential strain distribution. In contrast, two sensors placed laterally and symmetrically about the centreline are required to measure the change in the ax-ial (lateral) strain distribution. These two lateral sensors give different measurements during steering (cornering) because they capture the asymmetric lateral strain dis-tribution [Yang, 2011].
[image:5.595.85.266.448.599.2]Figure 7: Sketch of tyre inner surface with the sensor system design.
across the tyre width is useful in obtaining the contact shape information.
Lastly, it can be mentioned that some previous works suggested that placing sensors on the tyre sidewall might give useful information which could complement the readings collected from the tyre tread. However, with the used tyre, where the sidewall is very small (less than 10 mm), it is physically very difficult to put a sensor that would operate properly. Some of the main issues would be the small space where the sensor is supposed to be glued, high probability of sensor debonding, soldering, and wiring.
5.2
Sensor System’s Placement
This process involved three stages: bonding the design to the tyre inner surface, soldering wires to the gauges, and assembling the wheel. The following operations were performed to prepare the tyre inner surface for the bond-ing stage. First, degreasbond-ing an area which is bigger than that needed for the sensor system placement using iso-propyl alcohol and gauze swabs. Then, abrading the same area using 320-grit abrasive paper. After that, re-moving residuals from the abrasion operation using alco-hol and gauze. Finally, marking the tyre centreline near the area.
To build the sensor system, six strain gauges were pre-pared. The following steps were followed. A paper with the desired sensor design, as in Figure 7, where the exact positions of the sensors are shown, was attached to the bottom side of a glass board which will be the work sur-face. After that, the gauges were transferred to the glass
board and, using the diagram on the paper attached to the glass board, they were positioned to their suggested locations in the design. Lastly, a piece of wide sticky tape was used to transfer all the gauges at once to the tyre inner surface.
To glue the sensors, the sticky tape holding the gauges was fixed to the tyre inner surface such as the sensors are positioned to their correct locations. To do so, the marks drawn on the tyre inner centreline were used as a reference. Next, the design was mounted on the tyre inner surface with three consecutive steps. In each step, part of the sticky tape was lifted to glue the two sensors, one longitudinal and one lateral, which are close to each other. Then, an enough amount of adhesive (alkayl glue) was placed on the tyre and then the sensors were aligned back on their positions on the tyre. Figure 8 shows the sensor system design glued to the tyre inner surface.
[image:6.595.58.293.49.287.2]The second stage was soldering wires to the gauges. Figure 9 shows the sensor system after the soldering pro-cess.
The Final step was assembling the tyre, foam, and wheel together. To do this, two holes were created in the foam to pass the wires from inside the tyre to outside the foam. Then, two existing holes in the wheel were used to pass the wires as shown in Figure 10(a). Then, the foam was carefully inserted inside the tyre as shown in Figure 10(b) and, finally, the wheel was placed inside the tyre and foam assembly as shown in Figure 10(c). The tyre was then fixed to the rim using the two rim lock rings.
6
Experimental Results and Discussion
[image:6.595.352.521.506.675.2]The bench-top rig presented earlier was modified to allow measuring tyre strains at different angular positions. As can be seen in Figure 11, a purpose-built clamp, which was fixed at one end to the wheel using four screws in
Figure 9: The sensor system after the soldering process.
the bead-lock rim and was screwed at the other end to the board, was used to hold the tyre at different angles. Thus, static tests with different vertical forces, horizontal forces, and sensors’ angular positions were conducted. In the following, pieces of evidence that the sensing system is working will be presented.
Figure 12 shows an example of strain profiles measured by the sensors. This figure illustrates that the strain pro-files produced by the three longitudinal sensors convey similar features in terms of waveform shapes and strain variations at angular positions. This similarity is more perceptible in the readings of the two side sensors, named
(a) (b)
[image:7.595.92.262.53.222.2](c)
Figure 10: Assembling the wheel: (a) step 1, (b) step 2, (c) step 3.
Figure 11: Tyre bench-top rig used for static tests.
[image:7.595.65.287.425.671.2]longitudinal 1 and longitudinal 3. This is related to the fact that these two sensors are mounted in the same spot on the two opposite sides. As a result, they stretch in the same manner in response to the applied forces and thus they give comparable results. This observation is also true for the readings of the lateral sensors. In the same context, it is worth mentioning that there are no clear similarities between the longitudinal sensors’ read-ings and the lateral sensors’ readread-ings. This is because the former indicates strains caused by stretching of the tyre in a direction parallel to the direction of the ap-plication of the horizontal force while the latter records strains caused by stretching in a direction perpendicu-lar to the horizontal force. From these comparisons, it can be concluded that the embedded strain gauges are working properly since their readings are related to their position and orientation.
Figure 12: Example of a strain profile collected by the strain gauges. Lateral 2 is not presented because it has malfunctioned
[image:7.595.339.529.478.639.2]the contact patch, slight changes in strain values are no-ticed in the angles far from the contact patch at both sides, i.e., angles −120◦ to −60◦ and 60◦ to 120◦. On
[image:8.595.327.537.54.238.2]the contrary, such variations become more significant in the vicinity of the contact patch, namely, at angles−60◦ to 60◦. Same observations about strain changes were reported by Yang [2011]. These strain variations are at-tributed to corresponding deformations around tyre cir-cumference. The part of the tyre which makes contact with the ground is the most deformed since it endures ef-fects of applied vertical and horizontal forces. Therefore, the strain changes are higher in this area.
[image:8.595.324.538.289.471.2]Figure 12 indicates that the tyre is stretching in one direction at some of the angles whereas it stretches in the opposite direction (compresses) at other angles. For the three longitudinal sensors, it can be seen that tensile strain is recorded at the centre of the contact patch while compressive strains are noticed in nearby regions at the two sides of the contact centre, i.e., around±20◦. This agrees with results presented by Matsuzaki and Todor-oki [2008]. For the lateral sensors, the lateral strain pro-file shows features which are the opposite of those for the longitudinal strain profile. This behaviour is espe-cially observable in the readings of the sensor called lat-eral 1. Therefore, the tyre is under tensile latlat-eral strain both before and after the contact region while it is under compressive lateral strain within this region. The same conclusion regarding lateral strains is reported by Yang [2011].
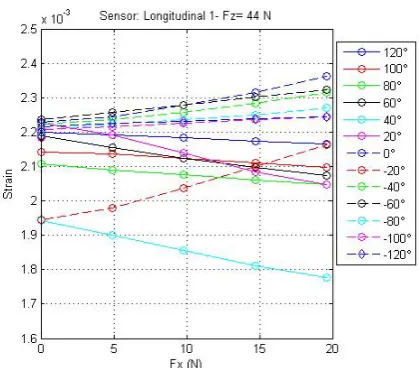
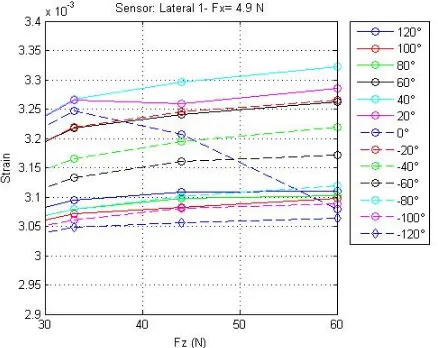
Figure 13 and Figure 14 shows an example of the rela-tionship between the horizontal force (Fx) and the strain at a constant value of the vertical force (Fz) at each of the tested angular positions for a longitudinal and a lat-eral sensor, respectively. Figure 15 and Figure 16 shows an example of the the relationship between Fz and the strain at a constant value of Fx at each of the tested angular positions for a longitudinal and a lateral sensor, respectively. It can be seen in these figures that the sen-sors’ readings demonstrate linear relationship between the applied force, horizontal or vertical, and the strain values. In addition, the graphs show that the lines rep-resenting the relationships are evenly spaced and close to each other which indicates a consistent performance for the sensors.
Figure 13- Figure 16 show that as the sensors become closer to the contact patch, the slope of the lines be-comes steeper. This is because the strain at the points near and in the contact patch is higher. Consequently, increasing the applied force results in larger changes in strain magnitudes at these points as compared to those at the angles which are far from the contact patch.
From the readings of the longitudinal sensor in Fig-ure 15 , it is seen that increasing the value of Fz causes a decrease in the strain value.
Figure 13: Strain versus Fx at tested angles (Example: Sensor- Longitudinal 1).
Figure 14: Strain versus Fx at tested angles (Example: Sensor- Lateral 1).
In contrast with the longitudinal sensors, readings from the lateral sensor shown in Figure 16 demonstrate that as the value of Fz increases, the strain value in-creases. This response of longitudinal and lateral sen-sors to increasing Fz is also seen in results introduced by Yang [2011].
Figure 15: Strain versus Fz at tested angles (Example: Sensor- Longitudinal 1).
Figure 16: Strain versus Fz at tested angles (Example: Sensor- Lateral 1).
patch length corresponds to the vertical load whereas the shift in the contact centre is related to the horizon-tal force [Krier et al., 2014]. Furthermore, the contact patch length is also linearly and inversely proportional to the effective radius. Therefore, the contact patch length is used to derive the effective radius. Then the value of the estimated effective radius is inserted into the follow-ing equation to calculate the slip ratio [Matsuzaki and Todoroki, 2008]:
s= V −ωre
V (1)
Where (V) is the robot’s linear velocity, (ω) repre-sents the wheel angular velocity, and (re) is the effective
radius.
7
Conclusion and Future Work
This paper has showed the initial results of the first step in building a tyre strain sensing system for the slip es-timation in a small, non-pressurised tyre. It has pre-sented a modern sensing technique, which utilizes sen-sors mounted inside tyres, to directly monitor the tyre-ground interactions. A comprehensive study of in-tyre sensing systems led to selecting a contacting strain sens-ing system for the robot’s tyre used in this research. Experimental work was conducted to examine possible techniques of mounting this system inside a small, non-pressurised tyre. After that, static footprint tests were utilised to study the tyre-ground contact area and sug-gest a sensor system design. Next, the implemented de-sign was tested through static tests using a bench-top rig. These tests showed promisimg results because they indicated consistent performance by the sensors. Also, the tests illustrated that the design delivers reasonable and expected output which agrees with work of previ-ous researchers. Future work will focus on developing a deeper analysis for the results of these static tests to ex-tract useful information for wheel slip estimation. Later on, advanced, dynamic tests will be undertaken to eval-uate the performance of the sensor design and the slip estimation method in various working conditions.
Acknowledgments
This work has been supported by the University of Southern Queensland. The senior author would like to acknowledge the University of Technology, Baghdad, Iraq for funding the PhD scholarship.
References
[Chae and Song, 2013] Heewon Chae and Jae-Bok Song. Slippage detection and pose recovery for upward-looking camera-based slam using optical flow. In13th International Conference on Control, Automation and Systems (ICCAS), pages 1108–1113, Gwangju, Korea, 20-23 October 2013.
[Erdogan et al., 2011] Gurkan Erdogan, Lee Alexander, and Rajesh Rajamani. Estimation of tire-road fric-tion coefficient using a novel wireless piezoelectric tire sensor. IEEE Sensors Journal, 11(2):267–279, 2011.
[Ergenet al., 2009]
Sinem Coleri Ergen, Alberto Sangiovanni-Vincentelli, Xuening Sun, Riccardo Tebano, Sayf Alalusi, Giorgio Audisio, and Marco Sabatini. The tire as an intelli-gent sensor. IEEE Transactions on Computer-Aided Design of Integrated Circuits and Systems, 28(7):941– 955, July 2009.
[image:9.595.64.283.283.457.2]grousers with a tactile sensor for wheels of lunar explo-ration rovers to measure sinkage. International Jour-nal of Advanced Robotic Systems, 11(49):1–7, 2014.
[Iseet al., 2013] Taisei Ise, Masahiro Higuchi, and Hi-roshi Tachiya. Development of a tactile sensor to measure tire friction coefficients in arbitrary direc-tions. International Journal of Automation Technol-ogy, 7(3):359– 366, 2013.
[Krieret al., 2014] David Krier, Gabriele S. Zanardo, and Luigi del Re. A pca-based modeling approach for estimation of road-tire forces by in-tire accelerom-eters. In19th World Congress, The International Fed-eration of Automatic Control (IFAC), pages 12029– 12034, Cape Town, South Africa. 24-29 August 2014.
[Magoriet al., 1998] Valentin Magori, Valentin R. Magori, and N. Seitz. On-line determi-nation of tyre deformation, a novel sensor principle. InIEEE Proceedings of Ultrasonics Symposium, pages 485–488, Sendai, Japan, 1998.
[Matsuzaki and Todoroki, 2008]
Ryosuke Matsuzaki and Akira Todoroki. Intelligent tires based on measurement of tire deformation. In
Journal of solid mechanics and Materials engineering, 2(2):269–280, 2008.
[Matsuzakiet al., 2012] Ryosuke Matsuzaki, Naoki Hi-raoka, Akira Todoroki, and Yoshihiro Mizutani. Strain monitoring and applied load estimation for the devel-opment of intelligent tires using a single wireless ccd camera. Journal of Solid Mechanics and Materials Engineering, 6(9):935–949, 2012.
[Moffittet al., 2009] Ronald D. Moffitt, Scott M. Bland, Mohammad R. Sunny, and Rakesh K. Kapania. Sen-sor technologies for direct health monitoring of tires.
Encyclopedia of Structural Health Monitoring, John Wiley Sons, Ltd., ISBN: 978-0-470-05822-0, 2008.
[Palmeret al., 2002]
Matthew E. Palmer, Clark C. Boyd, Jim McManus, and Scott Meller. Wireless smart tires for road friction measurement and self state determination. In 43rd AIAA/ASME/ASCE/AHS Structures, Structural Dy-namics, and Materials Conference, Paper AIAA-2002-1548, Denver, Colorado, 22-25 April 2002.
[Songet al., 2008] Xiaojing Song, Zibin Song, Lakmal D Seneviratne, and Kaspar Althoefer. Optical flow-based slip and velocity estimation technique for un-manned skid-steered vehicles. IEEE/RSJ Interna-tional Conference on Intelligent Robots and Systems, pages 101–106, Nice, France, 22-26 September 2008.
[Tuononen, 2008] A.J. Tuononen. Optical position de-tection to measure tyre carcass deflections. Vehicle System Dynamics,46(6):471–481, 2008.
[Ward and Iagnemma, 2008] Chris C. Ward and Karl Iagnemma. A dynamic-model-based wheel slip detec-tor for mobile robots on outdoor terrain. In IEEE Transactions on Robotics, 24(4):821–831, 2008.
[Xiong and Tuononen, 2014] Yi Xiong and Ari Tuononen. A laser-based sensor system for tire tread deformation measurement. Measurement Science and Technology, 25(11), 115103, 2014.
[Yang, 2011] Yang X.Finite element analysis and exper-imental investigation of tyre characteristics for devel-oping strain-based intelligent tyre system. Ph.D. dis-sertation, Dept. Mech. Eng., The University of Birm-ingham, BirmBirm-ingham, UK, September 2011.
[Yi, 2008] Jingang
Yi. A piezo-sensor-based smart tire system for mobile robots and vehicles. InIEEE/ASME Transactions on Mechatronics, 13(1):95–103, February 2008.
[Yiet al., 2009] Jingang Yi, Hongpeng Wang, Junjie Zhang, Dezhen Song, Suhada Jayasuriya, and Jingtai Liu. Kinematic modeling and analysis of skid-steered mobile robots with applications to low-cost inertial-measurement-unit-based motion estimation. InIEEE Transactions on Robotics, 25(5):1087–1097, October 2009.