Int. J. Electrochem. Sci., 10 (2015) 303 - 316
International Journal of
ELECTROCHEMICAL
SCIENCE
www.electrochemsci.orgSimultaneous Determination of Hydroxylamine, Phenol and
Sulfite in Water and Waste Water Samples Using A
Voltammetric Nanosensor
Vinod Kumar Gupta1, 2,*, Hassan Karimi-Maleh*3,4 ,,Roya Sadegh3
1
Department of Chemistry, Indian Institute of Technology Roorkee, Roorkee 247667, India
2
Department of Applied Chemistry, University of Johannesburg, Johannesburg, South Africa
3
Department of Chemistry, Majlesi Branch, Islamic Azad University, Isfahan, Iran
4
Department of Chemistry, Graduate University of Advanced Technology, Kerman, Iran
*
E-mail: [email protected]; [email protected]
Received: 22 August 2014 / Accepted: 11 October 2014 / Published: 17 November 2014
This paper describes the development a novel 8,9-dihydroxy-7-methyl-12H-benzothiazolo[2,3-b]quinazolin-12-one -ZnO/CNTs modified carbon paste electrode (DMBQ/ ZnO/CNTs/CPE)for the electrocatalytic determination of hydroxylamine (HX) in the presence of phenol (PL) and sulfite (ST) in water and waste water samples. We describe synthesis and characterization of ZnO/CNTs nanocomposite with different methods such as Scanning electron microscopy (SEM); Energy-dispersive X-ray spectroscopy (EDS) and X-ray diffraction (XRD). Result shows for the mixture containing HX, PL and ST, the peaks potential well separated from each other. Their square wave voltammetrics (SWV) peaks current increased linearly with their concentration at the ranges of 0.09– 350, 0.5–500 and 0.7–400 µM, respectively with the detection limits of 0.04, 0.1 and 0.3 µM, respectively. The modified electrode was successfully used for the determination of the analytes in real samples with satisfactory result.
Keywords: Hydrazine; Phenol; Water and waste water analysis; Voltammetric Sensor, ZnO/CNTs nanocomposite
1. INTRODUCTION
to the environment through various waste streams. On the other hand, HX may explode on heating and the nature of the explosive hazard is not well understood [2]. Also, HX is an irritant to the respiratory tract, skin, eyes, and other mucous membranes. It may be absorbed through the skin, is harmful if swallowed, and is a possible mutagen. Therefore, the quantitative determination of HX is very significant in environmental samples such as water and waste water.
Phenol is a high toxicity compound in environmental samples that is subject to regulation as water pollutants [3]. Phenol is highly irritating to the skin, eyes, and mucous membranes in humans after acute (short-term) inhalation or dermal exposures. On the other hand, PL is considered to be quite toxic to humans via oral exposure. Anorexia, progressive weight loss, diarrhea, vertigo, salivation, a dark coloration of the urine, and blood and liver effects have been reported in chronically (long-term) exposed humans. Animal studies have reported reduced fetal body weights, growth retardation, and abnormal development in the offspring of animals exposed to phenol by the oral route [4].
Sulfites are commonly used in the food industries as preservatives and antioxidants, and in the brewing industry as an antibacterial agent. Sulfites occur naturally in all wines to some extent. Sulfites are commonly introduced to arrest fermentation at a desired time, and may also be added to wine as preservatives to prevent spoilage and oxidation at several stages of the winemaking. Without sulfites, grape juice would quickly turn to vinegar. In large quantities, sulfite and its oxidation products are pollutants [5]. High sulfite content in the blood and urine of babies can be caused by molybdenum cofactor deficiency disease which leads to neurological damage and early death unless treated. Treatment, requiring daily injections, became available in 2009 [6].
According to the above points, it is very vital for design and construction of a rapid and inexpensive sensor for analyzing of HX, PL and ST in real samples. Health survey of drinking water and wastewater can be useful for human health. Some publications are available regarding electrochemical determination of just HX in real samples using chemically modified electrodes [7-9]. In all of the reported papers, PL and ST acts as an interfering compound, hence needing separation before analysis, because it affects the selectivity. As yet, based on our knowledge, no paper has been reported on the simultaneous determination of HX pulse PL and ST using electrochemical methods. Therefore, in continuation of our studies concerning the preparation of chemically modified electrodes for electroactive compounds analysis [10–20], in the present work, we describe preparation of a new DMBQ/ ZnO/CNTs/CPE and investigate its performance for the electrocatalytic determination of HX in aqueous solutions. We also evaluate the analytical performance of the modified electrode for simultaneous determination of HX, PL and ST.
2. EXPERIMENTAL
2.1. Chemicals
1.0 × 10⁻² mol L–1 HX solution was prepared daily by dissolving 0.0640 g HX in water and the solution was diluted to 100 mL with water in a 100–mL volumetric flask. The solution was kept in a refrigerator at 4 oC in the dark. Further dilution was made with water.
1.0 × 10⁻² mol L–1 PL solution was prepared daily by dissolving 0.094 g PL in a buffer solution, pH = 8.0, in a 100–mL volumetric flask, and under ultrasonication for several minutes. Further dilution was made with water.
1.0 × 10⁻² mol L–1 ST solution was prepared daily by dissolving 0.013 g ST in a buffer solution, pH = 8.0, in a 100–mL volumetric flask, and under ultrasonication for several minutes. Further dilution was made with water.
Phosphate buffer solutions (sodium dihydrogen phosphate and disodium monohydrogen phosphate plus sodium hydroxide, 0.1 mol L–1), PBS, with different pH values were used.
High viscosity paraffin (d = 0.88 kg L–1) from Merck was used as the pasting liquid for the preparation of carbon paste electrode. Spectrally pure graphite powder (particle size<50 µm) from Merck and multiwall carbon nanotubes (>90% MWNT basis, d × l = (90 – 60 nm) × (5 – 9 μm)) from Fluka were used as the substrate for the preparation of the carbon paste electrode as a working electrode.
2.2. Apparatus
Cyclic voltammetry (CV), impedance spectroscopy, and square wave voltammetry (SWV) were performed in an analytical system, Autolab with PGSTAT 302N (Eco Chemie, the Netherlands). The system was run on a PC using GPES and FRA 4.9 software. For impedance measurements, a frequency range of 100 kHz to 1.0 Hz was employed. The AC voltage amplitude used was 5 mV, and the equilibrium time was 15 min. A conventional three-electrode cell assembly consisting of a platinum wire as an auxiliary electrode and an Ag/AgCl (KClsat) electrode as a reference electrode
were used. The working electrode was either an unmodified carbon paste electrode (CPE) or a DMBQ/ ZnO/CNTs/CPE.
2.3. Synthesis of ZnO/CNTs
The commercial multiwalled carbon nanotubes with tube diameters of about 10–20 nm were used. The preparation of ZnO/CNTs catalysts includes three steps. First, the chemical pretreatment of carbon nanotubes is required. A definite amount of carbon nanotubes was introduced into 40 cm3 of nitric acid and sulfuric acid (3:1 in volume) solution; then, 10 cm3 of ethanol was dropped into the solution slowly, and the solution was agitated in a shaker at 65 °C and 200 rpm for 24 h. In the second step, certain amounts of purified CNTs (3 g) were dispersed into distilled water solution of NaOH (0.5 M; 100 mL) by ultrasonication for 20 min. The third step is the supporting of zinc oxide on carbon nanotubes by a direct deposition process. Zn(NO3)2.2H2O of 3.7 g was dissolved in 100-mL distilled
water. Under constant magnetic stirring, the solution of Zn(NO3)2.2H2O was added dropwise to the
approximately at 20 mL h−1. After completion of the precipitation procedure, the mixture was stirred at room temperature for 18 h, washed and filtered continually in distilled water (pH 7.5), and dried at 120 °C. The solid samples were then calcined at 250 °C for 2 h.
2.4. Preparation of the modified electrode
For obtained the best condition in preparation of modified electrode, we optimized ratio ZnO/CNTs and DMB in DMBQ/ ZnO/CNTs/CPE. The result shows that the maximum intensity is used in 15.0% w/w ZnO/CNTs and 2.5% w/w DMBQ. Therefore, we selected these conditions of 15.0% w/w ZnO/CNTs and 2.5% w/w DMBQ for preparation of modified electrode. To prepare the modified electrode 25.0 mg of DMBQ was hand mixed with 825.0 mg of graphite powder and 150.0 mg of ZnO/CNTs in a mortar and pestle. Using a syringe, 12 drops of paraffin were added to the mixture and mixed well for 45 min until a uniformly wetted paste was obtained. The paste was then packed into a glass tube. Pushing a copper wire down the glass tube into the back of the mixture made electrical contact. When necessary, a new surface was obtained by pushing an excess of the paste out of the tube and polishing it on a weighing paper. The unmodified carbon paste electrode (CPE) was prepared in the same way without ZnO/CNTs and DMBQ to the mixture to be used for the comparison purposes.
2.5. Preparation of real samples
Water samples were stored in a refrigerator immediately after collection. Ten milliliters of the sample was centrifuged for 10 min at 2000 rpm. The supernatant was filtered using a 0.45 µm filter and then diluted 2–times with the PBS pH = 8.0. The solution was transferred into the voltammetric cell to be analyzed without any further pretreatment. The standard addition method was used for the determination of HX, PL and ST.
Without any pre-treatment of the sample, an accurate volume of the boiler water depending on the amount of above compounds in the sample (commonly 0.2–1.0 mL) directly was subjected for voltammetric measurement of above compounds as recommended procedure.
3. RESULTS AND DISCUSSION
3.1 ZnO/CNTs characterization
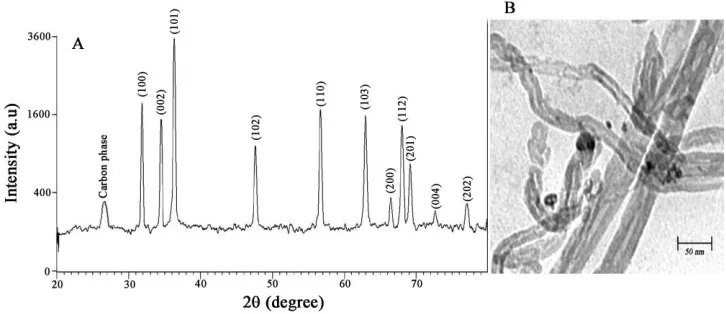
ZnO/CNT nano-powders were analyzed by XRD analyses. The XRD pattern of ZnO/CNT nano-powders, in the 2θ range of 10–80°, is shown in Fig. 1A. The prominent peaks were used to calculate the grain size via the Scherrer equation, expressed as follows:
D=Kλ/(β cosθ) (1)
Where λ is the wavelength (λ = 1.542 Å) (CuKα), β is the full width at half maximum (FWHM)
peaks were observed at the (100), (002), (101), (102), (110), (103), (200), (112), (201), (004) and (202) planes (for FCC structure). These peaks correspond to ZnO. Also, it clearly proves the presence of CNTs with a diffraction peak at about 26◦. Figure 1B presents a typical TEM image of ZnO/CNT nanocomposite. Result shows the core of particles supported on carbon nanotubes. Since the corresponding XRD pattern is only CNTs and ZnO, it was believed that the core and nanotubes of particles should be ZnO and carbon nanotubes, respectively.
Figure 1. A) XRD patterns of as-synthesized ZnO/CNTs nanocomposite. B) TEM image of ZnO/CNTs.
3.2. Catalytic Effect
[image:5.596.118.481.192.349.2]
Figure 2. Cyclic voltammograms of (a) the buffer solution at DMBQ/ZnO/CNTs/CPE; (b) 300 µM HX at DMBQ/CPE; (c) 300 µM HX at DMBQ/ZnO/CNTs/CPE; (d) 300. µM HX at ZnO/CNTs/CPE; (e) 300 µM HX at CPE. Conditions: 0.1 mol L-1 PBS (pH 8.0), scan rate of 20 mV s-1.
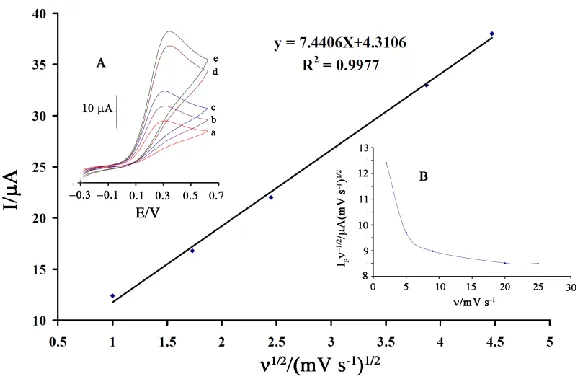
The influence of potential scan rate (ν) on catalytic current (Ip) of HX at DMBQ/
ZnO/CNTs/CPE was studied by cyclic voltammetry at various sweep rates (Fig. 3 inset A). Results show that the peak currents of HX grow with the increasing of scan rates and there are good linear relationships between the peak currents and the square root of the scan rate (ν1/2) (Fig.3). Also, they show that the action is mass transfer controlled at the sufficient over-potentials [28-30]. The recorded CVs showed a positive shift in Ep, which is confirming the kinetic limitation in the electrochemical
reaction [30-35]. Interestingly, the current function plot (Fig. 3, inset B) gave the characteristic shape of acoupled chemical reaction (ECcat) for the hydrazine, clearly confirming the electrocatalytic activity
of the mediator.
Figure 3. Plot of Ipa versus ν1/2 for the oxidation of 200.0 μM HX at various scan rates of (a) 1.0;
[image:6.596.187.431.76.258.2] [image:6.596.157.447.506.694.2]
To obtain information about the rate-determining step, the Tafel plot was drawn, as derived from points in the Tafel region of the cyclic voltammogram (Fig. 4). The slope of the Tafel plot was equal to 2.3RT/ n(1−α)F , which came up to 0.2393 and 0.2373 V decade−1 for scan rates 1 and 6 mV s-1, respectively. Therefore, we obtained the mean value of α equal to 0.7. In addition, the value of α was calculated for the oxidation of HX at pH 8.0 for both of the DMBQ/ZnO/CNTs/CPE and CPE using the equation (1):
αnα = 0.048/(EP–E P/2) (1)
where EP/2 is the potential corresponding to IP/2. The values for αnα were found to be 0.7 and 0.2
[image:7.596.144.453.288.488.2]at the surface of both of DMBQ/ZnO/CNTs/CPE and the CPE, respectively. The values show that the over–potential of HX oxidation is reduced at the surface of DMBQ/ZnO/CNTs/CPE, and also that the rate of electron transfer process is greatly enhanced. This phenomenon is, thus, confirmed by the larger Ipa values recorded during the cyclic voltammetry at DMBQ/ZnO/CNTs/CPE.
Figure 4. Tafel plot for DMBQ/ZnO/CNTs/CPE in 0.1 mol L−1 PBS (pH 8.0) with scan rates of 1 and 6 mV s−1 in the presence of 200.0 µM HX.
In chronoamperometric studies, we determined the diffusion coefficient (D) of HX. The experimental plots of I vs. t-1/2 were employed with the best fits for different concentrations of HX. Chronoamperometric measurements for different concentrations of HX at DMBQ/ZnO/CNTs/CPE were accomplished by setting the working electrode potential at 0.0 and 0.5 V as the first- and second-step potentials (Fig. 5A). The slopes of the resulting straight lines were then plotted vs. HX concentrations using the Cottrell equation to obtain the following equation [36]:
I = nFAD1/2Cbπ−1/2t−1/2 (2)
where D and Cb are the diffusion coefficient (cm2 s−1) and the bulk concentration (mol cm−3),
Chronoamperometry can also be employed to evaluate the catalytic rate constant, kh for the
reaction between HX and DMBQ/ZnO/CNTs/CPE according to the method of Galus [37]: IC/IL=γ1/2[π1/2erf (γ1/2) + exp(−γ)/γ1/2] (3)
where IC is the catalytic current of HX at DMBQ/ZnO/CNTs/CPE, IL is the limiting current in
the absence of HX and γ=khCbt (Cb is the bulk concentration of HX) is the argument of the error
function. In the cases where γ exceeds two the error function is almost equal to 1 and therefore, the above equation can be reduced to:
IC/IL= γ1/2 π1/2=π1/2 (khCbt)1/2 (4)
where t is the time elapsed in seconds. The above equation can be used to calculate the rate constant of the catalytic process kh. Based on the slope of IC/IL vs. t1/2 plot, kh can be obtained for a
given HX concentration (Fig. 5C). From the values of the slopes, an average value of kh was found to
be kh=5.245 × 10³ mol−1 Ls−1. The value of kh explains as well as the sharp feature of the catalytic
peak observed for catalytic oxidation of HX at the surface of DMBQ/ZnO/CNTs/CPE.
Double potential step chronocoloumetry, as well as other electrochemical methods, was also employed for the investigation of the electrode processes at DMBQ/ZnO/CNTs/CPE in the absence of the presence of HX. Forward and backward potential step chronocoloumetry on the modified electrode in a blank buffer solution showed very symmetrical chronocolougrams. These had about an equal charge consumed for both oxidation and reduction of DMBQRed/DMBQOx redox system in
[image:8.596.144.454.468.686.2]DMBQ/ZnO/CNTs/CPE. However, in the presence of HX, the charge value associated with forward chronocoloumetry was significantly greater than that observed for the backward chronocoloumetry (Fig. 5D). This behavior is typical of that expected for electrocatalysis at chemically modified electrode [38-43].
Figure 5. (A) Chronoamperograms obtained at DMBQ/ZnO/CNTs/CPE (a) in the absence, and in the presence of (b) 150.0 µM; (c) 200 µM HX at pH 8.0. (B) Cottrell’s plot for the data from the chronoamperogram. (C) Dependence of Ic/IL on the t1/2 derived from the chronoamperogram
3.3. Electrochemical impedance spectroscopic study
[image:9.596.91.488.413.690.2]Electrochemical impedance spectroscopy (EIS) is one of the most effective and reliable electrochemical methods to extract information about electrochemical characteristics of the electron-exchange systems, including double-layer capacitance, diffusion impedance, determination of the rate of charge transfer and charge transport processes, electrocatalytic systems and solution resistance [44-46].
So, EIS was also employed to investigate HX, PL and ST oxidation at DMBQ/ZnO/CNTs/CPE. The electrical equivalent circuits (from the modified electrode in the absence and presence of HX, PL or ST) compatible with the impedance spectra are shown in figure 6 inset. In this circuit, Rs, Q, and Rct represent solution resistance, a constant phase element corresponding to the
double-layer capacitance, and the charge transfer resistance associated with the oxidation of low-valence mediator species. W is a finite-length Warburg short-circuit term coupled to Rct. Fig. 6
presents the Nyquist diagrams and bode plots of the imaginary impedance (Zim) vs. the real impedance
(Zre) of the EIS obtained at the modified electrode recorded at 0.1 V dc-offset in the absence (a) and in
the presence of 300 µM PL (b); in the presence of 300 µM ST and 300 µM HX (c) in 0.1 M PBS (pH 8.0), respectively. As can be seen in high frequencies; there is a depressed semicircle that may be related to the combination of charge transfer resistance of electroactive material at a surface of electrode and double-layer capacitance (see Fig. 6 inset).
.
In following, a straight line with a slope of nearly 45◦ shows in Nyquist diagrams that related to mass transport process via diffusion of electroactive compound. In the presence of HX, the diameter of the semicircle decreases, confirming the electrocatalytic capability of the mentioned electrocatalyst for the oxidation of HX. This is due to the instant chemical reaction of HX with the high-valence ethynylferrocenespecies. It is evident from the EIS data that, in the presence of HX at a surface of the modified electrode, the resistance to electron transfer was at its minimum value. Therefore, there must be an interaction between HX and the mediator in the mediator potential oxidation. The catalytic reaction of HX oxidation that occurred via the participation of DMBQ species virtually caused an increase in the surface concentration of low valence species of the electrocatalyst. Thus, the charge-transfer resistance declined, depending on the concentration of HX in the solution.
On the other hand, PL and ST were not able to be electrocatalyzed on this modified electrode to provide the necessary conditions for the selective determination of HX in real samples. This behavior is consistent with the result of cyclic voltammetry and chronoamperometry
3.4 Calibration plot and detection limit
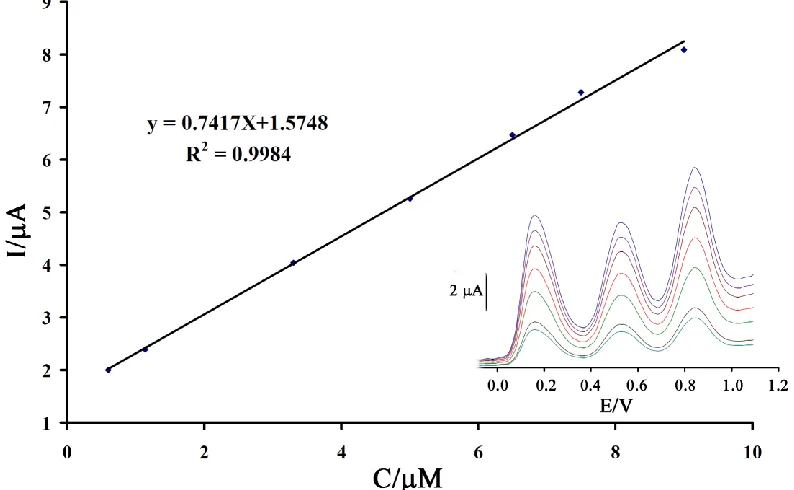
SWV has a much higher current sensitivity and better resolution than cyclic voltammetry, the SWV was used for the simultaneous determination of HX, PL and ST. In order to get the best sensitivity under the specific condition, an amplitude potential of 50 mV and frequency of 12 Hz were selected. The plot of peak current vs. the HX concentration consisted of two linear segments with slopes of 0.7548 and 0.1616 µA/µM−1 at the concentration ranges of 0.09–9.9 µM and 9.0–350.0 µM, respectively. The decreasing of sensitivity (slope) of the second linear segment is likely due to kinetic limitation. On the other hand, the responses were linear with the PL concentration at the range from 0.5 to 500.0 µM and the current sensitivity was 0.0195 µA/µM−1, while the dynamic range was linear with the ST concentration at the range from 0.7 to 400 µM and the current sensitivity was 0.0308 µA/µM−1. The detection limits were determined as 0.04 µM for HX; 0.1 µMfor PL and 0.3 µMfor ST based on YLOD = YB+3σ.
3.5 Simultaneous determination of HX, PL and ST
processes of HX, PL and ST at the DMBQ/ZnO/CNTs/CPE are independent and therefore, simultaneous measurements of the three analytes are feasible without any interference (Fig. 7).
Figure 7. The plots of the electrocatalytic peak current as a function of HX concentration. Inset; SWVs of DMBQ/ZnO/CNTs/CPE in 0.1 MPBS (pH 8.0) containing different concentrations of HX–PL-ST in μM (from inner to outer): 0.6 + 36.5+ 20; 1.14 + 65.4+ 40.0; 3.3 + 126.0+109.3; 5.0 + 178.0+162.0; 6.5 + 247+ 216.5; 7.5+ 300+ 250 and 9.5+ 353+ 290 µM, respectively.
3.6. Stability and reproducibility
The reproducibility and stability of DMBQ/ZnO/CNTs/CPE was investigated by SWV measurements of 10.0 M HX. The results showed that the relative standard deviation (RSD%) for five successive assays was 1.6%. In addition, the repeatability of the prepared modified electrode was checked using four different electrodes for the analysis of 10.0 M HX, using SWV. The results showed a RSD% of 2.2%. Moreover, the stability of the modified electrode was examined by storing of the electrode in the lab at room temperature. Then, the electrode was used for the analysis of 10.0
M HX using SWV. The results showed that the electrode signal retained to 97% of its initial response after two week and 93% of its initial response after 45 days. These results indicate that DMBQ/ZnO/CNTs/CPE has good stability and reproducibility, and could be used for HX measurements up to six week.
3.7. Interference study and real sample analysis
[image:11.596.97.494.127.372.2]
was taken as the maximum concentration of the foreign substances, which caused an approximately ±5% relative error in the determination. The results are shown in Table 1.
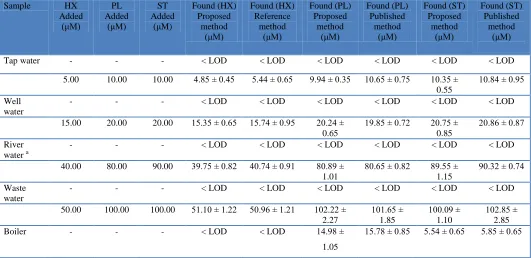
The applicability of the propose voltammetric sensor was checked with determination of HX, PL and ST in real samples such as tap water, river water, boiler water, wastewater, and well water. The determinations of HX, PL and ST in water samples were carried out using standard addition method (Table 2). The HX, PL and ST in water samples were also measured with published methods HX [2]; PL [46] and ST [5]. The results clearly demonstrate and confirm the capability of the modified electrode for the voltammetric determination of HX, PL and ST with high selectivity, accuracy, and good reproducibility.
[image:12.596.64.541.294.408.2]
Table 1. Interference study for the determination of 1.14 µM HX; 65.4 µM PL and 40.0 µM ST under the optimized conditions.
Species Tolerance limits (W/W)
Glucose, Fructose, Lactose, Sucrose, Ethanol, Methanol
1000
Na+, K+, Cs+, ClO4−, Ni2+, CN−, Ca2+, Br−, Ag+,
Zn+2, Pb+2, Mg2+, Mn+2, Co3+, Cr2+, and SCN−
800
Urea 500
Table 2. Determination of HX, PL and ST in practical samples (n=3). Sample HX
Added (μM) PL Added (μM) ST Added (μM) Found (HX) Proposed method (μM) Found (HX) Reference method (μM) Found (PL) Proposed method (μM) Found (PL) Published method (μM) Found (ST) Proposed method (μM) Found (ST) Published method (μM)
Tap water - - - < LOD < LOD < LOD < LOD < LOD < LOD
5.00 10.00 10.00 4.85 ± 0.45 5.44 ± 0.65 9.94 ± 0.35 10.65 ± 0.75 10.35 ± 0.55
10.84 ± 0.95
Well water
- - - < LOD < LOD < LOD < LOD < LOD < LOD
15.00 20.00 20.00 15.35 ± 0.65 15.74 ± 0.95 20.24 ± 0.65
19.85 ± 0.72 20.75 ± 0.85
20.86 ± 0.87
River water a
- - - < LOD < LOD < LOD < LOD < LOD < LOD
40.00 80.00 90.00 39.75 ± 0.82 40.74 ± 0.91 80.89 ± 1.01
80.65 ± 0.82 89.55 ± 1.15
90.32 ± 0.74
Waste water
- - - < LOD < LOD < LOD < LOD < LOD < LOD
50.00 100.00 100.00 51.10 ± 1.22 50.96 ± 1.21 102.22 ± 2.27 101.65 ± 1.85 100.09 ± 1.10 102.85 ± 2.85 Boiler - - - < LOD < LOD 14.98 ±
1.05
15.78 ± 0.85 5.54 ± 0.65 5.85 ± 0.65
[image:12.596.34.565.464.722.2]
4. CONCLUSION
This work demonstrates the construction of a DMBQ/ZnO/CNTs/CPE and its application in the simultaneous determination of HX, PL and ST. The novel sensor showed excellent catalytic effects on the oxidation of HX. The results showed that the oxidation of HX is catalyzed at pH 8.0 and the peak potential of HX is shifted by 810 mV to a less positive potential at DMBQ/ZnO/CNTs/CPE. Potential differences of 370, 680 and 310 mV between HX–PL, HX–ST and PL–ST were detected respectively which were large enough to determine HX, PL and ST individually and/or simultaneously. Finally, this modified electrode used for determination of HX, PL and ST in the real samples such as water and wastewater.
ACKNOWLEDGEMENT
We are grateful to the Majlesi Branch, Islamic Azad University, Isfahan, Iran and the Iranian Nanotechnology Initiative Council for their support.
References
1. http://www.piercenet.com/product/hydroxylamine-hcl; 30, May, 2014.
2. R. Sadeghi, H. Karimi-Maleh, M.A. Khalilzadeh, H. Beitollahi, Z. Ranjbarha, M.B. Pasha Zanousi, Environ. Sci. Pollut. Res. 20 (2013) 6584–6593.
3. H. Karimi-Maleh, M. Moazampour, A.A. Ensafi, S. Mallakpour, M. Hatami, Environ. Sci. Pollut. Res. 21 (2014)5879–5888.
4. Agency for Toxic Substances and Disease Registry (ATSDR). Toxicological Profile for Phenol (Update). Public Health Service, U.S. Department of Health and Human Services, Atlanta, GA. 1998.
5. H. Karimi-Maleh, A.A. Ensafi, H. Beitollahi, V. Nasiri, M.A. Khalilzadeh, P. Biparva, Ionics 18 (2012) 687–694.
6. Tedmanson, Sophie (November 5, 2009). "Doctors risk untried drug to stop babys brain dissolving". The Times (London). Retrieved May 13, 2010.
7. H.R. Zare, N. Nasirizadeh, H. Ajamain, A. Sahragard, Mat Sci Eng C 31 (2011) 975–982. 8. H.R. Zare, Z. Sobhani, M. Mazloum-Ardakani, Sens Actuators B 126 (2007) 641–647. 9. H.R. Zare, F. Chatraei, N. Nasirizadeh, J. Braz. Chem. Soc. 21 (2010) 1977–1985.
10.A.A. Ensafi, H. Karimi-Maleh, M. Keyvanfard, Intern. J. Environ. Anal. Chem., 93 (2013) 650– 660.
11.V. K. Gupta, A. K. Jain and G. Maheshwari, Talanta 72(4) (2007) 1469-1473.
12.V. K. Gupta, M. R. Ganjali, P. Norouzi, H. Khani, A. Nayak, and Shilpi Agarwal, Critical Reviews in Analytical Chemistry, 41( 2011)282–313.
13.R. N. Goyal, V. K. Gupta, S. Chatterjee, Sens. Actuators B. Chemical, 149(2010) 252-258 14.V. K. Gupta, A. K. Jain, Shiva Agarwal, G. Maheshwari, Talanta, 71(2007)1964-1968 15.R. Jain, V. K. Gupta , N. Jadon, K. Radhapyari, Analytical Biochemistry 407 (2010) 79–88. 16.V.K. Gupta,A.K . Singh, S.Mehtab, B.Gupta, Anal. Chim. Acta 566 (2006) 5–10.
17.R.N. Goyal, V.K. Gupta, S. Chatterjee, Electrochim. Acta 53 (2008) 5354–5360.
18.V.K. Gupta, A.K. Singh,M. Al Khayat, Barkha Gupta, Anal.Chim. Acta 590 (2007) 81–90. 19.V.K. Gupta, R. Prasad, R. Mangla, P. Kumar,Anal. Chim. Acta 420 (2000) 19–27.
20.R.N. Goal, V.K. Gupta, S. Chatterjee, Talanta 76 (2008) 662–668.
22.A.A. Ensafi, H. Karimi-Maleh, S. Mallakpour, M. Hatami, Sens. Actuators B 155 (2011) 464–472 23.H. Karimi-Maleh, P. Biparva, M. Hatami, Biosens. Bioelect. 48 (2013) 270–275.
24.J.B. Raoof, R. Ojani, H. Karimi-Maleh, Electroanalysis 20 (2008) 1259 – 1262
25.H. Bagheri, H. Karimi-Maleh, F. Karimi, S. Mallakpour, M. Keyvanfard, J. Mol. Liq. 198 (2014) 193–199.
26.H. Karimi-Maleh, F. Tahernejad-Javazmi, M. Daryanavard, H. Hadadzadeh, A.A. Ensafi, M. Abbasghorbani, Electroanalysis 26 (2014) 962-970.
27.H. Karimi-Maleh, M. Moazampour, H. Ahmar, H. Beitollahi, A.A. Ensafi, Measurement 51 (2014) 91–99.
28.H. Karimi-Maleh, A.L. Sanati, V.K. Gupta, M. Yoosefian, M. Asif, A. Bahari, Sens. Actuators B 204 (2014) 647–654.
29.A. Pahlavan, H. Karimi-Maleh, F. Karimi, M. Aboukazempour Amiri, Z. Khoshnama, M. Roodbari Shahmiri, M. Keyvanfard, Mat. Sci. Eng. C 45 (2014) 210-215.
30.T. Jamali, H. Karimi-Maleh, M.A. Khalilzadeh, LWT - Food Science and Technology 57 (2014) 679-685.
31.H. Karimi-Maleh, S. Mehdipour-Ataei, M. Hatami, M.A. Khalilzadeh, J. Anal. Chem, 69 (2014) 162-168.
32.M. Najafi, M.A. Khalilzadeh, H. Karimi-Maleh, Food Chem. 158 (2014) 125-131. 33.H. Beitollah, M. Goodarzian, M.A. Khalilzadeh, H. Karimi-Maleh, M. Hassanzadeh, M.
Tajbakhsh, J. Mol. Liq. 173 (2012) 137-143.
34.T. Tavana, M.A. Khalilzadeh, H. Karimi-Maleh, A.A. Ensafi, H. Beitollahi, D. Zareyee, J. Mol. Liq. 168 (2012) 69–74.
35.M. Elyasi, M.A. Khalilzadeh, Food Chem. 141 (2013) 4311–4317.
36.A.J. Bard, L.R. Faulkner, Electrochemical methods, fundamentals and applications, Wiley, New York 2001.
37.Z. Galus, Fundumentals of Electrochemical Analysis, Ellis Horwood, New York 1976 38.A.A. Ensafi, H. Karimi-Maleh, J. Electroanal. Chem. 640 (2010) 75–83
39.H. Karimi-Maleh, M. Moazampoura,V.K. Gupta, A.L. Sanati, Sens. Actuators B 199 (2014) 47–53. 40.A.A. Ensafi, E. Khoddami, B. Rezaei, H. Karimi-Maleh, Coll. Surf. B 81 (2010) 42–49.
41.H. Karimi-Maleh, F. Tahernejad-Javazmi, A.A. Ensafi, R. Moradi, S. Mallakpour, H. Beitollahi, Biosens. Bioelect. 60 (2014) 1–7.
42.H. Karimi-Maleh, A.A. Ensafi, H.R. Ensafi, J. Braz. Chem. Soc. 20 (2009) 880-887.
43.H. Yaghoubian, H. Karimi-Maleh, M.A. Khalilzadeh, F. Karimi, Int. J. Electrochem. Sci., 4 (2009) 993 – 1003.
44.M. Keyvanfard, M. Tahmasbi, H. Karimi‐Maleh, K. Alizad, Chin. J. Catal. 35 (2014) 501–508. 45.R. Moradi, S.A. Sebt, H. Karimi-Maleh, R. Sadeghi, F. Karimi, A. Bahari, H. Arabi, Phys. Chem.
Chem. Phys. 15 (2013) 5888—5897.
46.M. Wada, S. Kinoshita, Y. Itayama, N. Kuroda, K. Nakashima, J. Chromatogr. B 721 (1999)179– 186.