CONVERSION OF ETCH-AND-RINSE AND SELF-ETCH
ADHESIVE SYSTEMS USING QTH AND LED LIGHT
CURING UNITS – AN IN VITRO STUDY
A Dissertation submitted
in partial fulfilment of the requirements
for the degree of
MASTER OF DENTAL SURGERY
BRANCH – IV
CONSERVATIVE DENTISTRY AND ENDODONTICS
THE TAMILNADU DR. MGR MEDICAL UNIVERSITY
CHENNAI – 600 032
This is to certify that Dr.UMA MAHESWARI.S, Post Graduate student (2010 - 2013) in the Department of Conservative Dentistry and Endodontics, has done this dissertation titled “COMPARATIVE EVALUATION OF DEGREE OF CONVERSION OF ETCH-AND-RINSE AND SELF-ETCH ADHESIVE SYSTEMS USING QTH AND LED LIGHT CURING UNITS- AN IN VITRO STUDY” under our direct guidance and supervision in partial fulfillment of the regulations laid down by The Tamil Nadu Dr. M.G.R. Medical University, Guindy, Chennai – 32 for M.D.S., in Conservative Dentistry and Endodontics (Branch IV) Degree Examination
Department of Conservative Dentistry and Endodontics Tamilnadu Government Dental College and Hospital
Chennai – 600 003
Dr. K.S.
G.A. NASSER
PRINCIPAL
Tamilnadu Government Dental College and Hospital
Dr. M. Kavitha
Professor & HOD
I wish to place on record my deep sense of gratitude to my mentor Dr. M. KAVITHA MDS., for the keen interest, inspiration, immense help and expert
guidance throughout the course of this study as Professor & HOD of the Department of Conservative Dentistry and Endodontics, Tamilnadu Govt. Dental College and Hospital, Chennai.
It is my immense pleasure to utilize this opportunity to show my heartfelt gratitude and sincere thanks to Dr. S. JAIKAILASH MDS., D.N.B. Professor & Guide of the Department of Conservative Dentistry and Endodontics, Tamilnadu Govt. Dental College and Hospital, Chennai for his guidance, suggestions, source of inspiration and for the betterment of this dissertation.
I sincerely thank Dr. B. RAMA PRABHA MDS, Professor for her support and encouragement throughout this dissertation.
I take this opportunity to convey my everlasting thanks and sincere gratitude to Dr. K.S.G.A. NASSER MDS., Principal, Tamilnadu Government Dental College and Hospital, Chennai for permitting me to utilize the available facilities in this institution.
I am extremely grateful to Mr.R.Shankar, Project Associate, Sophisticated Analytical Instrumental Facility (SAIF), IIT, Chennai for his unconditional
support to make this study feasible.
I sincerely thank Dr. K. Amudha Lakshmi MDS., Dr. G. Vinodh MDS., Dr. D. Aruna Raj MDS., Dr. Nandhini M.D.S., Dr. Shakunthala M.D.S., and
Dr. Sharmila M.D.S., Assistant Professors for their suggestions, encouragement and
guidance throughout this study.
I specially thank, Dr.S.Ravanan, MBA, PhD, Data manager, Biostatistician for all his statistical guidance and help.
My sincere thanks to Mr.D.Krishnamoorthy, Librarian, Tamilnadu Government Dental College & Hospital, Chennai for providing me the articles needed for my study.
I whole heartedly wish to thank my mother for her patience, constant support
and encouragement in every step of my dissertation.
TITLE OF DISSERTATION
COMPARATIVE EVALUATION
OF DEGREE OF CONVERSION
OF ETCH-AND-RINSE AND
SELF-ETCH ADHESIVE
SYSTEMS USING QTH AND LED
LIGHT CURING UNITS- AN IN
VITRO STUDY
PLACE OF THE STUDY
TAMIL NADU GOVERNMENT
DENTAL COLLEGE &
HOSPITAL, CHENNAI – 3.
DURATION OF THE COURSE
3 YEARS
NAME OF THE GUIDE
DR. S. JAIKAILASH
HEAD OF THE DEPARTMENT
DR. M. KAVITHA
I hereby declare that no part of dissertation will be utilized for gaining financial assistance or any promotion without obtaining prior permission of the Principal, Tamil Nadu Government Dental College & Hospital, Chennai – 3. In addition I declare that no part of this work will be published either in print or in electronic media without the guide who has been actively involved in dissertation. The author has the right to preserve for publish of the work solely with the prior permission of Principal, Tamil Nadu Government Dental College & Hospital, Chennai - 3.
This agreement herein after the “Agreement” is entered into on this day Dec 2012 between the Tamil Nadu Government Dental College and Hospital represented by its Principal having address at Tamil Nadu Government Dental College and Hospital, Chennai - 600 003, (hereafter referred to as, ‘the college‘)
And
Mr. Dr. S. Jaikailash aged 38 years working as Professor in Department of Conservative Dentistry & Endodontics at the college, having residence address at T1, Vinoth Vetri Apartments, 37, Govindan Street, Ayavoo Colony, Aminjikarai, Chennai - 29(herein after referred to as the Principal Investigator‘)
And
Miss.S.Uma Maheswari aged 36 years currently studying as Post Graduate student in Department of Conservtive Dentistry & Endodontics, Tamilnadu Government Dental College and Hospital, Chennai - 3 (herein after referred to as the PG student and co- investigator‘).
Whereas the PG student as part of her curriculum undertakes to research on COMPARATIVE EVALUATION OF DEGREE OF CONVERSION OF ETCH-AND-RINSE AND SELF-ETCH ADHESIVE SYSTEMS USING QTH AND LED LIGHT CURING UNITS-AN IN VITRO STUDY for which purpose the Principal Investigator shall act as principal investigator and the college shall provide the requisite infrastructure based on availability and also provide facility to the PG student as to the extent possible as a Co-investigator
Whereas the parties, by this agreement have mutually agreed to the various issues including in particular the copyright and confidentiality issues that arise in this regard.
Now this agreement witnesseth as follows
1. The parties agree that all the Research material and ownership therein shall become the vested right of the college, including in particular all the copyright in the literature including the study, research and all other related papers.
2. To the extent that the college has legal right to do go, shall grant to licence or assign the copyright so vested with it for medical and/or commercial usage of interested persons/entities subject to a reasonable terms/conditions including royalty as deemed by the college.
3. The royalty so received by the college shall be shared equally by all the three parties.
the confidential information or, know-how to anyone in any manner whatsoever and for any purpose without the express written consent of the college.
6. All expenses pertaining to the research shall be decided upon by the Principal Investigator/Coinvestigator or borne solely by the PG student. (co-investigator)
7. The college shall provide all infrastructure and access facilities within and in other institutes to the extent possible. This includes patient interactions, introductory letters, recommendation letters and such other acts required in this regard.
8. The Principal Investigator shall suitably guide the Student Research right from selection of the Research Topic and Area till its completion. However the selection and conduct of research, topic and area of research by the student researcher under guidance from the Principal Investigator shall be subject to the prior approval, recommendations and comments of the Ethical Committee of the College constituted for this purpose.
9. It is agreed that as regards other aspects not covered under this agreement, but which pertain to the research undertaken by the PG student, under guidance from the Principal Investigator, the decision of the college shall be binding and final.
10. If any dispute arises as to the matters related or connected to this agreement herein, it shall be referred to arbitration in accordance with the provisions of the Arbitration and Conciliation Act, 1996.
In witness whereof the parties hereinabove mentioned have on this the day month and year herein above mentioned set their hands to this agreement in the presence of the following two witnesses.
College represented by its Principal PG Student
Witnesses Student Guide
1.
CONTENTS
S. No
Title
Page
No.
1.
INTRODUCTION
1
2.
AIM AND OBJECTIVES
4
3.
REVIEW OF LITERATURE
5
4.
MATERIALS AND METHODS
23
5.
RESULTS
31
6.
DISCUSSION
44
7.
SUMMARY
57
8.
CONCLUSION
59
9.
BIBLIOGRAPHY
60
TABLE NO.
TITLE Page No.
I DC of conversion of GROUP I (PRIME & BOND NT) immediately after curing and after 1 week of dry storage
32
II
DC of conversion of GROUP II (BEAUTI BOND) immediately after curing and after 1 week of dry storage
32
III Degree of conversion of GROUP III (ADPER EASY ONE) immediately after curing and after 1 week of dry
storage 33
IV
Degree of conversion of GROUP IV (XENO V) immediately after curing and after 1 week of dry
storage 33
V One way ANOVA for Degree of Conversion 34
VI TUKEY’S HSD Post-hoc MULTIPLE COMPARISON TEST for degree of conversion 34
VII PAIRED t TEST for GROUP I 38
VIII PAIRED t TEST for GROUP II 38
IX PAIRED t TEST for GROUP III 39
LIST OF GRAPHS
Graph No. Title Page No.
I DC for QTH unit immediately and after 1 week of dry storage
41
II
DC for LED unit immediately and after 1 week of dry
storage 42
Aim :
To determine the degree of conversion of one etch-and- rinse adhesive and three one-step self-etch adhesives for LED and QTH light cure units by Fourier Transform Infrared Spectroscopy (FTIR) analysis, immediately after curing and after one week of dry storage.
Materials and Methods:
A constant volume (0.01ml) of adhesive applied on the surface of the prepared KBr pellet. The adhesives were divided into 4 groups each containing 20 samples. Group I (Prime & Bond NT), Group II (Beauti Bond),Group III (Adper Easy One) and Group IV (XenoV).The samples were light cured with LED and QTH light cure units with a constant distance of 5mm from the pellet surface - 10 samples per light source in each group. The degree of conversion was calculated using the formula
Degree of Conversion = (1 – R cured / R uncured) X 100
Where, R is the ratio of aliphatic and aromatic peak intensities at 1639 cm-1 and 1609 cm-1 in cured and uncured BisGMA-based systems and the ratio of aliphatic and carbonyl peak intensities at 1639 cm-1 and 1720 cm-1 in non-BisGMA-based systems. Statistical analysis was performed using one way ANOVA test, followed by Post-hoc multiple comparisons by Tukey’s HSD test and paired t test.
Results:
LED showed higher degree of conversion than QTH unit in all the groups. Group IV (XenoV )showed the highest DC. Group I (Prime & Bond NT) (etch-and-rinse) and Group III (Adper Easy One) showed no statistically significant difference in DC and Group II (Beauti Bond) the least degree of conversion. There is increase in degree of conversion after 1 week of dry storage in all the groups.
Conclusions:
The combination of “bonding agent and curing unit” had a significant effect on degree of conversion. The more efficient curing regime of LED unit and the better performance of one-step self-etch adhesives can be considered advantageous in clinical practice.
Adhesion or bonding is the process of forming an adhesive joint, which consists of two substrates joined together. Dental adhesives are resin monomers solutions that join a restorative material with a dental substrate after the polymerization of monomers.
The ultimate goal of a bonded restoration is to attain an intimate adaptation of the restorative material with the dental substrate.5 This task is difficult to achieve as the bonding process for enamel is different from that of dentin. The dentin which is humid and organic in nature makes bonding to this hard tissue extremely difficult.
When tooth structure is cut with a bur or other instrument, the residual components form a ‘‘smear layer’’ of debris on the surface.67 As the smear layer
constitutes a true physical barrier, it must be dissolved or made permeable so that the monomers in the adhesives can contact the dentin surface directly. Though different classifications of adhesive systems exist, the current adhesion strategies depend exclusively on how dental adhesives interact with this smear layer. One such strategy involves Etch-and-Rinse adhesives, through etching with a separate acid gel which remove the smear layer and superficial hydroxyapatite. The second strategy involves Self-etch adhesives, which make the smear layer permeable without removing it completely.
chemical or light-induced polymerization of monomers. The quality of the final polymer network of resin-based composites and adhesive systems has a significant effect on the properties of these restorations and their clinical performance. The overall effect of incomplete polymerization may result in materials with less than optimal clinical performance as well as the elution of components which may have an adverse effect on local and systemic functions. In addition, the adhesive-dentine interface is recognized as important in maintaining the integrity of resin-based composite restorations. In vitro studies have indicated a good relationship between degree of conversion (DC) and the mechanical properties of the adhesive with strength of bonding to tooth tissues.4,22,45 A high degree of conversion may also reduce permeability at the bonding assembly, increasing the resistance to degradation.7 Incomplete polymerization of adhesive monomers has been speculated as one of the reasons for the occurrence of nanoleakage.58
Quartz-tungsten-halogen bulbs have been used for many years as the light source to light-activate visible-light cured composite resins. Blue light emitting diode (LED) technology has been indicated as an alternative to conventional halogen lights.
Transform Infrared Spectroscopy),EPR (electron paramagnetic resonance), NMR
(nuclear magnetic resonance), DSC (differential scanning calorimetry) and
DTA(differential thermal analysis)to determine degree of conversion of resins, FTIR
has been proven to be an useful technique and also it has been used as a reliable method.42Improved optics and internal laser reference for automatic calibration have increased the sensitivity and accuracy of FTIR spectrometers.
AIM:
To determine the degree of conversion of Etch-and-Rinse (Prime&Bond NT) and self- etch adhesive systems (Beauti Bond, Adper Easy One, Xeno V) with LED and QTH light curing units.
OBJECTIVES:
9 To determine the degree of conversion of etch-and-rinse (one bottle system) and self-etch adhesive systems (one bottle system) using Fourier Transform Infra Red Spectroscopy (FTIR) immediately after curing with LED and QTH light curing units.
REVIEW OF LITERATURE
Loshaek & Fox (1953)52 used polymerization contraction, as a method to determine DC, is based on the fact that the number of converted methacrylate groups is the main factor determining contraction. It measures the vertical displacement of an aluminium disc due to the polymerization contraction of the resin sample in a linometer device. The linear displacement is then converted to volumetric contraction based on the assumption that the contractions are isotropical. Subsequently, the “conversion of methacrylates” is calculated using the molar volume of complete conversion and the molar volume of the sample.
Wertz (1972)95a conducted ESR is a technique for chemical analysis of substances, such as free radicals, with one or more unpaired electrons which is associated with molecular paramagnetism. Electron transitions can be induced between spin states by applying a magnetic field and then supplying electromagnetic energy, usually in the microwave range of frequencies. The resulting absorption spectra are based on the principle that resonant frequencies for a particular substance are directly proportional to the strength of the applied magnetic field.
Ruyter & Svendsen (1978)70 suggested the term ‘remaining methacrylate groups’ and calculated as a ratio between the IR absorbance bands of aliphatic and aromatic C=C double bonds before and after polymerization.
carbon-carbon double bonds, probably as synonyms to refer to monomer conversion to polymers.
Chung and Greener (1988)17 analysed the infrared spectra of seven commercially available posterior composite resins were analysed by ratioing the C = C aliphatic peak to the C = C aromatic peak. The degree of conversion ranged from 43.5 to 73.8%. The result was similar to the range previously obtained from unfilled Bis-GMA based resins and commercial anterior composites.
Venhoven (1993)91 studied the effect of diluting monomers (TEGDMA,
MMA and HPMA) on the polymerization contraction and monomer conversion of BisGMA-based resin mixtures. The results showed that the conversion of methacrylates increased with the increasing amount of diluents, irrespective of their type.
the molar C=C content and resin density of their products, researchers would only need to determine weight differences between dry and water-immersed cured material in order to calculate the DC.
Additionally, the results of this study showed no correlation between the amount of TEGDMA and DC in thin samples whereas the amount of TEGDMA in excess of 5 mol% resulted in significant decrease in DC in bar-shaped samples.
Imazato et al.(1997)42a studied the effect of an antibacterial monomer, MDPB, on the antibacterial activity, DC and tensile bond strength of an experimental adhesive mixture . MDPB was added in 2%, 4% or 10% concentrations to the primer of the two-step self-etch adhesive system (LB Bond, Kuraray) and the final concentrations after mixing of primer and bond were 1%, 2% or 5%. Spectra were taken immediately after curing of the primer-bond mixture placed on a potassium bromide disc of the FTIR spectrometer. Antibacterial activity against Streptococcus mutans was shown to be significantly higher in the system containing MDPB than in the control system without MDPB. The DC values were 66-69% and 61-65% and no significant differences were observed between the groups with various amounts of MDPB and the controls. Bond strength values were comparable between experimental resin mixtures and controls in both studies. The authors suggested that MDPB could increase the antibacterial potential of dentine primers without an adverse effect on DC and bond strength.
radicals gradually increased with irradiation time but decreased with the addition of primers.
McClelland (1998)52a used PAS-IR, part of the IR incident light is absorbed
by the sample and converted to thermal energy which diffuses towards the sample surface. Sound pressure waves are generated at the surface and captured by a high-sensitivity microphone. The detected signal is converted into a conventional IR spectrum.
Eliades et al.(2000)26 reported the highest DC values for a dual-cured
adhesive, followed by a light-cured one whereas a chemically-cured adhesive showed the lowest DC.
Imazato (2001)42 calculated the DC of experimental RBCs containing various amounts of TEGDMA and fillers using DTA and compared these values with those obtained by FTIR spectroscopy. Essentially, this method is the same as previously reviewed DSC. DTA resulted in slightly greater DC values (3-10%) compared to FTIR values. The authors attributed these differences to the method of DC calculation as well as to the theoretical assumption that the heat of conversion of C=C double bonds is the same for all methacrylate monomers. Furthermore, they suggested that possible reflection of the incident light at the bottom of the thermal chamber could result in an augmenting effect.
means that 60% of C=C bonds are converted leaving 40% of C=C bonds and not 40% of the monomer unreacted.
Calheiros et al (2004)14 used PAS-IR to determine the DC of two hybrid and two micro-filled RBCs. The DC values were between 15% and 45% for both RBCs irrespective of the applied light energy density. The authors attributed the lower DC values in this study compared to other studies to lower sensitivity of PAS-IR compared to other spectroscopic methods, particularly FTIR and Raman.
Bang et al. (2004)6 reported a positive correlation between the DC and
polymerisation shrinkage in three orthodontic adhesives cured with a conventional halogen LCU but not with a plasma arc LCU. The conventional halogen LCU produced higher DC values in all adhesives than the plasma arc LCU.
Bouschlicher et al. (2004)8 reported that as a measure of conversion, bottom-top ratio of KHN was approximately 2.5 times more sensitive than the bottom-bottom-top DC ratio. They stated that KHN alone cannot indicate the differences in monomer conversion in different RBCs due to variables, such as filler content. However, they concluded that the relationship between the bottom-top ratios of KHN and DC is independent of the filler content.
Yamada et al.(2004)98 who published the first paper on commercial adhesive
agents from different manufacturers were used consecutively, μTBS and DC decreased in some cases.
Kim et al.(2005)49 investigated the effect of hydrophilic nanofillers on the DC
and mechanical properties of ethanol-based experimental adhesive mixtures containing BisGMA, HEMA and 4-META. The nanofillers were added up to 3 wt% and FTIR spectra were taken immediately after curing on potassium bromide discs. Though DC values were comparable for all groups irrespective of the presence of nanofillers, mechanical properties showed inconsistent values so it was concluded that hydrophilic nanofillers did not improve the adhesive formulation.
Wunderlich (2005)96a used DSC which is a calorimetric technique based on the assumption that heat generated during resin polymerization is proportional to the percentage or concentration of reacted monomers.
Bae et al.(2005)4 studied the effect of BisGMA on the DC and mechanical properties of an experimental adhesive system. A series of adhesive mixtures were prepared containing 20/80 to 80/20 wt% of BisGMA and TEGDMA, placed on a potassium bromide disc, covered with a Mylar strip and cured for 20 s. Scotchbond Multipurpose was used as a control. FTIR spectra were taken immediately after curing and after 48 h of dark storage in air at an unstated temperature. The highest DC was found in the mixtures containing 30-50 wt% of BisGMA and was comparable to the commercial adhesive. The DC of all mixtures increased after storage. The authors suggested that high DC associated with better mechanical properties was due to the high molecular weight and cross-linking potential of BisGMA. However, extreme amounts of BisGMA may restrict monomer reactivity due to high viscosity resulting in lower DC and inferior mechanical properties.
Cadenaro (2005)13 compared a three-step and two-step etch-and-rinse and two step and one-step self-etch commercial adhesive systems using DSC, lower DC and higher permeability values were found in two-step etch-and-rinse and one-step self-etch adhesives. Curing times, beyond manufacturers’ recommended times, improved polymerization and reduced permeability of these adhesive systems.
Dickens & Cho (2005)22 investigated the DC, mechanical properties and residual acetone content of experimental adhesive systems containing various amounts of PMGDM and HEMA. The adhesive was placed in three increments in 1 mm deep moulds and in one increment in 0.52 mm deep moulds held between two glass slides and cured through the top slide. FTIR spectra were taken immediately after light curing and after 48h of dark storage.
No differences in the DC were observed in bulk adhesives with different initial acetone content. Significantly higher DC was found for 60 s curing time and 48 h of dark storage. The DC decreased significantly with increasing initial acetone content in thin films. Computer simulation showed that residual acetone content depended on sample thickness. In thin films, the adhesive with the highest initial acetone concentration gave the least residual acetone content after drying, whereas the opposite was observed for bulk adhesives. The authors concluded that solvent removal from adhesive systems is a diffusion-controlled process dependent on solvent nature and amount as well as the thickness of the adhesive layer.
Usumez et al. (2005)89 showed that plasma arc, high power halogen and LED
was also affected by their chemical composition but the authors offered no conclusive statement as to what caused the differences in the two tested materials.
Cadenaro (2006)12 studied the effect of dentin bleaching on DC in commercial adhesive systems and concluded that Hydrogen peroxide, as a bleaching agent, had an adverse effect on the DC whilst storage in 100% humidity at 37°C resulted in increased DC.
Wang (2006)94 studied the effect of water and initiator systems on the polymerisation kinetics was studied in HEMA-based In this study, co-initiators DHEPT, DMAEMA, NPG or DPIC were added to water-based HEMA/CQ mixtures. The adhesive was placed on a glass slide,covered with a Mylar strip and cured for 40 s using a halogen LCU and micro-Raman spectra were taken immediately after curing. The differences in polymerization and reactivity of HEMA were observed for different co-initiators. Unlike DHEPT, NPG and DMAEMA were compatible with HEMA. DPIC had an accelerating effect on the polymerization rate. Though CQ/DHEPT is used commonly in adhesive systems, this combination did not initiate HEMA polymerization. Water had an adverse effect on polymerization.
and increased with longer curing times. A negative correlation was observed between the DC and the thickness of the OIL. μTBS obtained after adhesive and RBC application to dentine discs decreased with longer curing times. The lowest bond strength values were observed in the group with no OIL i.e. where the adhesive systems were cured through a Mylar strip. The authors concluded that an OIL with an adequate thickness is necessary for satisfactory μTBS and that manufacturers’ recommended times should be followed.
Kanehira et al.(2006)45 correlated the DC of seven all-in-one adhesive systems with their shear bond strength (SBS). SBS of human enamel samples restored with an adhesive and a hybrid RBC was measured. The DC was calculated from a different set of samples which were prepared by applying the adhesive and RBC to the ATR accessory crystal. FTIR spectra were taken immediately after polymerization and 10 min, 1 h, 2 h and 24 h thereafter. The DC increased with time after polymerization in all adhesive systems. The DC values varied significantly from 50% to 75% immediately after polymerization and from 66% to 94% after 24 h. No definite conclusion regarding the differences in DC among adhesive systems could be made due to large variations in adhesive chemical composition. A linear relationship between DC and SBS was found for all adhesive systems.
correlation was observed between the curing distance and DC. SBS was measured on a different set of samples, which were prepared by applying the adhesive and a hybrid RBC to dentin discs. The same relationship was observed between the curing distance and SBS as it was observed for the curing distance and DC. It was concluded that a decrease in radiant exposure, due to the increasing distance, could be compensated by longer curing times. Curing times of 40-60 s were proposed for curing adhesives in deep and proximal cavities.
Ogliari et al. (2006)64 studied the effect of a new co-monomer ETMA on the DC and bond strength of adhesive resins. In this study, 0.1 wt%, 1 wt% and 10 wt% of ETMA was added to a BisGMA/HEMA adhesive system (Scotchbond Multipurpose, 3M ESPE). FTIR measurement was done after 24 h of dark, dry storage. μTBS was evaluated on a different set of samples, prepared by applying the adhesive and a micro-hybrid RBC to human dentine discs. ETMA resulted in 64 comparable DC but significantly higher μTBS than the control.
Santos et al. (2007)74 reported that the depth of cure was greater after light curing RBC samples with a QTH compared to an LED LCU. They identified a relatively uniform and slow decrease in hardness and DC with a sudden drop for both characteristics at 4 mm for the QTH and 3 mm for the LED LCU.
Breschi et al. (2007)10 correlated the permeability and polymerization kinetics of adhesives after exposure to different LED LCUs. DSC measurements showed that the rate of polymerization increased with longer curing times in all adhesives. An inverse correlation was reported between the rate of polymerization and permeability of adhesives.
Lim & Lee (2007)51 showed that the DC of orthodontic adhesives was affected by the reflectance of the background teeth and not the diffuse light transmittance of orthodontic brackets. The DC was affected by the types of adhesives, brackets, LCUs and curing protocol.
D’Alpino et al.(2007)21 also studied the effect of LCUs on polymerization kinetics and the DC of a two-step etch-and-rinse adhesive system containing nanofiller particles (Adper Single Bond, 3M ESPE) using FTIR spectroscopy. The adhesive was applied to the ATR accessory crystal and cured for 10 s using a conventional halogen, an LED or a plasma arc LCU. The LED LCU produced the highest and the plasma arc the lowest DC values and polymerization rates.
of the adhesive applied to potassium bromide pellet with no Mylar strip and after a week of storage in distilled water. The halogen LCU produced higher DC values in both adhesive systems, immediately after curing and after one week of storage. The initial DC values were around 27-35% and after storage increased to 50-56%. Though the self-etch adhesive showed initially lower DC, the DC of both systems was comparable after storage.
Ye et al.(2007)38 studied the effect of LCU types and irradiance on the polymerization kinetics and the DC of a two-step etch-and-rinse (Single Bond, 3M ESPE) and two all-in-one self-etch adhesive systems (One-Up Bond F, Tokuyama; Adper Prompt, 3M ESPE) using ATR-FTIR with a real-time spectrum collector. The samples were placed on ATR accessory crystals and cured with either a halogen and or an LED LCU for 10 s, 20 s or 40 s. The real-time spectrum collector allowed continuous collection of IR spectra during polymerization. The highest initial polymerization rate and highest DC were found in the etch-and-rinse system with least solvent. Higher light irradiance accelerated curing kinetics and the resulting DC in all three systems. Adper Prompt showed the lowest DC values for all curing times, 11-20% after 10 s and 35-63% after 40 s.
Faria e Silva et al. (2007)31 studied the DC of a dual-cured resin cement (RelyX ARC, 3M ESPE) related to the fiber post translucency. In this study, micro-Raman spectra were taken from the top, middle and apical areas in a simulated root canal after 24 h of storage. In the latter study, a real-time spectrum collector was used to obtain FTIR spectra from adhesives applied to ATR accessory crystals. Spectra were taken continuously up to 5 min after the start of polymerization. The translucent fiber post produced higher DC values at all depths than the non-translucent one. The DC decreased with increasing depth in the root canal irrespective of the type of fiber posts.
Faria-e-Silva (2008)32 reported the DC of light-cured, dual-cured and chemically-cured adhesive systems ScotchBond Multipurpose and Prime&Bond NT (Dentsply De Trey) were compared. In this study, light cured and dual-cured adhesive systems showed rapid polymerization during the first 30s. After 5 min, the DC was around 60% for Scotchbond Multipurpose and 50% for Prime&Bond NT. Chemically-cured Scotchbond Multipurpose showed very slow polymerization reaction and the DC of around 40% after 5 min, whereas chemically cured Prime&Bond NT showed no reaction for the entire observation period.
Sadek et al. (2008)71 correlated early and 24 h bond strength and DC of
then after 1 h and 24 h dark storage in air at 37°C. μTBS was measured on a different set of samples, prepared by applying the adhesive and a micro-filled RBC to human dentin discs. No correlation was found between the DC and μTBS. The DC was in the following order: Clearfil SE Bond (81- 87%) > Scotchbond Multipurpose (77-81%) > Scotchbond 2 (60-65%) > Adper Prompt L-Pop (37-42%). The authors concluded that very limited ‘dark’ cure occurred within 24 h in the studied adhesive systems.
Cadenaro (2008)11 studied the effect of hydrophilicity and solvent content on the Ep of experimental adhesive systems. Low DC values were found in experimental adhesive systems with the solvent in excess of 50 wt%. Although the authors claimed that resin hydrophilicity had an influence on the DC , this remains unclear since the adhesive systems contained different monomer compositions rather than different percentages of the same hydrophobic/hydrophilic components.
Guo et al.(2008)36 studied the effect of water and initiator systems on the polymerization kinetics in BisGMA/HEMA-based experimental adhesive systems and concluded that water significantly reduces polymerization but suggested that this may be compensated by the addition of onium salts. In this study, DMAEMA, EDMAB or DPIHFP were added as co-initiators in water-based BisGMA/HEMA/CQ mixtures. Real-time FTIR measurements were used to monitor polymerization. The results confirmed that the onium salt significantly improves polymerization kinetics and DC.
initial monomer to polymer conversion. However, it is accepted that this term may be ambiguous in certain cases, and it is suggested that, for clarity, the ‘double bonds’ are specifically defined in every case. Furthermore, the term ‘C=C double bonds’ may be inappropriate in resin-based materials, such as Filtek Silorane, which have a different chemical composition and whose polymerization is based on the opening of C-O-C rings and not C=C double bonds.
Jose et al.(2011)43 investigated the effect of a desensitizer on the degree of conversion of two bonding resins using Fourier transform infrared (FTIR) spectroscopy. An etch-and-rise bonding resin and a self-etching adhesive resin were selected for the study. Vivasens (Ivoclar Vivadent) was used as the desensitizing agent. Grouping was done as follows: Group I: Adper Single Bond (n=10), Group II:
Adper Single Bond + Vivasens (n=10), Group III: AdheSE One (n=10), Group IV:
AdheSE One + Vivasens (n=10). The bonding resin alone was light cured for 20
seconds in groups I and III. For groups II and IV, 1 ml each of the bonding resin and the desensitizer was mixed in a vial and light cured for 20 seconds. The specimens were analysed using FTIR spectroscopy and concluded that the degree of conversion is increased when a dentin bonding agent is used along with a desensitizer. Hence, this combination can be recommended to effectively control postoperative sensitivity.
23
MATERIALS AND METHODS
ARMAMENTARIUM
I. FOR EVALUATION OF DEGREE OF CONVERSION
9 PerkinElmer Spectrum One FTIR spectrometer (PerkinElmer Co, Massachusetts,
USA)
9 Spectrophotometric-grade KBr (Potassium Bromide)
9 Agate Mortar and pestle for KBr powder grinding
9 Stainless steel die to prepare KBr pellet
9 KBr pellet pressing machine
9 Tweezers
9 Micro pipette
9 Teflon tube with diameter of 11 mm and height of 5mm
9 Applicator tips
II. EXPERIMENTAL MATERIALS :
LIGHT CURE UNITS USED:
LIGHT
CURE UNIT
COMPANY INTENSITY
WAVELENGTH
Satelec MINI
LED
light curing
unit
Acteon Group
Ltd
,
Norwich
UK
1250 mW/cm² ±
10%
420 - 480 nm
Peak wavelength :
455 – 465 nm
CU 100 A
QTH light
curing unit
Rolence
Enterprise Inc
.
Chung Li ,
Taiwan
24
BONDING AGENTS:
TYPE ADHESIVE SYSTEMS COMPOSITION MANUFACTURER
Etch-and- Rinse one bottle system Prime&Bond NT PENTA
Di& trimethacrylate resins
Cetylamine hydrofluoride
UDMA
Silica colloidal
Solvent: acetone
Dentsply DeTrey, Konstanz, Germany one-step self-etch, one-bottle Beauti Bond Bis-GMA TEGDMA
Carboxylic acid monomer
Phosphoric acid monomer
Acetone
Water
Shofu, Kyoto, Japan
one-step self-etch, one-bottle Adper Easy One Bis-GMA HEMA Ethanol Water
Phosphoric
Acid-6-Methacryloxy-Hexylesters
Silane Treated Silica
1,6-Hexanediol Dimethacrylate,
Copolymer Of Acrylic And Itaconic Acid
(Dimethylamino)Ethyl
Methacrylate
Camphorquinone
2,4,6trimethylbenzoyldiphenylph
osphine Oxide (TPO)
3M ESPE, St Paul, MN, USA
one-step self-etch, one bottle
Xeno V
Bifunctional acrylic amides
Acidic acrylic amides
Inverse functionalized
phosphoric acid ester
Acrylic acid
Water
Tertiary butanol
Initiator&coinitiator butylated
benzene
Stabilizer
METHODOLOGY:
FTIR SAMPLES PREPARATION:
Two Strategies of adhesive systems were chosen.
A) Etch-and-Rinse - one bottle adhesive system B) Self-etch - one bottle adhesive system Two Different light curing sources
A) LED curing unit B) QTH curing unit
Distribution of the samples:
The samples were divided into 4 groups
GROUP I - PRIME & BOND NT (n=20)
GROUP II - BEAUTI BOND (n=20)
GROUP III - ADPER EASYONE (n=20)
GROUP IV - XENO V (n=20)
FTIR (Fourier Transform Infra Red) Spectrum Acquisition:
9 KBr (Potassium Bromide) pellet preparation
9 Application of adhesive systems and spectrum acquisition for both light sources.
KBr Pellet Preparation:
a) Sample grinding:
Dried, spectroquality grade KBr is used as the matrix. Approximately 100mg of KBr powder was thoroughly ground in a dry agate mortar and pestle for 3-5 minutes until the resulting powder is like talc.
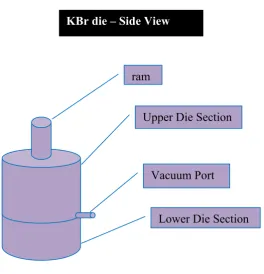
[image:37.595.184.449.429.704.2]
Figure. 1 ram
Upper Die Section
Vacuum Port
Lower Die Section
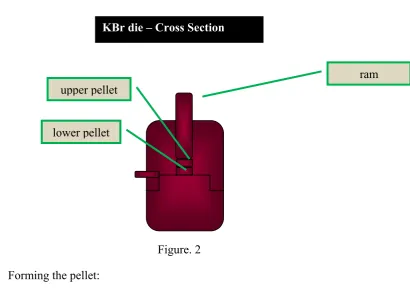
Figure. 2 b) Forming the pellet:
The die parts were wiped clean that will come in contact with the KBr powder. The upper and lower portions of the die were connected and, with the aid of the ram, the lower stainless steel die pellet was pushed into the bore in the top of the die with smooth side up.(Figure 1&2).
The grounded KBr powder was transferred into the bore and the upper stainless steel die pellet was pushed (smooth side down) into the bore. Now the powder was situated between the smooth surfaces of the upper and lower pellets.
The ram was inserted into the bore and the ram pushed down until the ram and pellets are seated at the bottom of the bore. The vacuum hose was connected to the vacuum port and the vacuum pump was turned on . After 10 minutes of evacuation, 8 to 10 tons of pressure applied for 3 to 5 minutes. The screw was tightened on the hydraulic press and repressurizing done. The vacuum pump was shut off and slowly pressure was released from the die by slowly opening the screw.
lower pellet upper pellet
ram
[image:38.595.136.547.82.372.2]The die was removed from the hydraulic press. The upper and lower die sections were separated and using tweezers the pressed KBr disk was transferred to the appropriate disk holder for FTIR analysis.
c) Application of adhesive systems and spectrum acquisition for both light sources:
For FTIR analysis of four adhesive systems, a constant volume (0.01ml) of the adhesive resin solution was placed into mixing well using fixed volume micro pipette.
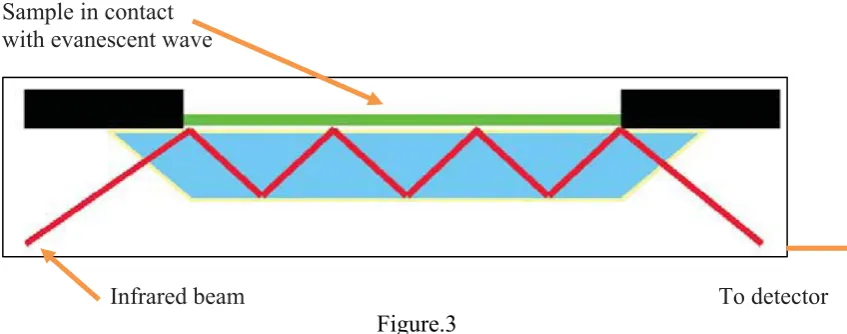
Sample in contact with evanescent wave
[image:39.595.107.531.316.483.2]Infrared beam To detector
Figure.3
tube of 5mm length which was attached to the light guide tip of both QTH and LED light curing units for standardization.
The Perkin Elmer Spectrum1 FTIR instrument consists of globar and mercury vapor lamp as sources, an interferometer chamber comprising of KBr and mylar beam splitters followed by a sample chamber and detector. In the transmission mode the infrared beam passes the sample and is detected behind the sample. Entire region of 450-4000 cm-1 is covered by this instrument. The interference pattern obtained from a two beam interferometer as the path difference between the two beams is altered, when Fourier transformed, give rise to the spectrum. The transformation of the interferogram into spectrum is carried out mathematically with a dedicated on-line computer.
Before each new set of measurements of all the samples, a baseline spectrum was obtained to determine the spectra of the artefacts used in the measurements, which would be deducted by the equipment in the subsequent monomer and polymer measurements of each specimen.
FTIR spectra was obtained using 5 scans at 4 cm-1 resolution with the frequency range of 450-4000cm-1in the transmittance mode (PerkinElmer co, Massachusetts, USA) for
1) Non polymerized adhesive solution
2) Immediately after 10-s light curing except for Beauti Bond cured for 5s in LED light source
3) After the sample storage for 1 week
INVESTIGATION DESIGN:
ADPER EASY ONE
(n=20)
(0.01ml)
XENO V
(n=20)
(0.01ml)
BEAUTI BOND
(n=20)
(0.01ml)
PRIME & BOND NT
(n=20)
(0.01ml)
FTIR ANALYSIS OF UNCURED SAMPLES
ADHESIVE (0.01 ml) PLACED ON THE PELLET SURFACE
QTH CURING FOR 10 S
FTIR ANALYSIS OF
CURED SAMPLES
DRY STORAGE FOR 1 WEEK
FTIR ANALYSIS
SPECTRA
OBTAINED
ALIPHATIC &AROMATIC /CARBONYL PEAK
INTENSITIES OBTAINED FOR CALCULATING DEGREE OF
CONVERSION
GROUP IV
GROUP I GROUP II GROUP III
LED CURING FOR 10 S (5s in group II)
ARMAMENTARIUM
LED light cure unit
Applicator tips& 5mm length Teflon tube
0.01ml micro pipette
KBr PELLET PREPARATION
Dry storage Placing the carrier into the FTIR spectrometer
31
RESULTS
Calculation of conversion:
The Degree Of Conversion (DC) of the adhesive was calculated according to the following formula:
Degree of Conversion = (1 – R cured / R uncured) X 100
R: Ratio of cured uncured specimen
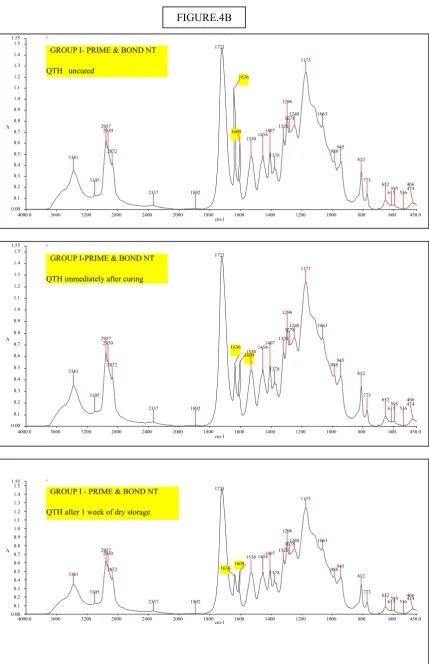
For Example: Prime & Bond NT (figure.4B)
Aliphatic peak intensity at 1639cm-1 before curing =1.1 A.U
After curing =0.56A.U
Aromatic peak intensity at 1609cm-1 before curing =0.6A.U
After curing =0.58A.U
Degree of conversion = 1 0.56/0.58 X 100
1.1/0.6
=1-0.53 =0.47 X 100 = 47%
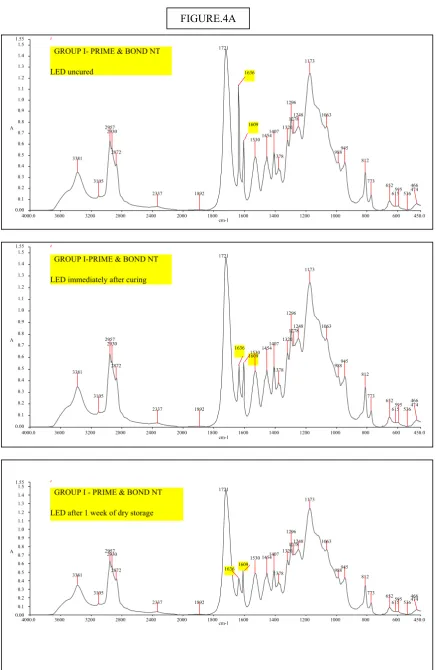
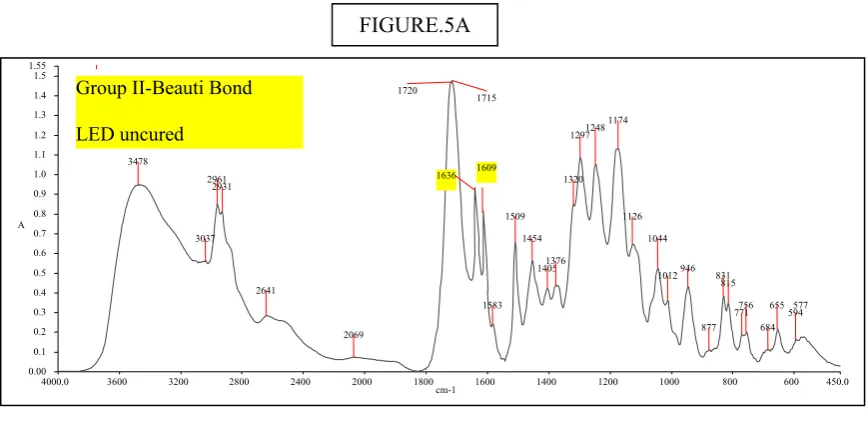
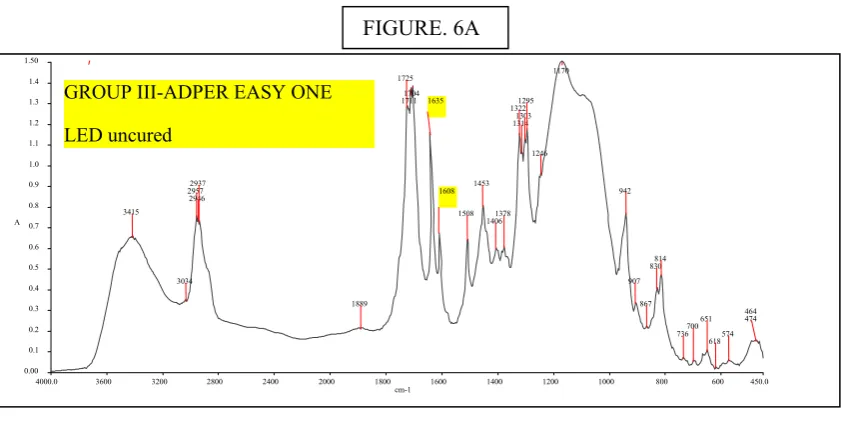
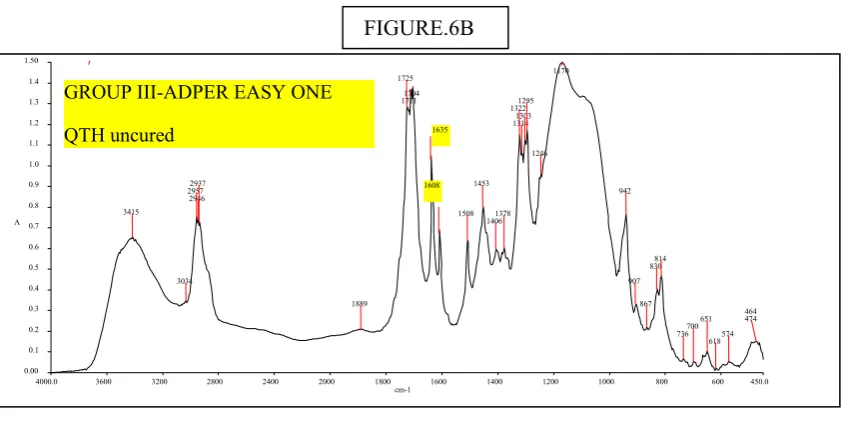
The figures 4A, 4B, 5A, 5B, 6A, 6B, 7A & 7B represent a sample spectra with wave number in X
axis(cm-1) and arbitrary unit(A.U) in Y axis of each group for which DC was calculated.
Adhesive system
PEAK INTENSITY
Aliphatic Internal standard
Aromatic Carbonyl
Bis GMA based 1639cm-1 1609cm-1
4000.0 3600 3200 2800 2400 2000 1800 1600 1400 1200 1000 800 600 450.0 0.00 0.1 0.2 0.3 0.4 0.5 0.6 0.7 0.8 0.9 1.0 1.1 1.2 1.3 1.4 1.5 1.55 cm-1 A
GROUP I - PRIME & BOND NT
LED after 1 week of dry storage
3381 3105 2957 2930 2872 2337 1892 1721 1636 1609 1530 14541407
1378 1320 1296 12781248 1173 1063
988945 812
773 652
615595536474 466 4000.0 3600 3200 2800 2400 2000 1800 1600 1400 1200 1000 800 600 450.0 0.00 0.1 0.2 0.3 0.4 0.5 0.6 0.7 0.8 0.9 1.0 1.1 1.2 1.3 1.4 1.5 1.55 cm-1 A
GROUP I-PRIME & BOND NT
LED immediately after curing
3381 3105 2957 2930 2872 2337 1892 1721 1636 16091530 14541407 1378 1320 1296 12781248 1173 1063
988945 812
773 652
615595536474 466 4000.0 3600 3200 2800 2400 2000 1800 1600 1400 1200 1000 800 600 450.0 0.00 0.1 0.2 0.3 0.4 0.5 0.6 0.7 0.8 0.9 1.0 1.1 1.2 1.3 1.4 1.5 1.55 cm-1 A
GROUP I- PRIME & BOND NT
LED uncured
3381 3105 2957 2930 2872 2337 1892 1721 1636 1609 15301454 1407 1378 1320 1296 12781248 1173 1063
988945 812
773 652
[image:47.595.107.545.75.746.2]
4000.0 3600 3200 2800 2400 2000 1800 1600 1400 1200 1000 800 600 450.0 0.00 0.1 0.2 0.3 0.4 0.5 0.6 0.7 0.8 0.9 1.0 1.1 1.2 1.3 1.4 1.5 1.55 cm-1 A
GROUP I - PRIME & BOND NT
QTH after 1 week of dry storage
3381 3105 2957 2930 2872 2337 1892 1721 1636 1609 1530 14541407
1378 1320 1296 12781248 1173 1063
988945 812
773 652
615595536474 466 4000.0 3600 3200 2800 2400 2000 1800 1600 1400 1200 1000 800 600 450.0 0.00 0.1 0.2 0.3 0.4 0.5 0.6 0.7 0.8 0.9 1.0 1.1 1.2 1.3 1.4 1.5 1.55 cm-1 A
GROUP I-PRIME & BOND NT
QTH immediately after curing
3381 3105 2957 2930 2872 2337 1892 1721 1636 16091530 14541407 1378 1320 1296 12781248 1173 1063
988945 812
773 652
615595536474 466 4000.0 3600 3200 2800 2400 2000 1800 1600 1400 1200 1000 800 600 450.0 0.00 0.1 0.2 0.3 0.4 0.5 0.6 0.7 0.8 0.9 1.0 1.1 1.2 1.3 1.4 1.5 1.55 cm-1 A
GROUP I- PRIME & BOND NT
QTH uncured
3381 3105 2957 2930 2872 2337 1892 1721 1636 1609 15301454 1407 1378 1320 1296 12781248 1173 1063
988945 812
773 652
[image:48.595.111.541.76.741.2]
4000.0 3600 3200 2800 2400 2000 1800 1600 1400 1200 1000 800 600 450.0 0.00 0.1 0.2 0.3 0.4 0.5 0.6 0.7 0.8 0.9 1.0 1.1 1.2 1.3 1.4 1.5 1.55 cm-1 A 3478 3037 2961 2931 2641 2069 1720 1715 1636 1609 1583 1509 1454 14051376 1320 12971248 1174 1126 1044
1012946
877 831
815
771756 684
655 594577
Group II-Beauti Bond
LED after 1 week of dry storage
4000.0 3600 3200 2800 2400 2000 1800 1600 1400 1200 1000 800 600 450.0 0.00 0.1 0.2 0.3 0.4 0.5 0.6 0.7 0.8 0.9 1.0 1.1 1.2 1.3 1.4 1.5 1.55 cm-1 A 3478 3037 2961 2931 2641 2069 1720 1715 1636 1609 1583 1509 1454 14051376 1320 12971248 1174 1126 1044
1012946
877 831
815
771756 684
655 594577
Group II-Beauti Bond
LED immediately after curing
4000.0 3600 3200 2800 2400 2000 1800 1600 1400 1200 1000 800 600 450.0 0.00 0.1 0.2 0.3 0.4 0.5 0.6 0.7 0.8 0.9 1.0 1.1 1.2 1.3 1.4 1.5 1.55 cm-1 A
Group II-Beauti Bond
LED uncured 3478 3037 2961 2931 2641 2069 1720 1715 1636 1609 1583 1509 1454 14051376 1320 12971248 1174 1126 1044
1012946
877 831
815
771756 684
[image:49.595.108.542.81.305.2]4000.0 3600 3200 2800 2400 2000 1800 1600 1400 1200 1000 800 600 450.0 0.00 0.1 0.2 0.3 0.4 0.5 0.6 0.7 0.8 0.9 1.0 1.1 1.2 1.3 1.4 1.5 1.55 cm-1 A 3478 3037 2961 2931 2641 2069 1720 1715 1636 1609 1583 1509 1454 14051376 1320 12971248 1174 1126 1044
1012946
877 831
815
771756 684
655 594577
Group II-Beauti Bond
QTH after 1 week of dry storage
4000.0 3600 3200 2800 2400 2000 1800 1600 1400 1200 1000 800 600 450.0 0.00 0.1 0.2 0.3 0.4 0.5 0.6 0.7 0.8 0.9 1.0 1.1 1.2 1.3 1.4 1.5 1.55 cm-1 A 3478 3037 2961 2931 2641 2069 1720 1715 1636 1609 1583 1509 1454 14051376 1320 12971248 1174 1126 1044
1012946
877 831
815
771756 684
655 594577
Group II-Beauti Bond
QTH immediately after curing
4000.0 3600 3200 2800 2400 2000 1800 1600 1400 1200 1000 800 600 450.0 0.00 0.1 0.2 0.3 0.4 0.5 0.6 0.7 0.8 0.9 1.0 1.1 1.2 1.3 1.4 1.5 1.55 cm-1 A
Group II-Beauti Bond
QTH uncured 3478 3037 2961 2931 2641 2069 1720 1715 1636 1609 1583 1509 1454 14051376 1320 12971248 1174 1126 1044
1012946
877 831
815
771756 684
4000.0 3600 3200 2800 2400 2000 1800 1600 1400 1200 1000 800 600 450.0 0.00 0.1 0.2 0.3 0.4 0.5 0.6 0.7 0.8 0.9 1.0 1.1 1.2 1.3 1.4 1.5 1.60 cm-1 A 3425 2954 2935 1719 1636 1607 1582 1508 1469 1458 14001391 1365 1320 1183 1046 969 900 877 830 816 772 751 698 656 568 488
GROUP III-ADPER EASY ONE
LED after 1 week of dry storage
4000.0 3600 3200 2800 2400 2000 1800 1600 1400 1200 1000 800 600 450.0 0.00 0.1 0.2 0.3 0.4 0.5 0.6 0.7 0.8 0.9 1.0 1.1 1.2 1.3 1.4 1.5 1.60 cm-1 A 3425 2954 2935 1719 1636 1607 1582 1508 1469 1458 14001391 1365 1320 1183 1046 969 900 877 830 816 772 751 698 656 568 488
GROUP III-ADPER EASY ONE
LED immediately after curing
4000.0 3600 3200 2800 2400 2000 1800 1600 1400 1200 1000 800 600 450.0 0.00 0.1 0.2 0.3 0.4 0.5 0.6 0.7 0.8 0.9 1.0 1.1 1.2 1.3 1.4 1.50 cm-1 A 3415 3034 2957 2946 2937 1889 1725
17111704 1635
1608 1508 1453 14061378 1322 13141303 1295 1246 1170 942 907 867
830814
736700 651
618 574 474 464
GROUP III-ADPER EASY ONE
[image:51.595.109.530.83.297.2]LED uncured
4000.0 3600 3200 2800 2400 2000 1800 1600 1400 1200 1000 800 600 450.0 0.00 0.1 0.2 0.3 0.4 0.5 0.6 0.7 0.8 0.9 1.0 1.1 1.2 1.3 1.4 1.5 1.60 cm-1 A 3425 2954 2935 1719 1636 1607 1582 1508 1469 1458 14001391 1365 1320 1183 1046 969 900 877 830 816 772 751 698 656 568 488
GROUP III-ADPER EASY ONE
QTH after 1 week of dry storage
4000.0 3600 3200 2800 2400 2000 1800 1600 1400 1200 1000 800 600 450.0 0.00 0.1 0.2 0.3 0.4 0.5 0.6 0.7 0.8 0.9 1.0 1.1 1.2 1.3 1.4 1.5 1.60 cm-1 A 3425 2954 2935 1719 1636 1607 1582 1508 1469 1458 14001391 1365 1320 1183 1046 969 900 877 830 816 772 751 698 656 568 488
GROUP III-ADPER EASY ONE
QTH immediately after curing
4000.0 3600 3200 2800 2400 2000 1800 1600 1400 1200 1000 800 600 450.0 0.00 0.1 0.2 0.3 0.4 0.5 0.6 0.7 0.8 0.9 1.0 1.1 1.2 1.3 1.4 1.50 cm-1 A 3415 3034 2957 2946 2937 1889 1725 17111704 1635 1608 1508 1453 14061378 1322 13141303 1295 1246 1170 942 907 867
830814
736700 651
618 574 474 464
GROUP III-ADPER EASY ONE
QTH uncured
[image:52.595.109.530.83.297.2]
4000.0 3600 3200 2800 2400 2000 1800 1600 1400 1200 1000 800 600 450.0 0.00 0.1 0.2 0.3 0.4 0.5 0.6 0.7 0.8 0.9 1.0 1.1 1.2 1.3 1.4 1.5 1.60 cm-1 A 3286 3080 2938 2876 2213 1720 1655 1636 1549 1441 1409 1382 1246 1186 10621040
985 963
805 697
GROUP IV - XENO V
LED after 1 week of dry storage
4000.0 3600 3200 2800 2400 2000 1800 1600 1400 1200 1000 800 600 450.0 0.00 0.1 0.2 0.3 0.4 0.5 0.6 0.7 0.8 0.9 1.0 1.1 1.2 1.3 1.4 1.5 1.60 cm-1 A 3286 3080 2938 2876 2213 1720 1655 1636 1549 1441 1409 1382 1246 1186 10621040
985 963
805 697
GROUP IV - XENO V
LED immediately after curing
4000.0 3600 3200 2800 2400 2000 1800 1600 1400 1200 1000 800 600 450.0 0.00 0.1 0.2 0.3 0.4 0.5 0.6 0.7 0.8 0.9 1.0 1.1 1.2 1.3 1.4 1.5 1.60 cm-1 A 3286 3080 2938 2876 2213 1720 1655 1636 1549 1441 1409 1382 1246 1186 10621040
985 963
805 697
GROUP IV-XENO V
LED uncured
4000.0 3600 3200 2800 2400 2000 1800 1600 1400 1200 1000 800 600 450.0 0.00 0.1 0.2 0.3 0.4 0.5 0.6 0.7 0.8 0.9 1.0 1.1 1.2 1.3 1.4 1.5 1.60 cm-1 A 3286 3080 2938 2876 2213 1720 1655 1636 1549 1441 1409 1382 1246 1186 10621040
985 963
805 697
GROUP IV - XENO V
QTH after 1 week of dry storage
4000.0 3600 3200 2800 2400 2000 1800 1600 1400 1200 1000 800 600 450.0 0.00 0.1 0.2 0.3 0.4 0.5 0.6 0.7 0.8 0.9 1.0 1.1 1.2 1.3 1.4 1.5 1.60 cm-1 A 3286 3080 2938 2876 2213 1720 1655 1636 1549 1441 1409 1382 1246 1186 10621040
985 963
805 697
GROUP IV - XENO V
QTH immediately after curing
4000.0 3600 3200 2800 2400 2000 1800 1600 1400 1200 1000 800 600 450.0 0.00 0.1 0.2 0.3 0.4 0.5 0.6 0.7 0.8 0.9 1.0 1.1 1.2 1.3 1.4 1.5 1.60 cm-1 A 3286 3080 2938 2876 2213 1720 1655 1636 1549 1441 1409 1382 1246 1186 10621040
985 963
805 697
GROUP IV-XENO V
QTH uncured
32
[image:55.595.100.518.185.427.2]
RESULTS:
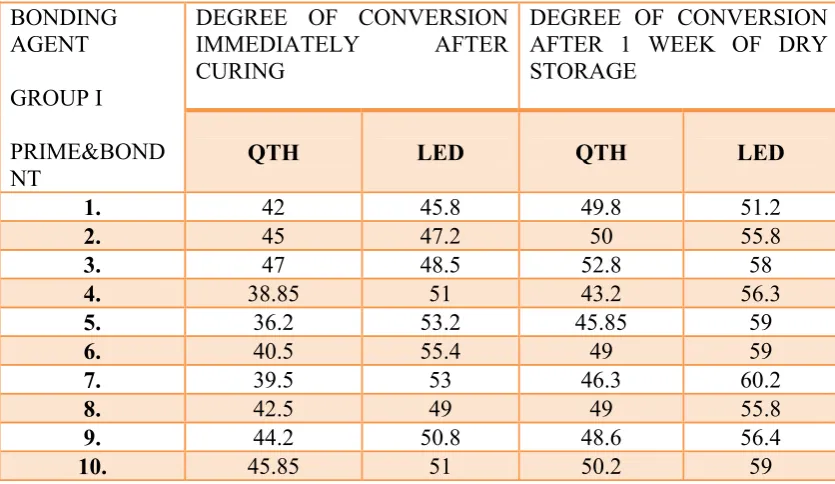
TABLE I: DC of group I (Prime & Bond NT) immediately after curing and after 1 week of dry storage
BONDING AGENT
GROUP I
PRIME&BOND NT
DEGREE OF CONVERSION IMMEDIATELY AFTER CURING
DEGREE OF CONVERSION AFTER 1 WEEK OF DRY STORAGE
QTH LED QTH LED
1. 42 45.8 49.8 51.2
2. 45 47.2 50 55.8
3. 47 48.5 52.8 58
4. 38.85 51 43.2 56.3
5. 36.2 53.2 45.85 59
6. 40.5 55.4 49 59
7. 39.5 53 46.3 60.2
8. 42.5 49 49 55.8
9. 44.2 50.8 48.6 56.4
[image:55.595.100.530.476.732.2]10. 45.85 51 50.2 59
TABLE II: DC of group II (Beauti Bond) immediately after curing and after 1 week of dry storage BONDING AGENT GROUP II BEAUTI BOND
DEGREE OF CONVERSION IMMEDIATELY AFTER CURING
DEGREE OF CONVERSION AFTER 1 WEEK OF DRY STORAGE
QTH LED QTH LED
1. 22 31 29 38.3
2. 24 29.5 28.85 37
3. 25.8 29 26 35.2
4. 29 32 32.8 36.2
5. 27.5 31.5 32.8 37.85
6. 31 30.5 35.2 39.8
7. 24.85 29.8 30 36.85
8. 26.2 29.85 31.2 39
9. 23.8 31.5 30.85 37
33
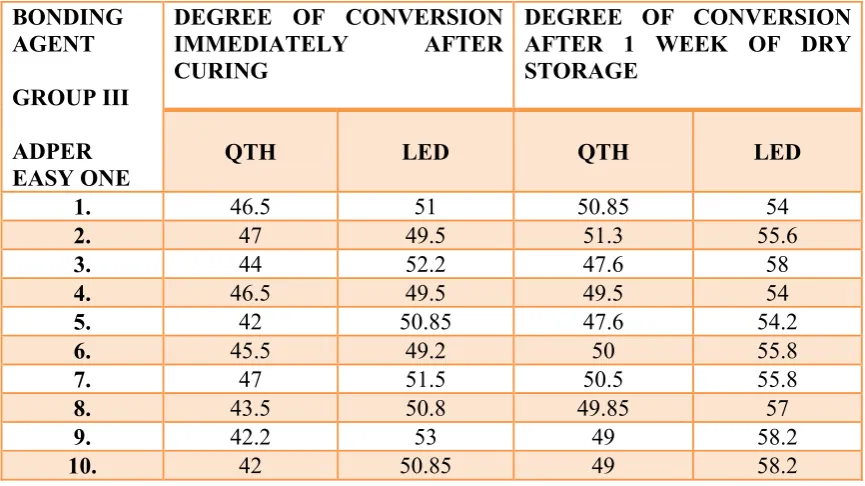
TABLE III: DC of group III (Adper Easy One) immediately after curing and after 1 week of dry storage
BONDING AGENT
GROUP III
ADPER EASY ONE
DEGREE OF CONVERSION IMMEDIATELY AFTER CURING
DEGREE OF CONVERSION AFTER 1 WEEK OF DRY STORAGE
QTH LED QTH LED
1. 46.5 51 50.85 54
2. 47 49.5 51.3 55.6
3. 44 52.2 47.6 58
4. 46.5 49.5 49.5 54
5. 42 50.85 47.6 54.2
6. 45.5 49.2 50 55.8
7. 47 51.5 50.5 55.8
8. 43.5 50.8 49.85 57
9. 42.2 53 49 58.2
10. 42 50.85 49 58.2
TABLE IV: DC of group IV (Xeno V) immediately after curing and after 1 week of dry storage
BONDING AGENT
GROUP IV
XENO V
DEGREE OF CONVERSION IMMEDIATELY AFTER CURING
DEGREE OF CONVERSION AFTER 1 WEEK OF DRY STORAGE
QTH LED QTH LED
1. 55.85 59 60.5 65.8
2. 58 62.4 61 64.3
3. 54.2 58 62.2 65.8
4. 54.2 61 59.85 63.6
5. 56 60.8 59 63.6
6. 56 62 61 67.4
7. 53 61.4 60.85 66
8. 55.85 59.85 59 62.8
9. 53 60.6 60.85 64
[image:56.595.101.533.494.733.2]34
STATISTICAL ANALYSIS:
Data were statistically analyzed using ONE WAY ANOVA and TUKEY’S HSD
Post-hoc multiple comparisons and paired t test at 1% level significance.
TABLE V:
1) ** denotes significance at 1% level
2) Means followed by different alphabets between groups denotes significance at 1% level using TUKEY’S HSD Post-hoc test.
TABLE VI: Dependent Variable (I) Group (J) Group Mean Difference (I-J) Std.
Error Sig.
95% Confidence Interval Lower Bound Upper Bound QTH after curing Group I Group
II 16.0450(*) 1.13578 .000 12.9861 19.1039
Group
III -2.4600 1.13578 .152 -5.5189 .5989
Group
IV -12.8500(*) 1.13578 .000
-15.9089 -9.7911
Group
II
Group
I -16.0450(*) 1.13578 .000
-19.1039
-12.9861
Group
III -18.5050(*) 1.13578 .000
-21.5639
-15.4461
Groups DC immediately after curing DC after 1 week of dry storage
QTH LED QTH LED
Mean SD Mean SD Mean SD Mean SD
Group I 42.16b 3.43 50.49b 2.93 48.48b 2.70 57.07b 2.59
Group II 26.12a 2.65 30.68a 1.12 30.70a 2.55 37.62a 1.43
Group III 44.62b 2.12 50.84b 1.21 49.52b 1.25 56.08b 1.70
Group IV 55.01c 1.59 60.69c 1.39 60.38c 1.02 64.91c 1.45
35
Group
IV -28.8950(*) 1.13578 .000
-31.9539 -25.8361 Group III Group
I 2.4600 1.13578 .152 -.5989 5.5189
Group
II 18.5050(*) 1.13578 .000 15.4461 21.5639
Group
IV -10.3900(*) 1.13578 .000
-13.4489 -7.3311
Group
IV
Group
I 12.8500(*) 1.13578 .000 9.7911 15.9089
Group
II 28.8950(*) 1.13578 .000 25.8361 31.9539
Group
III 10.3900(*) 1.13578 .000 7.3311 13.4489
LED after curing
Group I
Group
II 19.8050(*) .81391 .000 17.6129 21.9971
Group
III -.3500 .81391 .973 -2.5421 1.8421
Group
IV -10.2000(*) .81391 .000
-12.3921 -8.0079
Group
II
Group
I -19.8050(*) .81391 .000
-21.9971
-17.6129
Group
III -20.1550(*) .81391 .000
-22.3471
-17.9629
Group
IV -30.0050(*) .81391 .000
-32.1971 -27.8129 Group III Group
I .3500 .81391 .973 -1.8421 2.5421
Group
II 20.1550(*) .81391 .000 17.9629 22.3471
Group
IV -9.8500(*) .81391 .000
-12.0421 -7.6579
Group
IV
Group
I 10.2000(*) .81391 .000 8.0079 12.3921
Group
II 30.0050(*) .81391 .000 27.8129 32.1971
Group
III 9.8500(*) .81391 .000 7.6579 12.0421
QTH after 1 week
Group I
Group
II 17.7750(*) .90592 .000 15.3352 20.2148
Group
III -1.0450 .90592 .659 -3.4848 1.3948
36
IV 14.3398
Group
II
Group
I -17.7750(*) .90592 .000
-20.2148
-15.3352
Group
III -18.8200(*) .90592 .000
-21.2598
-16.3802
Group
IV -29.6750(*) .90592 .000
-32.1148 -27.2352 Group III Group
I 1.0450 .90592 .659 -1.3948 3.4848
Group
II 18.8200(*) .90592 .000 16.3802 21.2598
Group
IV -10.8550(*) .90592 .000
-13.2948 -8.4152
Group
IV
Group
I 11.9000(*) .90592 .000 9.4602 14.3398
Group
II 29.6750(*) .90592 .000 27.2352 32.1148
Group
III 10.8550(*) .90592 .000 8.4152 13.2948
LED after 1 week
Group I
Group
II 19.4500(*) .82938 .000 17.2163 21.6837
Group
III .9900 .82938 .635 -1.2437 3.2237
Group
IV -7.8400(*) .82938 .000
-10.0737 -5.6063
Group
II
Group
I -19.4500(*) .82938 .000
-21.6837
-17.2163
Group
III -18.4600(*) .82938 .000
-20.6937
-16.2263
Group
IV -27.2900(*) .82938 .000
-29.5237 -25.0563 Group III Group
I -.9900 .82938 .635 -3.2237 1.2437
Group
II 18.4600(*) .82938 .000 16.2263 20.6937
Group
IV -8.8300(*) .82938 .000
-11.0637 -6.5963
Group
IV
Group
I 7.8400(*) .82938 .000 5.6063 10.0737
Group
II 27.2900(*) .82938 .000 25.0563 29.5237
Group
37
I.INTERPRETATION OF RESULTS: (Table V & VI)
The results for Degree of conversion (DC) of the factors “bonding
agent”(p<0.001) and “Light cure unit”( p<0.001) were significant as well as their
interaction(p<0.001).
A) Immediately after curing with LED/QTH light units:
Analysis of the results of DC at 1% level significance reveals that
Group IV (Xeno V) > Group III (Adper Easy One) ≥ Group I (Prime & Bond NT) > Group II (Beauti Bond)
The results of this study showed that the DC of group I (Prime&Bond NT)
showed statistically significant difference with group II (Beauti Bond) and group IV
(Xeno V) (p<0.001) and no statistically significant difference was seen with group III
(Adper Easy One). (p<0.001)
B) Post polymerization curing after 1 week of dry storage with LED unit Group IV > Group I ≥ Group III > Group II
The results showed that the DC of group I (Prime&Bond NT) showed statistically
significant difference with group II (Beauti Bond) and group IV (Xeno V) (p<0.001) and
no statistically significant difference was seen with group III (Adper Easy One).
(p<0.001)
C) Post polymerization curing after 1 week of dry storage with QTH unit Group IV > Group III ≥ Group I > Group II
The results showed that the DC of group I (Prime & Bond NT) showed
statistically significant difference with group II (Beauti Bond) and group IV (Xeno V)
(p<0.001) and no statistically significant difference was seen with group III (Adper Easy
38
t test:
[image:61.595.104.530.160.422.2]PAIRED SAMPLES STATISTICS:
Table VII: FOR GROUP I
Mean N Std. Deviation P value
Pair 1 QTH after curing 42.1600 10 3.42732
<0.001* LED after
curing 50.4900 10 2.93199
Pair 2 QTH after 1 week 48.4750 10 2.70342
<0.001* LED after 1
week 57.0700 10 2.59403
Pair 3 QTH after curing 42.1600 10 3.42732
<0.001* QTH after 1
week 48.4750 10 2.70342
Pair 4 LED after curing 50.4900 10 2.93199
<0.001* LED after 1
week 57.0700 10 2.59403
*denotes significance at 1% level
TABLE VIII: FOR GROUP II
Mean N Std. Deviation P value
Pair 1 QTH after curing 26.1150 10 2.65331
<0.001* LED after
curing 30.6850 10 1.11606
Pair 2 QTH after 1 week 30.7000 10 2.54722
<0.001* LED after 1
week 37.6200 10 1.42638
Pair 3 QTH after curing 26.1150 10 2.65331
<0.001* QTH after 1
week 30.7000 10 2.54722
Pair 4 LED after curing 30.6850 10 1.11606
<0.001* LED after 1
[image:61.595.101.532.464.701.2]39
TABLE IX: FOR GROUPIII
Mean N Std. Deviation P value
Pair 1 QTH after curing 44.6200 10 2.11859
<0.001* LED after
curing 50.8400 10 1.21376
Pair 2 QTH after 1 week 49.5200 10 1.25393
<0.001* LED after 1
week 56.0800 10 1.70281
Pair 3 QTH after curing 44.6200 10 2.11859
<0.001* QTH after 1
week 49.5200 10 1.25393
Pair 4 LED after curing 50.8400 10 1.21376
<0.001* LED after 1
week 56.0800 10 1.70281
TABLE X: FOR GROUP IV
Mean N Std. Deviation P value
Pair 1 QTH after curing 55.0100 10 1.58899
<0.001* LED after
curing 60.6900 10 1.39060
Pair 2 QTH after 1 week 60.3750 10 1.02205
<0.001* LED after 1
week 64.9100 10 1.44718
Pair 3 QTH after curing 55.0100 10 1.58899
<0.001* QTH after 1
week 60.3750 10 1.02205
Pair 4 LED after curing 60.6900 10 1.39060
<0.001* LED after 1
[image:62.595.104.537.463.723.2]40
II.INTERPRETATION OF TABLE (VII,VIII, IX, X)
A. Comparison of DC with LED and QTH unit
LED UNIT > QTH UNIT
The results showed that the DC when cured with LED unit in Group I
(Prime&Bond NT) , Group II (Beauti Bond) , Group III (Adper Easy One) and Group IV
(Xeno V) showed statistically significant difference (p<0.001) with QTH unit DC.
B. Comparison of DC with immediately after curing and after 1 week of dry storage:
DC after 1 week of dry storage > DC immediately after curing
In all the four groups(Prime & Bond NT, Beauti Bond, Adper Easy One, and
Xeno V) the DC after 1 week of dry storage showed statistically significant difference
41
GRAPH I: DC for QTH unit immediately and after 1 week of dry storage
0 10 20 30 40 50 60 70
group I group II group
III group IV
DC QTH immediately after
curing
QTH after 1 week of dry storage
42
GRAPH II: DC for LED unit immediately and after 1 week of dry storage
0
10
20
30
40
50
60
70
DC
LED immediately
after curing
43
GRAPH III: DC FOR LED AND QTH LIGHT CURING UNIT
0 10 20 30 40 50 60 70
DC
QTH immediately after curing
QTH after 1 week of dry storage
LED immediately after curing
44