Papers and Proceedings of the Royal Society of Tasmania, Volume 121, 1987
STREAMFLOW CHARACTERISTICS OF NORTHEASTERN
TASMANIA: I. REGIONAL FLOOD FLOWS
by A. D. Knighton
(with four tables and seven text-figures)
KNIGHTON, A.D., I 987 (30:vi): Streamflow characteristics of northeastern Tasmania: I. Regional flood flows. Pap. Proc. R. Soc. Tasm., 121: 23-33. https://doi.org/10.26749/rstpp.121.23 ISSN 0080-4703.
Department of Geography, University of Sheffield, Sheffield, United Kingdom SIO 2TN.
Based on streamflow records from thirteen stations, regional equations are developed which enable the estimation of mean annual discharge and various flood flows at ungauged sites along rivers in northeastern Tasmania. The area around Swansea is shown to be hydrologically distinct, at least as far as flood discharges are concerned, and the analysis subsequently focuses on the rest of the region. Despite the wide range of climatic and physiographic conditions there, relationships are highly significant, with drainage area explaining more than 97% of the variation in flood discharge. Rates of change are not only relatively high but increase with flood magnitude, suggesting rapid downstream transmission of flood waters. Network magnitude may be a viable alternative to drainage area as an estimator. Its use has the advantage that the downstream pattern of flow addition can be readily charted for major rivers, as illustrated for the Ringarooma and George.
Key Words: Tasmania, stream flow, drainage area, flood discharge.
INTRODUCTION
The basic variable used to express the size and erosive effectiveness of natural rivers is dis charge, which is generally measured at established gauging stations. However, the number of mea surement sites within an area is usually quite small and rarely does a sequence of gauging stations exist along an individual river. Consequently, in order to extend a spatially limited data base and provide estimates of flow characteristics at ungauged sites, some form of regional analysis is necessary. The estimates so derived can be used for water manage ment and river engineering purposes at regional and basin scales, as well as for routing water and sediment through individual catchments. Indeed the latter provided the initial stimulus for this study in that reliable flow estimates were required as a spatial series along the Ringarooma and George Rivers in order to model the movement patterns of material introduced from mining sources. Although so inspired, the results presented below have impli cations for a wider range of purposes.
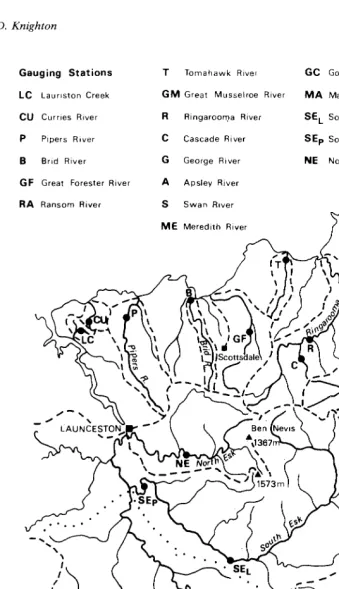
The study falls into two parts, the first of which is concerned with flood flow estimation and the second with hydraulic geometry relationships. Both deal with rivers in northeastern Tasmania, a somewhat arbitrarily defined area bounded in the west by a line along the Tamar estuary, South Esk and Macquarie Rivers (fig. 1 ). The southern limit is defined by the southern-most sweep of the
Macquarie River. Regional flow analyses are a compromise to a certain extent: between a larger sampled area with more gauging stations and a smaller one in which flow conditions are likely to be more homogeneous. Thus enlargement of the sampled area to augment the data base increases the degree of heterogeneity and the attendant risk of sampling from different hydrogeogra phic popu lations. Such proved to be the case here.
The area can be divided into three main sections. That to the north of the South Esk basin has rivers draining to the east and north coasts and to the Tamar estuary, so that they come under a wide range of climatic and physiographic influences. Mean annual precipitation is at a maximum(> 1600 mm) to the north and northeast of Ben Nevis, where many rivers (notably the North Esk, Ringarooma, George and South Esk) have their headwaters. The first three rivers listed provide a west-east sample across this northern section, the pattern of their mean monthly discharges being distinctively seasonal (fig. 2) and typically temperate oceanic (Shaw I 983). Despite the broadly similar regimes with July-September and January-March being respectively the maximum and minimum flow periods, small but possibly significant differences are apparent in the monthly runoff patterns, particularly between the George and the other two rivers. Even when dealing with averaged
Gauging Stations
lC Lau rlston Creek
CU Curries River
p Pipers River
B arid River
GF Great Forester River
RA Ransom River
....
,
,,-
,
"
\I
I I I
T Tomahawk River
GM Great Musselroe
R RingaroorQa River
C Cascade Ri ver
G George River
A Apsley River
S Swan River
ME Meredith River
~...
,.
....
_'"
"
o
10 20 30 40..
50km ....I
,
II
I I
'1.;,1
GC
Goatrock CreekRiver MA Macquarle River
SEL South Esk, Llewellyn
SEp South Esk at Perth
NE North Esk N
t
[image:2.600.70.409.151.740.2]Streamflow Characteristics of NE Tasmania, 1. Regional Flood Flows 25
flows in neighbouring basins, flow behaviour can be variable.
The South Esk basin dominates the area with the main river describing a horseshoe-like course (fig. I) along which mean annual precipitation varies from 1600 mm in the upper reaches to less than 600 mm south of Perth. The main tributary, the Macquarie River, has a southern origin and enters the South Esk downstream of Perth, the site of the gauging station with the largest drainage area used in this study. In effect the South Esk basin separates the northern section from a southern one represented by a cluster of gauges in the neighbourhood of Swansea (fig. 1). There, mean annual precipitation ranges from 650 to 900 mm. As the following analysis will show, this southern section has streamflow properties which are distinct from those further north.
REGIONAL ANALYSIS
The estimation of flood frequency or hydro-graph parameters at ungauged sites commonly relies on statistical relationships between river flow and catchment characteristics. The latter can be broadly grouped into climatic, surface cover (soils and land use) and drainage basin properties, cate-gories which include a potentially large number of operational variables. Ease and reliability of measurement, and likely success in prediction are appropriate criteria in the choice of suitable variables. From the point of view of the first criterion, drainage basin properties are probably the most suitable provided reliable topographic maps are available at a large enough scale. Those properties can be further subdivided into:
(i) size variables - drainage area, mainstream
length, total channel length;
Oi) slope properties of the channel and hillslope systems; and
(iii) channel network variables drainage density, stream frequency, network magnitude; with drainage area and network magnitude being relatively easy to measure. As regards the second criterion, drainage area has consistently been an effective variable, one reason for its success being that it subsumes a great deal of relevant hydro-logical information. In probably the most compre-hensive study of streamflow variation yet completed (NERC, 1975), drainage area proved to be the single most important variable influencing the
mean annual flood (Q233) at both national and
regional levels of the British Isles. In assessing ten regional flood-frequency analyses from the United States, Riggs (1973) found that drainage area was
z «
ill
:2
r::' 2
o 1
f=
«
a:
RINGAROOMA RIVER
Mean annual discharge:::; 8'71 m 3 5- 1
o~---~
z
« ill
:2 o
f-g
f-«
a:
o
f-'2
f-« a:
GEORGE RIVER
Mean annual
discharge = 6'12 m 3 5-1
.----..-.--1
o
-I NORTH ESK RIVER
2
r
Mean annual! discharge = 5 43 m 3 s-l
o
M A M A S O N 0
FIG. 2 - Flow regimes of the Ringarooma, George and North Esk Rivers expressed by the ratio of mean monthly to mean annual discharge.
the most consistent out of 16 independent variables since it was the only one to appear in all ten analyses. Given also that drainage area has been
successfully used to predict the median flood (Q2)
in western Tasmania (Watson 1975, Watson &
[image:3.607.259.452.164.565.2]Mean Annual Discharge
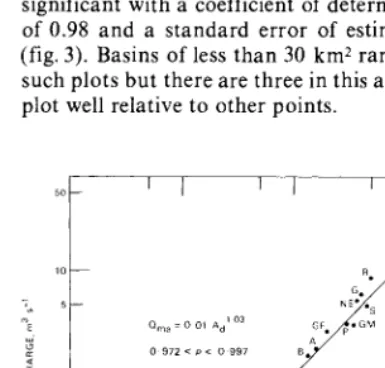
Mean annual discharge is simply the arith-metic average of all daily mean flows, with a frequency of 29, 32.5 and 30% respectively at the North Esk, Ringarooma and George gauging sta-tions. In most humid areas it is closely related to drainage area and mean annual precipitation. Here, its relationship to drainage area is highly
significant with a coefficient of determination (p2)
of 0.98 and a standard error of estimate of 0.11 (fig. 3). Basins of less than 30 km2 rarely figure in
such plots but there are three in this area and they plot well relative to other points.
~ < I U
is
oc
r-
---r-r--,
1 -
---'1 - -
~J!
"S~p
SEc
10 R.
+
II
'
1-"I
I
01~
00', GC
o 972 < p < 0 997
.eu
OLe
G.
NE- .5
GF. P oGM A B.
~L~_~
_ _
l~5 10 50 100 500 1000
[image:4.605.38.231.321.505.2]DRAINAGE AREA. krnl
FIG. 3 - Relationships of mean annual discharge to drainage area. The 95% confidence limitsfor the correlation coefficient are given.
Over much of the eastern United States where total precipitation varies gradually with distance and each unit area contributes about the same volume of runoff, mean annual discharge tends to have a one-to-one relationship with
drain-age area (Dunne & Leopold 1978). Such is the case
here despite the less uniform pattern of rainfall. Indeed quite steep precipitation gradients exist from the coastal and South Esk valley areas toward the northern highlands. In addition to an exponent value of almost one, the regression equation (fig. 3) has an intercept value which indicates that on
average a mean annual discharge of 0.01 m3 S-I is
produced from a unit basin area.
Such is the dominance of drainage area that no improvement in the level of explanation was
achieved by the inclusion of mean annual precipita-tion as an addiprecipita-tional independent variable. Never-theless, most of the residuals above the regression line have higher than average precipitation, while those below have lower than average. That the two South Esk stations plot as negative residuals can be partly attributed to the precipitation effect, although channel storage may be a contributory factor at these large drainage areas. However, exclusion of those stations to give
Qm. :: 0.01 A/·02 (I)
has obviously little effect on a well-defined regional trend which is maintained over three and a half cycles of logarithms.
Flood Discharges and Drainage Area
The main part of this paper is concerned with higher magnitude flows which are more relevant hydrologically and morphologically. Flood fre-quency analysis is a procedure for estimating the peak discharge which on average is likely to be equalled or exceeded once in a specified period of
T years. Thus QT is the peak flow having a return
period or recurrence interval of T years. Before proceeding to the regional stage, the magnitudes of specified flood flows had to be determined for each of the gauging stations.
Streamflow Characteristics of NE Tasmania, l Regional Flood Flows 27
I
<II
'"
Ew
(!l
a:
200
~ 100r---+---~--_,~~L-~--~---~
u en
o
~
:::l ~ X <{ ~
...J
<{ :::l
Z Z <{
50
20
/ . .
•
./'
/"
.
/" ./'. /
..
~. /
T
. /
/
/
1 '11 1'25 2 5
RECURRENCE INTERVAL.years
10 50
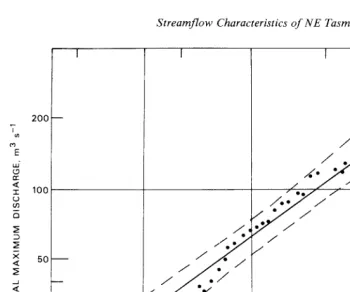
FIG. 4 - Flood-frequency plotfor the North Esk at Ballroom, 1950-1983. The 95% confidence limits are
~hown.
TABLE 1
Flood flow
data.
Gauging station Length of Flood discharges, m3 S-1 record,
record Index
number Rtver years Ql.ll Q2 Qs QlO
302200 Swan 20 97 490 892 1123
302204 Apsley 15 82 188 325 433
302205 George 11 46 116 213 292
302208 Meredith 16 28 97 163 199
302210 Great Musselroe 13 30 70 123 165
302213 Goatrock Creek 10 0.9 1.8 2.9 3.6
318017 South Esk at Llewellyn 25 204 523 971 1341
318204 North Esk 34 29 64 108 142
318208 South Esk at Perth 27 174 491 972 1390
318215 Lauriston Creek 7 2.3 4.1 6.2 7.6
319200 Brid 14 11 25 42 56
319202 Tomahawk 13 15 24 33 40
319204 Pipers 11 23 62 118 165
[image:5.595.50.400.158.449.2]1000
100
P 0= 0·99
/
/
I.e/
/L.e
~-T~r
"SEp
<5
xA / ' ,/
.'
T "cGM
• NE
P
0 11,= O'23 A d0 84
o 950<p 0<: 0,998
Q2 '" O'32AdO 93
O'952<p<O 998
I
~~J
I~l
SE.,
'SE'-1
0 5 =0 40AdO 98
0950<p<0998
1000
~
DRAINAGE AREA, km2
FIG. 5 - Relationships of flood flows, QUI, Q2 and Q5, to drainage area for a southern and a northern/ central section o.fnortheastern Tasmania. The 95% confidence limits for the correlation coefficient are given.
illustrates these points, as well as showing how the 95% confidence limits begin to widen away from a recurrence interval of two years which defines the
median annual flood (Q2). The mean annual flood
has a recurrence interval of 2.33 years and the ratio of Q2.33/ Q2 at the] 3 gauging stations is fairly stable with a mean of 1.12 and a standard deviation of 0.02. These average flows are important since it is believed that discharges in the neighbourhood of bankfull cumulatively perform most work in natural rivers and therefore are largely responsible for forming the channel (Knighton 1984).
A preliminary analysis in terms of the ratio Q2/ Qma suggested that the 13 stations cover two rather than one hydrogeographic province, with the southern stations on the Swan, Apsley, Meredith and Goatrock Creek forming a separate group. The mean ratio there was 126 compared with 21 for the remaining stations. The subsequent plots confirmed the distinction (fig. 5), and the two areas were henceforth treated separately. Thus, while the initially selected region can be described by a single equation as regards mean annual discharge, the same homogeneity does not apply to flood flows. Indeed, comparing intercept values, flood flows in
the southern section are about five times J~-ser
than elsewhere.
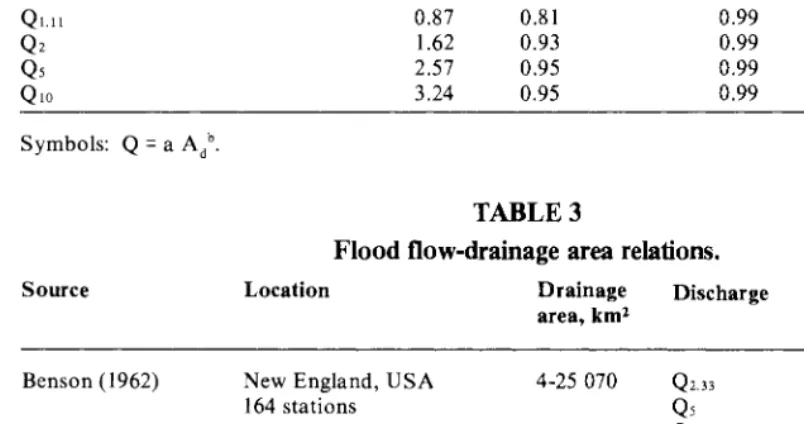
All relationships are highly significant (table 2), even for the southern section where the data set is small. In fact, apart from Ql.lI, the four stations fit almost exactly along straight lines on log-log graph paper (fig. 5) and standard errors are very low. The results for QlO are included largely for completeness since the records are not consistently long enough for good estimation of that flow, although the relationships retain the same level of significance. Thus table 2 provides two sets of equations which can be used for estimating a range of flood flows in the rivers of northeastern Tas-mania. By way of example, the gauging station on the Ringarooma has seven years of record, the analysis of which gives a median flood value of 100
m3 S- I . The corresponding regional equation
estimates the flow at 105 m3 s -I.
[image:6.600.40.234.174.598.2]Streamflow Characteristics of NE Tasmania, l. Regional Flood Flows 29
TABLE 2
Flood flow-drainage area relations, northeastern Tasmania.
Flood Equation constants Correlation Standard error
discharge a b coefficient of estimate
(i) Northern area - nine stations
Q1.l1
0.23 0.84 0.99 0.10Q2
0.32 0.93 0.99 0.09Qs
0.40 0.98 0.99 0.10QlO
0.45 1.01 0.99 0.11(ii) Southern area - four stations
QUI
0.87 0.81 0.99 0.16Q2
1.62 0.93 0.99 0.03Q5
2.57 0.95 0.99 0.03QlO
3.24 0.95 0.99 0.03Symbols:
Q
= a Adh.
TABLE 3
Flood flow-drainage area relations.
Source Location Drainage Discharge a b
area, km2
Benson (1962) New England, USA 4-25070
Q2.JJ
Qs
QlO
0.56 0.85
164 stations 0.97 0.82
1.51 0.79
Thomas & Benson
(1970)
Potomac River basin, USA 15-30000
Q2
Qs
QlO
0.86 0.80
1.74 0.78
2.80 0.76
NERC (1975) British Isles 0.05-9868
Q2.33
0.68 0.77Watson (1975)
Watson & Williams (1983)
533 stations
Western Tasmania 7 stations
Western Tasmania JO stations
may be due to the low levels of storage available so that translation rather than reservoir effects dominate the downstream transmission of flood waters. Comparing tables 2 and 3, it appears that northeastern rivers do indeed increase their flood volumes downstream at a faster rate than do rivers in similar environments. On the other hand, the intercept values for the northern area are relatively small, particularly when compared with western
449-2539 4.70 0.74
15-2 539 5.19 0.75
Tasmania which is wetter, steeper and more densely drained. Those for the southern area are reasonably high, suggesting a greater capacity for flood flow generation within that group of streams.
[image:7.602.36.438.389.601.2]negative residuals. This variation, although rela-tively small, points to inter-basin contrasts in flood generation and transmission. The two South Esk stations seem to be in the wrong order as regards flood volumes (table 1, fig. 5), possibly because water movement to the Perth station is more subject to the influence of temporary storage. However, exclusion of that station from the regressions had little effect on the form of the equations which, considering the range of en-vironmental conditions covered, describe the data very well.
Flood Discharges and Network Topology
Intuitively it seems reasonable to argue that the way in which channels of different size are linked together within the drainage network can influence the movement pattern of flood waters and therefore the resultant flood volumes, especially at downstream locations. Certainly the Flood Studies Report (NERC 1975) includes stream frequency (number of channel segments per unit area) as an important explanatory variable of the mean annual flood and attempts have been made to relate parameters of the Instantaneous Unit Hydrograph to network variables (Rodriguez-lturbe & Valdes 1979). There, however, the empha-sis has been on Horton-Strahler rather than Shreve-Smart measures of drainage network com-position. A major element in the more recent Shreve-Smart approach is the introduction of new topologic parameters which describe network structure in dimensionless terms. Two are con-sidered here -- magnitude and diameter. The magnitude of a channel link, an unbroken section of' channel between successive nodes (sources, junctions or outlet), is defined as the number of sources upstream, while diameter is the maximum link distance within the network. Both have geo-metric equivalents - namely, drainage area and mainstream length. Indeed magnitude (M) and drainage area (Ad) are related theoretically (Shreve 1967) by
(2)
where L is the average link length and K is a coefficient, but magnitude is easier to measure provided suitable maps are available.
Map scale is known to affect channel delinea-tion and therefore the calculadelinea-tion of network indices, so that it has become common practice to take the blue-line network shown on 1 :25000 maps as the initial basis for measurement. Unfortunately three of the nine northern stations are not yet covered by the new 1:25000 series, which reduces
- - I - r-~
,m
Q) 0·41 M odsed Oil 1 100, 000 maps
0-902<p<O-996 XB )(T
l
I
J
based 0" 1: 25,000 mapsi
51---- LC LC 0·734 < p < 0,997
i X
~-.~--'----'----
10 100 1000MAGNITUDE AT CiJl.,UGE
FIG. 6 - Relationship of the median annualflood to network magnitude measured at two map scales, 1:25000 and 1:10000.
the data set to six and excludes the upper end of the scale represented by the South Esk stations. Based on measurements of link magnitude (M) and network diameter(D) at each of the six gauges, the following equations were obtained for the median annual flood (Q2)
Q2
=
0.16 M 093 (p::: 0.97, SEE=
0.13) (3) Q2::: 0.33 D109 (p::: 0.81, SEE::: 0.34) (4)Although significant at the 95% level, the latter does not describe the distribution of data particu-larly well and is henceforth disregarded as a possible means of flow estimation.
The exponent in equation (3) is exactly the same as in the corresponding drainage area rela-tionship (table 2, fig. 5), which supports the belief that the rate of downstream increase in Q2 along these northern rivers is faster than elsewhere. Again the Brid (northern coastal plain) appears as a negative resid ual and the George (sharply dissected and rugged headwaters) as a positive one, with the remaining points quite close to the line (fig. 6). For comparative purposes and to produce an equation applicable to those parts of the northern area outside that currently covered by the 1:25 000 series, magnitude was determined from 1: 100 000 maps for the original nine northern stations and correlated with the median annual flood to give
[image:8.598.255.447.165.337.2]Streamflow Characteristics of NE Tasmania, I. Regional Flood Flows 31
TABLE 4
Flood
flow~networkmagnitude relations.
Flood discharge
Equation constants Correlation
coefficient
Standard error of estimate
a b
0) 1 :25 000 series - six stations
Ql.lI
Q2
Q5
(ii) 1: 100000 series - nine stations
Ql.lI
Q2
Q5
Symbols: Q
=
aMbo0.13 0.16 0.19
0.28 0.41 0.54
so, indicating that a unit stream at I: 100000 has on average a magnitude of about 3 at the larger scale. Although equation (5) explains the data quite well (fig. 6), it is not considered to be as reliable as equation (3) because that is based on 1 :25 000 maps which are both more recent and better defined as regards surface channels.
The fact that magnitude correlates reasonably well with Q2 (and other flood flows, table 4) implies that it could be an effective alternative to drainage area as an estimator of flood discharge. In choosing between the two, likely success in prediction and ease of measurement have already been mentioned as appropriate criteria. Judging from the higher correlation and lower standard error of estimate, drainage area seems to be superior as a predictor but the magnitude relationship, which is based on fewer points, could be improved when the entire area is mapped at the 1:25000 scale. As regards the second criterion, the measurement of drainage area is usually straightforward but can be time consum-ing if flow is to be estimated at many ungauged sites. On the other hand, magnitude is easily measured and, because network structure can be simply stored in a computer as a binary string, the magnitude of any point can be readily determined. The main requirement is consistency in the delinea-tion of networks and their constituent channels.
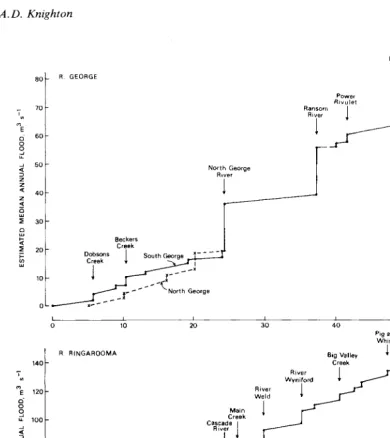
The use of magnitude has a further advantage. Since each channel link within a network has a particular magnitude, the discharge of each link can be estimated and the pattern of flow addition from tributary sources traced for major rivers. Based on measurements of network structure and the regional discharge-magnitude relationship (equation 3), the downstream pattern has been
0.82 0.97 0.12
0.93 0.97 0.13
1.00 0.97 0.15
0.92 0.98 0.12
1.01 0.98 0.14
1.06 0.97 0.17
plotted for the George and Ringarooma rivers (fig. 7). Scale limitations do not allow the smaller tributaries to be shown but there is sufficient detail to indicate major differences between the two river systems. Whereas the George is characterised by infrequent, large-scale additions of flow, concen-trated in the middle section, the Ringarooma has a more regular pattern with smaller but more fre-quent tributary contributions along the entire length of the river. In part these differences can be associated with the more elongate form of the Ringarooma basin (fig. 1). Such plots emphasize the discontinuous nature of flow addition, which has implications for the transport of sediment and the adjustment of channel form. They may also provide a basis for more efficient water manage-ment and for routing flood flows through drainage networks.
CONCLUSION
,-
.
ME
ci
0
~
;t
::J Z
Z
« z « 0
~
~
!;( ::;; i=
~
BO
70
60
50
40
30
20
10
R. GEORGE
Dobsons
Creek
1
Beckers Creek
1
North George Rivet
1
South George x
-I
_.1----x
_I .... - _ ... "" '--North George
L-.--_ _ ~
0 10 20
R. RINGAROOMA
140
,-0 Me 120
c·
0
~ 100
;t
::J
Z legerwood
z 80 Rivulet
«
Dorset
J
z River
«
0 60
1
~ Maur'ice
~ River
!;(
~I
::;;
i=
~
20
0
I I I I I
0 10 20 30 40 50
30
River Wyniford River
L
Weld
J
I
60 70
Power
Rivulet
1
40
Big Valley
Creek
I
I
80
!
90
Littlechilds
Creek
1
I
50
Pig and Whistle
~
I
100
!
60
I
110 120
DISTANCE DOWNSTREAM, km
FIG. 7 - The downstream pattern of flow addition estimated from equation (3) for the George and Ringarooma Rivers.
discharges (table 2, fig. 5). Atypically the higher magnitude floods increase faster with drainage area than do the lower magnitude ones, which may reflect limited storage during the downstream transmission of flood water. The analysis has also shown that the rivers in the neighbourhood of Swansea are hydrologically distinct, with flood
[image:10.600.55.445.164.602.2]Streamflow Characteristics of NE Tasmania, I. Regional Flood Flows 33
opposite quality. The Great M usselroe and particu-larly the Pipers Rivers show very little deviation from the regression lines and from that point of view may be regarded as typical basins worthy of more intensive study.
Network magnitude appears to offer a viable alternative to drainage area as an estimator of flood flows in single-variable equations. Its use provides an opportunity for charting the pattern of flow addition along major rivers (fig. 7) and may improve estimation procedures by taking account of tributary inflows. However, any further applica-tion must await the compleapplica-tion of the 1:25 000 map coverage on which surface channels are better defined. Indeed the overall need is for more data to improve the reliability of results. The relationships obtained in this initial study should be re-evaluated in five years' time when the data base is more extensive through both an increased length of record and a larger number of suitable gauging stations.
ACKNOWLEDGEMENTS
I wish to thank The Royal Society 'and the University of Sheffield Research Fund for financial assistance; Dr Les Wood, the Head of the Depart-ment of Geography, University of Tasmania, for providing study facilities; Mike Williams of the Hydro-Electric Commission; and particularly Douglas Steane and Andrew Livingston of the Rivers and Water Supply Commission for making their flow records available.
REFERENCES
DENSON, M.A., 1962: Factors influencing the occur-rence of floods in a humid region of diverse terrain. U.S. G.S. Water-Supply Pap. 1580-B:
64pp.
BENSON, M.A., 1968: Uniform flood frequency esti-mating methods for federal agencies, Water Resources Research, 4: 891-908,
DUNNE, T. & LEOPOLD, L.B., 1978: WATER IN ENVIRONMENTAL PLANNING. W.H.
Free-man, San Francisco.
KNIGHTON, D., 1984: FLUVIAL FORMS AND
PROCESSES. Edward Arnold, London.
NERC, 1975: FLOOD STUDIES REPORT. Natural
Environment Research Council, London. PICKUP, G., 1976: Geomorphic effects of changes in
river runoff, Cumberland Basin, N.S.W. Aus-tralian Geographer, 13: 188-193.
RIGGS, H.C., 1973: Regional analyses of streamflow characteristics. U.S.G.S. Techniques of Water-Resources Investigations, Bk 4, Ch B3: 15 pp.
RODRIGUEZ-ITURDE, I. & VALDES,J.B., 1979: The geomorphic structure of hydrologic response.
Water Resources Research, 15: 1409-1420.
SHAW, E.M., 1983: HYDROLOGY IN PRACTICE.
Van Nostrand Reinhold (UK), Wokingham. SHREVE, R.1,., 1967: Infinite topologically random
channel networks. J. Geol., 75: 178-187.
THOMAS, D.M. & BENSON, M.A., 1970: Generaliza-tion of streamflow characteristics from drainage-basin characteristics. U.S.G.S. Water-Supply Pap. 1975: 55 pp.
WATSON, B., 1975: Flood magnitude and frequency Part I: West Coast of Tasmania, Annual Flood Series. Hydro-Electric Commission, Investiga-tions Division Report: 9 pp.
WATSON, B. & WILLIAMS, M.L., 1983: Flood peak estimation for small catchments on the west coast of Tasmania. Hydro-Electric Commission, Investigations Division Report: 6 pp.