Coverage and Delay Forecast Modeling of Search
Engine Services
Yang Sok Kim1, Seong-Keon Lee2, Byeong Ho Kang1, and Raymond Williams1
1School of Computing, University of Tasmania, Sandy Bay,
7005 Tasmania, Australia
{yangsokk, bhkang, r.williams}@utas.edu.au
2Department of Statistics, Sungshin Women’s University,
249-1, Dongseon-Dong, Seongbuk-Ku, Seoul, 136-742 [email protected]
Abstract. Web information publishers are interested in how well their information is indexed by major search engines within short time, because the search engines are a main information access point for their web sites. Being the crawling policy of each search engine is usually commercial secret, it is useful to estimate each search engine’s coverage and delay with known predicator variables. This paper proposes forecasting models for service coverage and delay of search engines in the Australian government area using predictor variables, identified from the crawling policies of academic papers, and statistical regression methods. The Logistic regression method was employed for coverage forecast and Poisson regression method for delay. Our research results show that different explanatory variables were chosen for constructing models and their importance significantly varies among search engines.
Keywords: e-government, digital government information, search engines, search engine service coverage, search service delay
1 Introduction
Web information publishers are interest in how well their publications are indexed by major search engines, because the search engines are one of main information access point. However, the crawling policies which determine the indexing of search engines can not be assessed by outsiders, because they are usually their business confidential. This research was motivated by this fact and tries to forecast each search engine’s indexing performance for specific Web pages by using known predictor variables, which can be obtained academic literatures. Coverage (How much portion is indexed by a search engine?) and delay (How long it takes to index by a search engine?) are two important indexing performance measures of search engines.
)
(
)
(
)
(
i
W
i
W
i
C
m i
=
,where the
W
i(
i
)
is the number of Web page indexed by the search engine and the)
(
i
W
m is the number of Web pages published in the Web page i.The delay of a Web page (
D
(
i
)
) is defined as follows:)
(
)
(
) (
1
i
W
T
i
D
i i W
j dj
i
=
=
,where
T
dj is index delay time of Web page j,= ) (
1 i W
j dj
i
T
is sum of index delay time ofall indexed Web page.
This research aims to examine whether the statistical regression methods can be used to forecast the indexing coverage and delay of specific web page, assuming that each Web crawler’s current crawling policies are consistent and are affected by certain factors, called predictor variables.
The coverage and delay of a search service forecasting problem can be described as follows:
Let’s suppose that a Web page i (
P
i) is given for the forecast. The expected coverage (C
e) and the expected delay (D
e) are)
;
,...,
,
(
1 2 N ie
f
F
F
F
P
C
=
and)
;
,...,
,
(
1 2 M ie
g
G
G
G
P
D
=
respectively,2 Crawling Policies
The behavior of a Web crawler is the outcome of a combination of the following policies: a page selection policy, a revisit policy, a politeness policy, and a parallelization policy. Among these policies, the page selection policy and the revisit policy are closely related to the search service performance forecast. Firstly, a page selection policy determines which Web page should be crawled first. It is highly desirable that the collected fraction contains the most important pages, and not just a random sample[1]. In relation to this criteria, Arasu et al. [2] summarized that the importance metrics can be determined by the following factors:
• The importance metrics are obtained by calculating how the given Web page is relevant to the interest of a particular user or set of users. Traditional textual similarity measure [3] may be used for this purpose;
• The page importance depends on how “popular” a page is. Page rank and backlink count were usually used as the indicator of popularity [4, 5, 6, 7]; and • The importance of a Web page is decided by its location, not of its contents or
link structure. Domain type (e.g., “.com”), specific string of URL, and depth of URL are examples of location driven information metrics.
Secondly, a revisit policy determines when a Web crawler revisits the harvested Web pages to check whether or not they are changed. As Web pages are frequently changed, the Web crawler has to periodically revisit to keep the search engine repository up-to-date. The objective of the crawler is to keep the average freshness of pages in its collection as high as possible, or to keep the average age of pages as low as possible [8, 9]. Cho and Garcia-Molina [8] propose two simple revisiting policy – uniform policy and proportional policy. Whereas the former revisit the Web pages regardless of their rates of changes, the latter revisit the Web pages proportional to the (estimated) change frequency. On the contrary to the general expectation, Cho and Garcia-Molina found that the uniform policy outperforms the proportional policy in both a simulated Web and a real Web crawling. They explained that when a page changes too often, the crawler will waste time by trying to re-crawl it too past and still will not be able to keep its copy of the page fresh. Even though explicit formulas for the revisit policy are not attainable in general, Web page changes are the main factors that decide page revisit policy [1].
3 Predictor Variables
The identified predict variables include PageRank (PR), backlinks (BL), forward links (FL), type of domain (DT), page depth (PD), and page change frequency (CF). In this research, the coverage and delay of search engines will be forecasted by using these predict variables.
PageRank. PageRank is a numeric value representing a page’s importance on the
engine Google. According to [10], PageRank is calculated by using the following formula:
PR(A) = (1-d) + d (PR(T1)/C(T1) + ... + PR(Tn)/C(Tn)),
where PR(A) is the PageRank of page A, d is a damping factor, PR(Ti) is the PageRank of a page i to page A, C(Ti) is the number of links off the page i. The damping factor can be set between 0 and 1, but the Brin and Page nominally set it to 0.85. It is impossible to surmise the details of Google’s implementation since the publicly disseminated details of the 1998 papers [10, 11, 12]. PageRank assigns a vote to a page regardless of its content and therefore it is query-dependent. For this reason, Google uses PageRank in relation to other content based criteria. Nevertheless, PageRank remains “The heart of [Google’s] software … PageRank continues to play a central role in many of [Their] Web search tools.”, as cited from the Google Web page, http://www.google.com/technology/. PageRank was employed as an important factor deciding the crawler’s selection policy [2, 4, 13].
Backlinks. Backlinks are incoming links to a Website, or Web page, and the number
of backlinks being an indication of the popularity or importance of that Website or page [2, 4, 14]. Search engines often use a number of backlinks related to a Website as one of the factors for determining that Website’s search engine ranking. For example, Google’s PageRank algorithm uses backlinks to help determine a site’s rank (the Google Toolbar can be used to view the PageRank of a Web page). Like PageRank, the backlink count was employed as one of factors that determine crawler’s Web page selection policy [10, 11, 12].
Forward links. Forward links count refers to the number of links that originate from
a Web page. The revisit policy seems to be closely related to forward links count, because the freshness and age of local collections are the main measures that decide the revisit policy. As explained in [8], the revisit policy closely related to forward links count. For example, a Web page with many forward links is very valuable, since it may be an index page, which changes more frequently compared to non-index page. Forward links are also closely related to the Web page selection policy, especially the breadth-first crawling policy [7, 15]. Such an exploration is launched by following the links leading to those Web pages directly connected with the initial seed pages.
Domain Type. Domain type is decided by the domain name extension and is related
to the location driven importance metric of selection policy [2]. For example, some generic top-level domains (gTLD) such as “.com”, “.org”, and “.net” may be deemed more useful than Country Code Second-Level Domains (ccSLD), such as “.com.au”, “.org.au”, and “.net.au”. Domain types are also related to the revisit policy [8], because some domain types change more frequently compared to other domain types. For example, generic top-level domains (gTLD) such as “.com”, “.org”, and “.net” more frequently change compared to other domain types[16, 17].
Page Depth. Page depth is closely related to the Web page selection policy. There are
measures, such as “PageRank” [10] or “HIT”[20], to choose the next URL to be fetched aiming to reduce the overall computational and network workload. Whatever the crawler chooses any Web page selection policy, the above discussion shows that the page depth significantly affects the Web page selection policy. For this reason, the page depth was selected as a predictor variable.
Page Change Frequency. Web pages change continually overtime. Numerous
research have been conducted to reveal these changing characteristics. The revisit policy of the crawler is usually based on them [8, 9, 21]. Brewington and Cybenko [22, 23] developed an exponential probabilistic model for the time between individual Web page changes and a model for the distribution of the change rate defining those exponential distributions. They introduced the concept of (
α
,β
)-currency to define their notion of being up-to-date. A search engine for a collection is said to be of (α
,β
)-currency if a randomly chosen page in the collection has a search engine entry that isβ
-current with a probability at leastα
. Cho and Garcia-Molina [16] and Matloff [24] independently proposed a method for estimating the frequency of change of individual Web sites / pages based on the Poisson-process model. In accordance with [16], Cho et al. [8] studied how to refresh a local database to improve its ‘freshness.’ They formalized the notion of freshness by defining freshness and age.4 Data Set
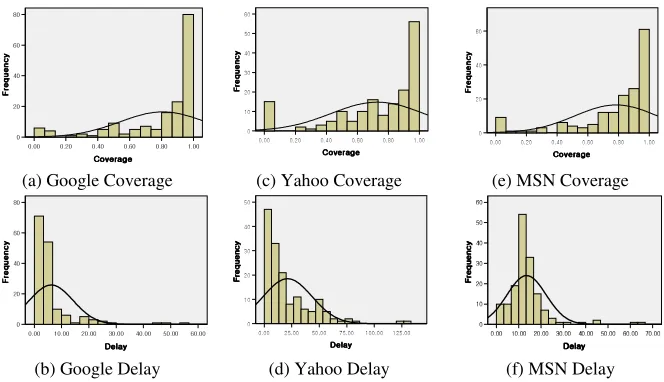
Newly uploaded Web pages were collected from the 166 Australian government Web pages from 1st January, 2007 to 15th July, 2007 (28 weeks) using a Web monitoring system, called WebMon [25]. A total of 6,227 pages were collected from these Web pages. The URLs of the collected Web pages was submitted to three major commercial search engines, Google, Yahoo, and MSN, to check whether or not they provided the collected Web pages. The underlying assumption is that use of the URL is suitable for checking the existence of any Web page in the search engine database, because of its uniqueness. The search engine evaluator checked everyday at 10:00 pm. If the collected Web page appeared in the search results, it was marked as a search engine served page and the delay time was recorded between the collection time of the Web monitoring system and the service time of the search engine. Overall coverage and delay of the three search engines is summarized in Table 1 and their distributions are illustrated in Figure 1. Each monitoring Web page’s coverage and delay results were used when coverage and delay forecast models were constructed.
Table 1 Service Coverage and Delay of Search Engines
Search Engines Coverage Delay
Google 83% 6.7 days
Yahoo 75% 14.0 days
!"#$! !!""##$$!! !"#$! % & '( )* + ), -. '( )* + ), -. '( )* + ), -. '( )* + ), -.
/011 1021 1031 1041 1051 1011
6879:;<=: 6879:;<=: 6879:;<=: 6879:;<=: 31 41 51 1 >? @A B @C DE >? @A B @C DE >? @A B @C DE >? @A B @C DE
(a) Google Coverage (c) Yahoo Coverage (e) MSN Coverage
FGHGG IGHGG JGHGG KGHGG LGHGG MGHGG GHGG
N8OPQR N8OPQR N8OPQR N8OPQR SG FG JG LG G TU VW X VY Z[ TU VW X VY Z[ TU VW X VY Z[ TU VW X VY Z[ \]^_`` \``_`` a^_`` ^`_`` ]^_`` `_``
b8cdef b8cdef b8cdef b8cdef ^` g` h` ]` \` ` ij kl m kn op ij kl m kn op ij kl m kn op ij kl m kn op
qrsrr trsrr ursrr vrsrr wrsrr xrsrr yrsrr rsrr
z {|}~ z {|}~ z {|}~ z {|}~ tr ur vr wr xr yr r
[image:6.595.134.466.146.337.2](b) Google Delay (d) Yahoo Delay (f) MSN Delay
Figure 1 Coverage and Delay Distributions
5 Modeling Methodology
5.1 Coverage Model
The Logistic regression method was used to model the coverage forecast, as it is the most common statistical method to use for analyzing data with dichotomous response variables. When the response variable is dichotomous, it is convenient to denote one of the outcomes as success and the other as failure. For example, if a patient is cured of a disease, the response is ‘success’, if not, then the response is ‘failure’. The logistic regression model describes the relationship between a dichotomous response variable Y, coded to take the values 1 or 0 for ‘success’ and ‘failure’, respectively, and k explanatory variables x1, x2, … , xk. The explanatory variables can be
quantitative or indicator variables referring to the levels of categorical variables. Since Y is a binary variable, it has a Bernoulli distribution with parameter p = P (Y = 1), that is, p is the probability of success for given values x1, x2,…, xk of the
explanatory variables. For a Bernoulli variable, the mean is described by E[Y] = P(Y =1) = p. The logistic regression model is defined as follows. Suppose that Y1, …, Yn
are independent Bernoulli variables, and let pi denote the mean value of Yi, that is, pi =
E[Yi] =P(Yi =1). The mean value pi can be expressed in terms of the explanatory
variables x1, x2,…, xkas
)
exp(
1
1
1 , 0 =−
−
+
=
kIf the logit-transformation is applied to the above equation, a linear relationship between logit(pi) and the explanatory variables is obtained:
logit
=
+
=
−
=
kj j i j
i i
i
x
p
p
p
1 ,
0
)
1
log(
)
(
β
β
The above equation is sometimes called the logit form of the model. Note that, logit(pi) is the log odds(that is, the logarithm of the odds) of success for the given x1,
x2,…, xk variables of the explanatory variables. In logistic regression, the parameters
are estimated using maximum likelihood estimation. In general, when the explanatory variables are quantitative, each of the regression parameters
β
1,
β
2,...,
β
kcan be interpreted as log odds ratios for the corresponding explanatory variable, when all other explanatory variables are held fixed. That is, the odds multiplier for xi is equalto
e
βi : When the explanatory variable xi is increased by 1 unit, and all other
explanatory variables are held constant, the odds of success is increased by a factor
i
e
β [26]. In logistic regression, hypotheses on significance of explanatory variablescannot be tested in quite the same way as in linear regression. Whereas the response variables are normally distributed, and t- or F-test statistics can be used for testing significance of explanatory variables in linear regression, the response variables are Bernoulli distributed, so different test statistics are required in logistic regression. The Wald statistic or the likelihood ratio is used for variable removal and the Score statistic is used to select variables for entry into the model.
5.2 Delay Model
The Poisson regression was used to model the delay estimation as it is often used to analyze count data and delay is a type of count data. Poisson regression can be used to model the number of occurrences of an event of interest or the rate of occurrence of an event of interest, as a function of some independent variables (e.g., the rate of insurance claims, number of doctor visits, incidence of diseases, crime incidence) [27]. The Poisson regression model is defined as follows. Suppose that Y1, …, Yn are
independent Poisson variables, and let
λ
i denote the mean value of Yi, that is,λ
i=E(Yi) Var(Yi)=
λ
i. The mean valueλ
i can be expressed in terms of the explanatoryvariables x1, x2,…, xkas
)
exp(
)
(
1 , 0
=
+
=
=
kj j i j i
i
x
Y
E
λ
β
β
.If the log-transformation is applied to the above equation, a linear relationship between log(
λ
i) and the explanatory variables is obtained:log
=
+
=
−
=
kj j i j i
i
i
x
1 , 0
)
1
log(
)
(
β
β
As Poisson distribution strongly assumes that events are independent, this distribution does not fit well if
λ
differs across observations (heterogeneity) [28]. In the Poisson regression, the parameters are estimated using maximum likelihood estimation.6 Modeling Results
6.1 Logistic Regression Results for Coverage
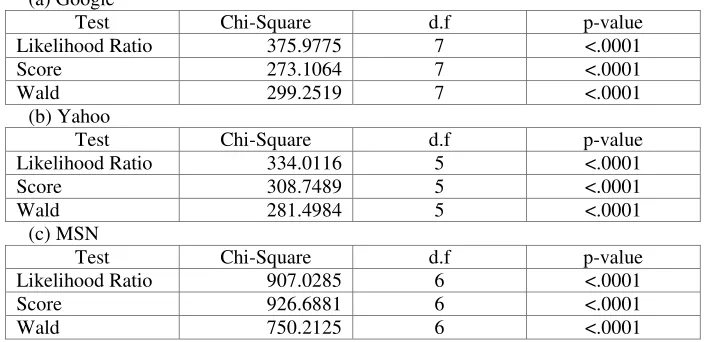
Regression was conducted against data sets of each search service and sum of all search engines results. A typical output of a logistic regression analysis starts by testing for overall regression that is, testing the null hypothesis H0:
β
1=
β
2=
...
=
β
k=
0
. Null hypothesis results for three search service data sets [image:8.595.122.475.388.559.2]for are summarized in Table 2, where the likelihood ratio test, the Score test, and the Wald test of all search services for testing H0 are rejected at the 5% significance level.
Table 2. Testing Global Null Hypothesis
(a) Google
Test Chi-Square d.f p-value
Likelihood Ratio 375.9775 7 <.0001
Score 273.1064 7 <.0001
Wald 299.2519 7 <.0001
(b) Yahoo
Test Chi-Square d.f p-value
Likelihood Ratio 334.0116 5 <.0001
Score 308.7489 5 <.0001
Wald 281.4984 5 <.0001
(c) MSN
Test Chi-Square d.f p-value
Likelihood Ratio 907.0285 6 <.0001
Score 926.6881 6 <.0001
Wald 750.2125 6 <.0001
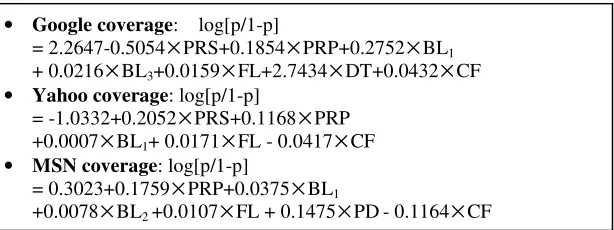
relationship with the coverage. The Google coverage has positive relationship with all selected variables except PRS, which is interesting point, because most revisit policy and page selection policy are based on the backlinks. It needs to be noted that the Google coverage model is that the parameter of DT (2.7434) significantly affects on the coverage, which means that Google’s crawling policy may be related to the domain type. The Yahoo coverage has positive relationship with all selected variables. The number of Yahoo’s explanatory variables is fewer when compared to other search engines. In the Yahoo coverage model, PRS and PRP significantly affect on the coverage compared to BL1 and FL. In the MSN coverage model, the largest number of variables was selected as explanatory variables. The third party page backlink count (BL3) only has negative relationship with the MSN coverage. PRP, DT, and PD most significantly affect on the coverage in the MSN coverage model.
Figure 2 Logistic Regression Coverage Model
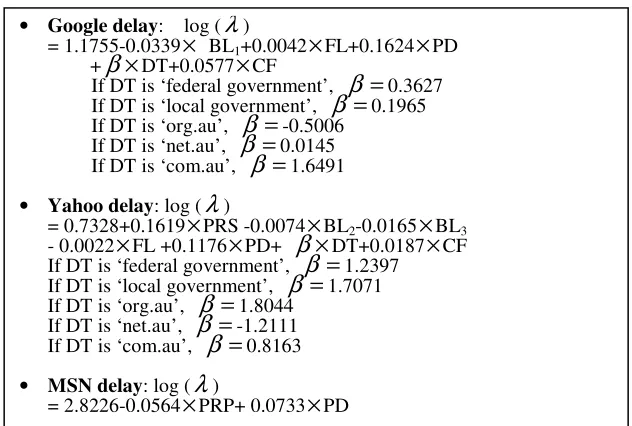
6.2 Poisson Regression Results for Delay
The fitted Poisson regression model for delay of three search engines with the Web page change frequency are summarized in Figure 3. The regression results show that the three search engines have different regression model. The selected explanatory variables are significantly different among search engines. Google’s explanatory variables are PageRank for page (PRP), self-reported backlink count (BL1), forward link count (FL), page depth (PD), domain type (DT), and change frequency (CF). All variables are positive relationship with the Google delay except BL1, which means delay increase as the PRP, FL, and PD increase. Among these three variables PD has most significant relationship with delay. The number of Yahoo’s explanatory variables is greater than those of other search engines. PageRank for site (PRS), third site Page backlink count (BL2), third party Page backlink count (BL3), forward link count (FL), domain type (DT), and page depth (PD) are the explanatory variables of Yahoo. Among them DT and PD significantly affect on the delay. MSN uses a very small number of explanatory variables - PageRank for page (PRP) and page depth (PD) and PD significantly affect on the delay. As analyzed above, PD is a common variable affecting delay models of the three search engines.
• Google coverage: log[p/1-p]
= 2.2647-0.5054
×
PRS+0.1854×
PRP+0.2752×
BL1 + 0.0216×
BL3+0.0159×
FL+2.7434×
DT+0.0432×
CF• Yahoo coverage: log[p/1-p]
= -1.0332+0.2052
×
PRS+0.1168×
PRP +0.0007×
BL1+ 0.0171×
FL - 0.0417×
CF• MSN coverage: log[p/1-p]
= 0.3023+0.1759
×
PRP+0.0375×
BL1Figure 3 Poisson Regression Delay Model
7 Conclusions
This paper identified predictor variables that decide the search engine’s coverage and delay, which include PageRank, backlink counts, forward link counts, domain type, page depth, and Web page change frequency. The logistic regression model was employed to construct the estimation model for the coverage, since the coverage is a type of dichotomous response variable. The Poisson regression model was employed to construct the estimation model for the delay, since the delay is a type of count data. The constructed model using these two regression mode shows that the three search engines have significantly different models for the coverage and delay. The results include the following findings: Firstly, the selected explanatory variables are different among search engines. For example, PageRank for site (PRS), PageRank for page(PRP), self backlink count (BL1), third party backlink count for page (BL1), forward link count (FL), domain type (DT) were used for the Google’s coverage model, but the Yahoo model only used PageRank for site (PRS), PRP, BL1, and FL. Secondly, some explanatory variable were commonly used for the model construction. The self backlink count (BL1) and forward link count (FL)) were commonly used in the coverage model and the page depth (PD) was commonly used in the delay model. Lastly, the important explanatory variables are different among search engines. In the coverage model, domain type is the most significant variable for the Google, PageRank for site (PRS) for Yahoo, and Domain Type for MSN. In the delay model, page depth (PD) is the most significant variable for the Google, PageRank for site (PRS) for Yahoo, and page depth (PD) for MSN.
• Google delay: log (
λ
)= 1.1755-0.0339
×
BL1+0.0042×
FL+0.1624×
PD+
β
×
DT+0.0577×
CFIf DT is ‘federal government’,
β
=
0.3627 If DT is ‘local government’,β
=
0.1965 If DT is ‘org.au’,β
=
-0.5006If DT is ‘net.au’,
β
=
0.0145 If DT is ‘com.au’,β
=
1.6491• Yahoo delay: log (
λ
)= 0.7328+0.1619
×
PRS -0.0074×
BL2-0.0165×
BL3 -0.0022×
FL +0.1176×
PD+β
×
DT+0.0187×
CF If DT is ‘federal government’,β
=
1.2397If DT is ‘local government’,
β
=
1.7071 If DT is ‘org.au’,β
=
1.8044If DT is ‘net.au’,
β
=
-1.2111 If DT is ‘com.au’,β
=
0.8163• MSN delay: log (
λ
)References
[1] Castillo, C., Effective Web Crawling, in Dept. of Computer Science. 2004, University of Chile.
[2] Arasu, A., J. Cho, H. Garcia-Molina, A. Paepcke, and S. Raghavan,
Searching the Web. ACM Transactions on Internet Technology (TOIT),
2001. 1(1): p. 2 - 43.
[3] Salton, G. and C. Buckley, Term Weighting Approaches in Automatic Text Retrieval. Information Processing and Management, 1988. 24(5): p. 513-523. [4] Cho, J., H. Garcia-Molina, and L. Page, Efficient crawling through URL
ordering. Computer Networks and ISDN Systems, 1998. vol.30, no.1-7: p. 161-172.
[5] Abiteboul, S., M. Preda, and G. Cobena. Adaptive on-line page importance computation. in 12th international conference on World Wide Web. 2003. Budapest, Hungary: ACM New York, NY, USA.
[6] Boldi, P., B. Codenotti, M. Santini, and S. Vigna, UbiCrawler: a scalable fully distributed Web crawler. Software: Practice and Experience, 2004.
34(8): p. 711 - 726.
[7] Najork, M. and J.L. Wiener. Breadth-First Crawling Yields High-Quality Pages. in 10th International World Wide Web Conference. 2001. Hong Kong: Elsevier Science.
[8] Cho, J. and H. Garcia-Molina, Effective page refresh policies for Web
crawlers. ACM Transactions on Database Systems (TODS), 2003. 28(4): p.
390 - 426.
[9] Coffman, E.G., Z. Liu, and R.R. Weber, Optimal robot scheduling for web search engines. Journal of Scheduling, 1997. 1(1): p. 15 - 29.
[10] Brin, S. and L. Page, The anatomy of a large-scale hypertextual Web search engine. Computer Networks and ISDN Systems, 1998. vol.30, no.1-7: p. 107-117.
[11] Page, L., S. Brin, R. Motwani, and T. Winograd, The PageRank Citation Ranking: Bringing Order to the Web. 1998, Stanford Digital Library Technologies Project. p. 17.
[12] Brin, S., R. Motwani, L. Page, and T. Winograd, What can you do with a Web in your Pocket? Data Engineering Bulletin, 1998. 21(2): p. 37-47. [13] Boldi, P., M. Santini, and S. Vigna. Do Your Worst to Make the Best:
Paradoxical Effects in PageRank Incremental Computations. in Third International Workshop on Algorithms and Models for the Web-Graph(WAW 2004). 2004. Rome, Italy.
[14] Cho, J. and H. Garcia-Molina. Parallel crawlers. in 11th international
conference on World Wide Web. 2002. Honolulu, Hawaii, USA.
[15] Baeza-Yates, R., C. Castillo, M. Marin, and A. Rodriguez. Crawling a country: better strategies than breadth-first for web page ordering. in 14th international conference on World Wide Web. 2005. Chiba, Japan.
[16] Cho, J. and H. Garcia-Molina, Estimating frequency of change. ACM Transactions on Internet Technology (TOIT), 2003. 3(3): p. 256 - 290. [17] Koehler, W., A longitudinal study of Web pages continued: a report after six
[18] Bergmark, D., C. Lagoze, and A. Sbityakov. Focused Crawls, Tunneling, and Digital Libraries. in 6th European Conference on Research and Advanced Technology for Digital Libraries. 2002: Springer-Verlag London, UK.
[19] Chakrabarti, S., M.M. Joshi, K. Punera, and D.M. Pennock. The structure of broad topics on the web. in 11th international conference on World Wide Web. 2002. Honolulu, Hawaii, USA: ACM New York, NY, USA. [20] Kleinberg, J.M., Authoritative sources in a hyperlinked environment. Journal
of the ACM, 1999. 46(5): p. 604-632.
[21] Castillo, C., M. Marin, A. Rodriguez, and R. Baeza-Yates, Scheduling
algorithms for Web crawling. Proceedings. WebMedia & LA-Web 2004,
2004: p. 10-17.
[22] Brewington, B.E. and G. Cybenko, Keeping Up with the Changing Web.
Computer, 2000. 33(5): p. 52-58.
[23] Brewington, B.E. and G. Cybenko, How dynamic is the Web? Computer Networks, 2000. 33: p. 257-276.
[24] Matloff, N., Estimation of internet file-access/modification rates from
indirect data. ACM Transactions on Modeling and Computer Simulation
(TOMACS), 2005. 15(3): p. 233 - 253.
[25] Park, S.S., S.K. Kim, and B.H. Kang. Web Information Management System: Personalization and Generalization. in the IADIS International Conference
WWW/Internet 2003. 2003. Algarve, Portugal.
[26] Larsen, P.V., Module 14: Logistic regression. 2008. p. Course Material. [27] Cameron, A.C. and P.K. Trivedi, Regression Analysis of Count Data. 1998,
New York, USA: Cambridge University Press.