CHAPTER
17
PCR-based methods to determine
DNA methylation status at specific
CpG sites using methylation-sensitive
restriction enzymes
Helmtrud I. Roach and Ko Hashimoto
In recent years, there has been an explosion of interest in epigenetics, which refers to heritable changes in gene expression without alteration in the DNA sequence. The major epigenetic changes are histone acetylation and DNA methylation. Methylation takes place at cytosines that are adjacent to guanines, the so-called CpG sites. However, very little information is available on the methylation status of particular CpG sites in the promoter regions of specific genes from different cell types or cells from different developmental stages. This is due to several factors:
1. While DNA sequence analysis can be carried out on DNA extracted from any cell in the body, the methylation status for a particular gene is cell-type specific and thus needs to be analyzed separately for each tissue.
2. As PCR amplifications eliminate all CpG methylation, it is necessary to obtain sufficient genomic DNA directly from the relevant tissue/cells rather than by amplification of specific DNA segments.
3. Although the bisulfite modification method of detecting the presence or absence of methylation (see Chapter 16) gives valuable results, it is not best suited in all instances.
On the whole, conformationally relaxed chromatin (euchromatin) indicates transcriptionally active regions and is associated with hypomethylated DNA and acetylated histones, whereas compact chromatin (heterochromatin) is transcriptionally silent, hypermethylated, and bound to nonacetylated histones. DNA methylation is thus one of the principal mechanisms by which cells maintain
1. INTRODUCTION
PCR: (S. Hughes and A. Moody, eds.) ©Scion Publishing Limited, 2007
a stable chromatin configuration that regulates transcription. For further details, see (1–6).
2.1 Methylation-sensitive restriction enzymes (MSREs)
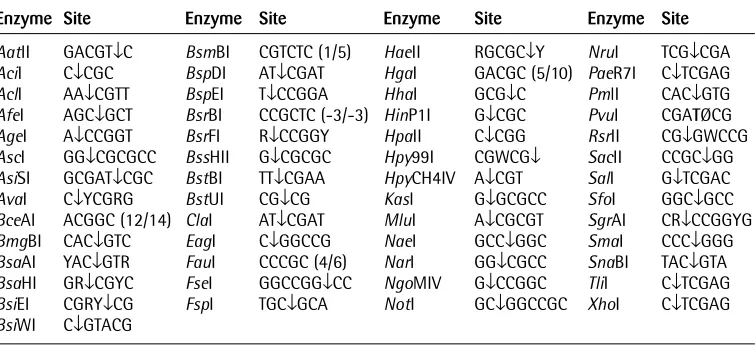
The methylation sensitivity of certain restriction enzymes provides an elegant and straightforward method of assessing methylation status of specific CpG sites. There are over 50 such enzymes (see Table 1), all of which have at least one CpG site within their recognition sequence. However, the cleavage site is not necessarily within the CpG site or within the recognition sequence, as illustrated for BceAI below, where the cleavage site is 12 bp downstream from the last base of the recognition sequence for the top strand and 14 bp upstream for the complementary strand:
[image:2.595.110.488.460.634.2]5¢-ACGGCNNNNNNNNNNNNØNN-3¢ 3¢-TGCCGNNNNNNNNNNNNNNØ-5¢
2. METHODS AND APPROACHES
Table 1. Recognition sequences and sites of cleavage of commercially available MRSEs
In some cases, the cleavage site is some distance away from the recognition site. In this case, the numbers in parentheses indicate the distance between the last given nucleotide and the cleavage site. The first number is for the 5¢Æ3¢strand and the second for the complementary strand. W = A or T; Y = C or T; R = G or A. From: http://rebase.neb.com/rebase/rebase.html.
Enzyme Site Enzyme Site Enzyme Site Enzyme Site
AatII GACGTØC BsmBI CGTCTC (1/5) HaeII RGCGCØY NruI TCGØCGA
AciI CØCGC BspDI ATØCGAT HgaI GACGC (5/10) PaeR7I CØTCGAG
AclI AAØCGTT BspEI TØCCGGA HhaI GCGØC PmlI CACØGTG
AfeI AGCØGCT BsrBI CCGCTC (-3/-3) HinP1I GØCGC PvuI CGATØCG
AgeI AØCCGGT BsrFI RØCCGGY HpaII CØCGG RsrII CGØGWCCG
AscI GGØCGCGCC BssHII GØCGCGC Hpy99I CGWCGØ SacII CCGCØGG
AsiSI GCGATØCGC BstBI TTØCGAA HpyCH4IV AØCGT SalI GØTCGAC
AvaI CØYCGRG BstUI CGØCG KasI GØGCGCC SfoI GGCØGCC
BceAI ACGGC (12/14) ClaI ATØCGAT MluI AØCGCGT SgrAI CRØCCGGYG
BmgBI CACØGTC EagI CØGGCCG NaeI GCCØGGC SmaI CCCØGGG
BsaAI YACØGTR FauI CCCGC (4/6) NarI GGØCGCC SnaBI TACØGTA
BsaHI GRØCGYC FseI GGCCGGØCC NgoMIV GØCCGGC TliI CØTCGAG
BsiEI CGRYØCG FspI TGCØGCA NotI GCØGGCCGC XhoI CØTCGAG
2.2 Principle of the MSRE PCR method
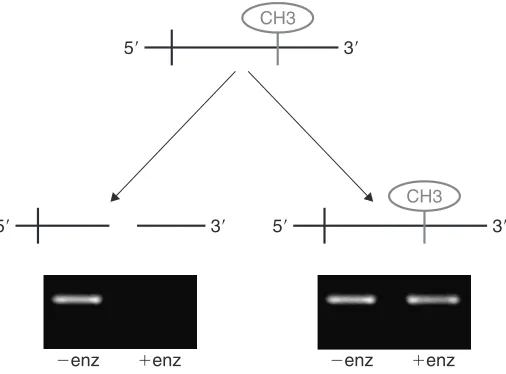
The principle of this method is illustrated in Fig. 1. If the cytosine of a specific CpG site is not methylated, then the enzymes cleave as expected. However, if the cytosine of the CpG is methylated, then the enzymes cannot cleave and the DNA remains intact. By designing suitable primer pairs that bracket the region of interest, the presence or absence of methylation can be determined by the presence or absence of a PCR band following enzymatic digestion. The MSRE method is relatively easy and is particularly suitable for promoters with a limited number of CpG sites and if only small quantities of DNA are available. There are, however, two points for consideration:
• MSREs might not be available for a specific CpG site of interest.
• There may be several CpG sites cut by the same MSRE within the PCR-amplified region.
The latter is a particular problem for CpG island promoters, where the concentration of CpGs is very high and will require careful primer design (see section 2.3). However, if the aim is preliminary scanning of CpGs, for example to provide ‘proof of concept’ data that a change in methylation has taken place somewhere, then the MSRE method will provide useful results.
3⬘
CH3
CH3
5⬘
3⬘ 5⬘
3⬘ 5⬘
⫺enz ⫹enz
[image:3.595.168.421.146.333.2]⫺enz ⫹enz
Figure 1. Principles of the MRSE assay for methylation status at specific CpG sites.
2.3 Identifying CpG sites and suitable MSREs
To find the promoter region sequence for the gene of interest, we recommend using the National Center for Biotechnology Information (NCBI) website (http://www.ncbi.nlm.nih.gov/).
• Select the ‘Gene’ option in the drop-down search box on the left. Type in the name of the gene of interest and then select the appropriate species from the list given. Scroll down to the section titled ‘Related sequences’, which, in most cases, will provide a list of accession numbers for genomic DNA. Clicking on the separate accession numbers should identify a file containing 1000–2000 bp of sequence upstream of the transcription start site, which corresponds to the promoter. Knowledge of the characteristics of the promoter will help to identify the most relevant area. If this information is not available, concentrate initially on the sequence ~1000 bp upstream of exon 1. • Copy the sequence into Microsoft Word, then use the ‘Find/replace’ facility to mark all ‘CG’s by replacing them with CG (in bold, larger font and maybe change the color to red). Do the same for ‘C G’, then scan the right-hand edge for single Cs and determine whether the next line contains a ‘G’. This will immediately give you useful information about whether the promoter contains a CpG island (many closely spaced CpG sites) or is a sparse CpG promoter.
• To find out which MSREs cut your sequence, go to
http://www.restrictionmapper.org/ and select all 53 MSREs (listed in Table 1). • Paste your sequence of interest into the box in the ‘Sequence Info’ section and
click on ‘Map sites’. This will generate a list of MRSEs that cut within your sequence and their cut positions. If you have more than one sequence to map, it is useful to do this straight away, as the program remembers the selected MSREs. Use the information to map the cut positions onto your sequence. • Design PCR primers to bracket the region of interest. Primers should be located
2.4 Extraction of nucleic acids
In most studies, the aim is to link DNA methylation status directly to mRNA expression, for example, to determine whether loss of methylation at a particular CpG site is associated with induction of gene expression. In this case, simultaneous extraction of genomic DNA and RNA from the same specimen is highly desirable. However, in practice, this is not always possible. A particular problem arises if the tissue contains a lot of extracellular matrix with relatively few cells, as is the case for adult articular cartilage or muscle fibers. There are many commercially available kits (e.g. Qiagen) for the extraction of either RNA or DNA. However, combined kits for simultaneous RNA and DNA extraction are so far only available as microkits suitable for cells, not for whole tissues.
If DNA (or RNA) is to be extracted directly from whole tissues, a freezer mill is ideal to grind the tissue under liquid nitrogen into a fine powder (see Protocol 1). We have successfully used the Spex Certiprep 6750 for grinding human articular cartilage.
MMP-13a
⫺535 AciI
⫺544 BstB⫺343I ⫺Hpy323
Aval
⫺136 Hpy
⫺110
AciI
⫺14 Hha⫹70I
⫺493 ⫺225 ⫺115
[image:5.595.165.489.157.258.2]MMP-13b
Figure 2. Example of a promoter suitable for the MSRE assay.
Protocol 1
Preparation of tissue for DNA or RNA extraction using a
freezer mill
Equipment and Reagents
■ Freezer mill (Spex Certiprep or similar) ■ 10 ml Sterile tube
■ Small spatula (to scoop out smashed specimen) ■ Weighing scales
Method
1. Work in a well-ventilated room.
2. Pre-cool the freezer mill as instructed by the manufacturer.
3. Pour liquid nitrogen into the freezer milla. Close the lid slowly to avoid spitting of the liquid nitrogen, as it boils vigorously the first time it is poured.
4. Weigh a 10 ml sterile tube.
5. Transfer samples into freezer mill cylinders with a metal rod, pre-cool, and run the milling cycles as instructed. Two samples can be pre-cooled while the first is being milled.
6. Scoop out the smashed samples and put them into the 10 ml tube using the spatulab.
7. Reweigh the tube and calculate the milled weight of the sample (100–500 mg is ideal)c.
8. Add lysis buffer as used in the DNA or RNA extraction kit and store the sample at –20°C or proceed directly to nucleic acid extraction (see Protocol 2).
9. Wash the cylinders and prepare the next samples.
Notes
aWear a long-sleeved laboratory coat, cryo-resistant gloves, and goggles when handling liquid nitrogen.
bThe yield of milled powder may be low as some sample inevitably remains inside the cylinder or attached to the metal rods. If complete recovery of the sample is critical, lysis buffer may be added directly to the mill cylinders.
cIf both RNA and DNA are to be extracted from the same sample, it is best to split the milled powder into two and then use a maxi or midi kit for RNA or DNA, respectively. Alternatively, isolate the cells from the tissue prior to RNA/DNA extraction, as in Protocol 2.
2.4.1 Simultaneous extraction of RNA and DNA from cells
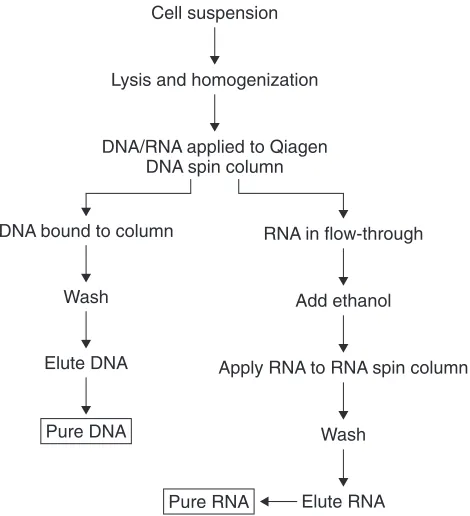
Depending on the tissue, it may be possible to isolate the cells from their matrix prior to DNA or RNA extraction. This has the advantage that no freezer mill is required and kits for simultaneous extraction of RNA and DNA can be used (see
Protocol 2
Simultaneous extraction of RNA and DNA from cells
Equipment and Reagents■ AllPrep DNA/RNA mini kit (Qiagen) ■ High-speed centrifuge
■ 2-Mercaptoethanol (Sigma) ■ 70% Ethanol
■ DNase I (Qiagen)
Method
1. The initial number of cells should not exceed 1 ¥107cells and it recommended to start with approximately 3 ¥106to 4 ¥106cellsa,b.
2. Add 2-mercaptoethanol or ethanol to the relevant buffers following the manufacturer’s instructions.
3. Add 350–600 mlcof lysis buffer to 3 ¥106to 1 ¥107cells. Vortex and pass the lysate at least five times through a 20-gauge needle fitted to an RNase-free syringe, which homogenizes the cells.
4. Apply the lysate to an AllPrep DNA spin column placed in a 2 ml collection tube. Genomic DNA will bind to the DNA spin column.
5. Centrifuge for 1 min at ≥10 000 r.p.m. at room temperature.
6. Place the AllPrep DNA spin column in a new 2 ml collection tube and store at 4°C for later DNA purification. The flow-through will contain RNA.
7. RNA and DNA can be purified from the flow-through and spin column, respectively, following the manufacturer’s instructions.
8. If possible, reverse transcribe the RNA immediatelyd.
9. Quantify the RNA and DNA using a spectrophotometere.
Notes
aIn human articular cartilage, cells only represent 3–5% of the tissue. Cells can be isolated by sequential treatment with:
• Trypsin (10% in PBS) for 30 min at 37°C
• Hyaluronidase (1 mg/ml in PBS) for 15 min at 37°C • Collagenase B (10 mg/ml, Roche) for 12–15 h
The cells can then be washed in PBS and the cell suspension filtered through a sterile 70 mm sterile cell strainer, followed by centrifugation for 5 min at 1700 r.p.m. The main steps in this procedure are summarized in Fig. 3.
bIn practice, a confluent T25 flask provides just enough cells, whilst a confluent T80 flask is ample. cThe volume of lysis buffer and wash buffer depends on the number of starting cells: for up to 3 ¥106cells use 350 ml of lysis buffer, and for up to 1 ¥107cells use 600 ml of lysis buffer. dIt is highly advisable to reverse transcribe RNA immediately into cDNA, which only takes a further 1.5 h. Alternatively, RNA can be frozen at –80°C.
2.5 Detection of methylation status using MSREs
Although the bisulfite modification method has been used more extensively for determining methylation status, several groups have successfully used the MSRE PCR method (see Protocols 3and 4) (7–9).
Cell suspension
Lysis and homogenization
DNA/RNA applied to Qiagen DNA spin column
RNA in flow-through
Add ethanol
Apply RNA to RNA spin column
Wash Wash
DNA bound to column
Elute RNA Elute DNA
Pure DNA
[image:8.595.166.401.146.404.2]Pure RNA
Protocol 3
Restriction enzyme digest
Equipment and Reagents ■ Genomic DNA (5–10 ng/ml)■ Thermal cycler with heated lidaor water bath (37 or 65°C) ■ Restriction enzyme(s)
■ Relevant buffer and 100¥bovine serum albumin (BSA) if required (New England Biolabs or similar)
■ PCR-grade DNase/RNAse-free water ■ PCR tubes, pipettes, and tips
Method
1. Check the concentration of supplied enzyme. For a 10 ml reaction, ~2–4 units are requiredb.
2. For each reaction, set upc:
■ 9 ml of extracted genomic DNA (5 ng/ml) ■ 1 ml of 10¥buffer
■ 0.1 ml of 100¥BSA (if required)
■ 0.2–2 ml of restriction enzyme, containing 2–4 units of activity
3. For each specimen, set up a parallel sample, omitting the enzyme. This will be the no-enzyme control for the PCR.
4. Incubate at the recommended temperature for the enzyme (usually 37°C) for the recommended time (usually overnight).
5. To denature the enzyme, heat at 65°C (some enzymes need 80°C or cooling at 4°C) for 10–20 min.
6. Enzyme-treated DNA may be stored for up to 1 week at 4°C, but it is best to carry out the PCR immediately after enzyme digestion.
Notes
aThe heated lid of a thermal cycler prevents condensation of the reaction mixture on the lid of the tube, which may be a problem in a water bath or incubator.
bToo much enzyme or incubation for too long increases nonspecific digestion, whilst digestion will not be complete when using too little enzyme or too short a time interval. Hence, it is essential to perform preliminary studies for each enzyme, using universally methylated DNA (Chemicon International, cat. no. S7821) or universally nonmethylated DNA. The latter can be obtained, using the GenomiPhi v2 DNA amplification kit (GE Healthcare Life Sciences).
Protocol 4
PCR
Equipment and Reagents ■ Digested DNA from Protocol 3
■ Platinum PCR SuperMix (Invitrogen) containing PCR buffer, MgCl2, and dNTPs ■ Oligonucleotides (10 mM)
■ Thermal cycler
■ 2% Agarose gel containing 10 ng/ml ethidium bromide ■ 6¥Orange loading dye solution (Fermentas)
■ Equipment and reagents for agarose gel electrophoresis including 1¥ TBE agarose gel running buffer (10.8 g/l Tris base; 5.5 g/l boric acid; 4 ml/l 0.5 M EDTA, pH 8.0, diluted from a 10¥stock; Sigma)
■ DNA size marker (100 bp ladder; Invitrogen) ■ UV light source
Method
1. Combine per 25 ml reaction (it is not necessary to have a 50 ml reaction mixture, as recommended by the Invitrogen protocol):
■ 23 ml Platinum PCR SuperMix
■ 0.5 ml of each forward and reverse primer ■ 1 ml of DNAa
2. Mix briefly by vortexing or pipetting. Centrifuge at 12 000 gg for 5–10 s to consolidate the sample.
3. Amplify the DNA using the following PCR profile: ■ 94°C for 2 min
■ 35 cycles of 94°C for 30 s, annealing using at a primer-dependent temperature for 30 s, and 72°C for 1 min
■ 72ºC for 5 min
4. Analyze the PCR products by mixing 10 µl of the reaction mix with 1 µl of 6¥orange loading dye solution and resolving the sample by agarose gel electrophoresis alongside a DNA size markerb.
Notes
aIt is important to PCR amplify the no-enzyme control DNA in order to assess the effect of enzymatic digestion on the PCR. A negative control is also essential to determine any possible PCR contamination.
2.6 Applications
In normal adult articular cartilage, the expression of proteases, such as MMP-13, is silenced. However, in osteoarthritis, many cartilage cells abnormally produce the enzyme, as has been shown by immunocytochemistry. Moreover, this abnormal expression is stably transmitted to daughter cells. These observations suggest that demethylation at some CpG sites in the promoter of the MMP-13 might have ‘unsilenced’ the gene and thus permitted abnormal expression of the protease. To test this hypothesis, genomic DNA isolated directly from human articular cartilage was subject to MRSE analysis for MMP-13. As can be seen in Fig. 4, all sites were fully methylated in control cartilage, but loss of DNA methylation was found at two CpG sites at –110 and –136 bp in the osteoarthritic specimen. When 16 osteoarthritis samples were compared with ten controls, demethylation at the
HpyCH4IV-cleavable site at –110 bp was present in the majority of osteoarthritis samples (7), which suggests that this particular CpG site may be important in the epigenetic ‘unsilencing’ of gene expression.
Control cartilage
Primer MMP-13a Primer MMP-13b 5⬘-Flanking region of MMP-13
[image:11.595.164.490.372.512.2]Osteoarthritic cartilage No enzyme ⫹ Av a I ( ⫺ 136) ⫹ Hpy ( ⫺ 1 10) ⫹ Aci I ( ⫺ 14) ⫹ Hha I ( ⫹ 70) No enzyme ⫹ Aci I ( ⫺ 544) ⫹ BstB I ( ⫺ 343) ⫹ Hpy ( ⫺ 323)
Figure 4. PCR of genomic DNA after treatment with MSREs.
Results are shown for the promoter region of MMP-13 in normal articular cartilage (top row) compared with osteoarthritic cartilage (bottom row). All of the CpG sites in normal articular cartilage are methylated, as indicated by the presence of PCR bands. Many of these CpG sites are also methylated in the osteoarthritic sample (asterisks). However, loss of methylation could be demonstrated in many osteoarthritic patients at the AvaI site at –134 bp and the HpyCH4IV site at –110 bp (arrows). Reprinted with permission from (7).
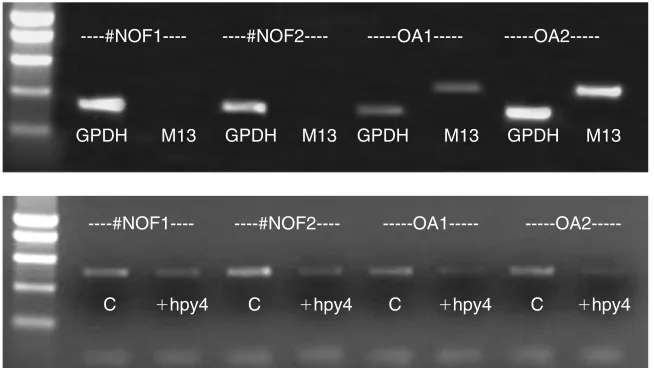
In parallel experiments, reverse transcriptase PCR demonstrated clear induction of MMP-13 in osteoarthritis samples with no expression in control (fracture neck of femur, #NOF) samples (see Fig. 5). MRSE analysis of the same samples using the
expression, it also pinpoints some of the problems of using conventional PCR for methylation detection (see section 3). The reduced intensity of the PCR bands for control samples could have been due to overdigestion or loss of methylation in some cells. In the latter case, this loss of methylation obviously was not yet sufficient to induce gene transcription. In the first osteoarthritis sample (OA1), a faint band was still present, but was very weak compared with the no-enzyme control. We would interpret this as absence of methylation.
• A band is still present after enzyme digestion for the no-methylation control
As this negative control is universally unmethylated, one would expect an absence of bands for all enzyme/primer combinations. If a PCR band is still seen, then the conditions for enzyme digestion were not sufficient to produce complete digestion. Increase the enzyme concentration or the length of digestion (but see overdigestion below). As PCR is involved, a reduction in the number of cycles may also be beneficial.
• Loss of band intensity is observed in the methylated control
As this control is universally methylated, one should not see any significant loss in band intensity after enzyme digestion. However, in practice we nearly
3. TROUBLESHOOTING
----#NOF1---- ----#NOF2---- ---OA1---
---OA2---#NOF1---- ----#NOF2---- ---OA1--- ---OA2---GPDH M13 GPDH M13 GPDH M13 GPDH M13
[image:12.595.163.490.145.329.2]C ⫹hpy4 CC⫹hpy4 ⫹hpy4 C ⫹hpy4
Figure 5. Combined determination of mRNA expression (top) and DNA methylation status (bottom).
always observe some loss in intensity, presumably due to nonspecific DNA degradation. If the PCR band is considerably reduced in intensity compared with the no-enzyme control, then there is too much nonspecific degradation, possibly following overdigestion. Reduce the enzyme concentration or the length of digestion.
• In a specimen where loss of methylation would be expected, a weak band is still visible
If conditions have been optimized using the positive and negative DNA controls, the presence of a weak band in enzyme-treated samples may be due in part to the nature of PCR and in part to the heterogeneity of the cells. If a strong band is found in the no-enzyme control together with a weak band in the enzyme-treated sample, a reduction in the number of PCR cycles may eliminate the weak band, whilst still showing the presence of a band in the no-enzyme control.
• Heterogeneity of the cells with respect to the methylation status of a particular CpG site
This is a problem in both the MSRE PCR and the bisulfite modification methods. In any one cell, a particular CpG site is either methylated or not methylated, but this methylation status may vary within the cell population. For example, assume that a particular gene is induced in a specific situation so that 30% of the cells express this gene. Reverse transcriptase PCR will easily demonstrate expression where there was none prior to induction. Let us further assume that the induction was associated with loss of methylation at a specific CpG site, i.e. this CpG site had become demethylated in 30% of the cells. However, as this CpG site is still methylated in 70% of the cells, a strong PCR band would be present. Thus, it would be impossible to demonstrate changes in methylation status, even though these were present. To overcome these difficulties, we would recommend developing real-time PCR assays to measure the degree of methylation.
• No PCR band is visible in the no-enzyme control
If the total amount of genomic DNA is too low, no PCR band may be visible in the no-enzyme control. In this case, either amplify for a further 5–10 cycles (recommended if a very faint band is visible) or use the PCR product for a further round of 30–35 cycles of PCR using the same primers. This is quite successful for most primers, but nonspecific amplification and additional random bands can also occur. In this case, design nested primers for the second round of PCR to amplify a region just inside the first primer product. This will usually eliminate the spurious additional bands.
1. Roach HI & Aigner T(2006) Osteoarthritis Cartilage, 15, 128–137.
2. Rodenhiser D & Mann M(2006) CMAJ. 174, 341–348. – A good review of the epigenetic literature in a clinical setting.
3. Kress C, Thomassin H & Grange T(2001) FEBS Lett.494, 135–140.
5. Fuks F(2005) Curr. Opin. Genet. Dev.15, 490–495.
6. Davis CD & Uthus EO(2004) Exp. Biol. Med. (Maywood)229, 988–995.
7. Roach HI, Yamada N, Cheung KS, et al.(2005) Arthritis Rheum.52, 3110–3124. – A good review of the methods described in this chapter.
8. Singer-Sam J, Goldstein L, Dai A, Gartler SM & Riggs AD(1992) Proc. Natl. Acad. Sci. U.S.A.89, 1413–1417.